Abstract
A method to characterize shock wave lithotripters by examining the potential for cavitation associated with the lithotripter shock wave (LSW) has been developed. The method uses the maximum radius achieved by a bubble subjected to a LSW as a representation of the cavitation potential for that region in the lithotripter. It is found that the maximum radius is determined by the work done on a bubble by the LSW. The method is used to characterize two reflectors: an ellipsoidal reflector and an ellipsoidal reflector with an insert. The results show that the use of an insert reduced the −6 dB volume (with respect to peak positive pressure) from 1.6 to 0.4 cm3, the −6 dB volume (with respect to peak negative pressure) from 14.5 to 8.3 cm3, and reduced the volume characterized by high cavitation potential (i.e., regions characterized by bubbles with radii larger than 429 µm) from 103 to 26 cm3. Thus, the insert is an effective way to localize the potentially damaging effects of shock wave lithotripsy, and suggests an approach to optimize the shape of the reflector.
I. INTRODUCTION
Shock wave lithotripsy (SWL)1 is a noninvasive procedure that uses high-energy lithotripter shock waves (LSWs) to eliminate kidney stones. In a typical procedure, approximately 2000 LSWs, generated extracorporeally, are focused at the site of the stone. This pulverizes the stone into grains that can be passed through the patient’s urinary system. Since its development in 1980, SWL has become a primary treatment modality for upper urinary stones. However, there are growing concerns for SWL-induced renal injuries such as hemorrhaging2 and acute impairment,3 especially in pediatric and elderly patients.
There are several types of lithotripters in clinical use: electrohydraulic (EH), piezoelectric, and electromagnetic.4 Each is based on concentrating acoustic waves at the focus of a conic section using reflectors, spherical dishes, or an acoustic lens. The first lithotripter used in the United States was the Dornier HM-3. It is a reflector-based EH lithotripter, and has become the comparison standard for new lithotripter designs.
Reflector-based EH lithotripters are driven by an electrical discharge produced by a spark gap located at the first focus of an ellipsoidal bowl (F1). Rapid expansion and/or vaporization of the working medium—water for most cases—generates a spherical shock wave. There are two distinct parts of the spherical shock wave. The first part does not intercept the reflector and travels outward in the direction of the second focus of the ellipsoid (F2). This part is called the direct wave. The second part is reflected by the lithotripter and redirected toward F2. This part is the reflected wave. It is the primary wave and is what is referred to as the LSW. As the reflected wave propagates through the patient’s body, it steepens through geometric focusing and hyperbolic effects and causes damage to the kidney stone. The form of a LSW consists of an initial (compressive) shock wave followed by a long rarefaction tail.4
Studies have shown that cavitation, caused by the high tensile stresses of the LSW tail, plays a major role in tissue damage in SWL. It is shown that the rarefaction tail of a LSW causes pre-existing cavitation nuclei to expand and collapse violently. The expansion of bubbles ruptures small capillaries and the formation of strong jets during violent collapses may damage larger vessels.5 Furthermore, studies of pressure-release lithotripters6 in which cavitation intensity is inhibited show a minimal effect on kidney morphology.7
Cavitation also plays an important and favorable role in stone comminution. High-speed photographs of kidney stones in vitro have shown that fissures created by the LSW8 are nucleation sites for bubble clusters. The cavitation of these bubble clusters leads to pits on the proximal end and cracks on the lateral faces of kidney stones.9 Therefore, efforts have been made to control cavitation intensity in SWL in order to increase stone comminution. These include use of a dual-pulse lithotripter,10 alignment of the kidney stone with the location of greatest cavitation activity,11 and use of a piezoelectric annular array (PEAA) generator in conjunction with an EH lithotripter to force cavitating bubbles into a stronger collapse.12
Because cavitation is needed for sufficient comminution of kidney stones but leads to vessel rupture, several methods have been studied in order to address the issue of cavitation localization. The use of deflector plates has been shown to make the focus tighter through the elimination of paraxial sound rays.13 A wave superposition technique has been developed to modify the form of the LSW so that intraluminal bubble expansion could be suppressed. This was done by using an ellipsoidal insert14,15 and/or PEAA16 to generate a two-peaked LSW. A two-peaked LSW was also generated through the use of a bifocal reflector created by joining two ellipsoidal halves together.17
With many different lithotripter designs being developed, it is necessary to have a technique to characterize different designs. Such a methodology exists for clinical diagnostic ultrasound equipment. In 1980, Holland and Apfel showed that their mechanical index (MI),18 defined as
| (1) |
can be used to assess the likelihood of cavitation for pulsed ultrasound devices. Here, P*=P/ (1 MPa) is the normalized pressure, P is largest rarefaction pressure in megapascals, f* = f / (1 MHz) is the normalized frequency with f in MHz, and a≈2 for physiologically relevant host fluids. However, the MI failed when used to characterize shock wave lithotripters19 because LSWs lie outside the regime where the MI is expected to be valid. That is, the time scale of the expansion phase of a bubble forced by a LSW is much longer than the pulse length of the LSW.
In this paper, we present an alternative approach to characterizing lithotripters. The method is based on calculating the maximum radius a bubble attains if placed within a lithotripter as a representation of the cavitation potential for that region in the device. We use the maximum radius a bubble attains to quantify cavitation potential because a larger bubble has a higher potential to do damage than smaller bubble does upon collapse. Note that the cavitation “potential” of a region is only an expectation of finding bubbles there because bubbles need nuclei to form. Thus, there is only a potential for cavitation and realization of this potential depends on exact circumstances. However, given the same environment, a lithotripter with a higher cavitation potential will cause more damage than one with a lower potential, and thus our cavitation potential is a good metric for the characterization of lithotripters.
The paper is organized as follows: First, the correlation between the maximum radius a bubble attains and the work done on the bubble is shown in order to provide a simple way to determine the cavitation potential of a lithotripter. Next, the procedure for calculating the work for a given LSW is outlined. Next, the mathematical formulation to determine the pressure fields of various lithotripters is presented, and its numerical implementation is given. Two lithotripters are then characterized based on the cavitation potential. Finally, conclusions are presented.
II. WORK AS A GATEWAY TO CAVITATION POTENTIAL
In this section we show that the maximum radius a bubble attains correlates well with the work done on the bubble by a LSW. Thus, calculating the work done on a bubble provides a way for determining the cavitation potential of the region.
A. Work done on bubble
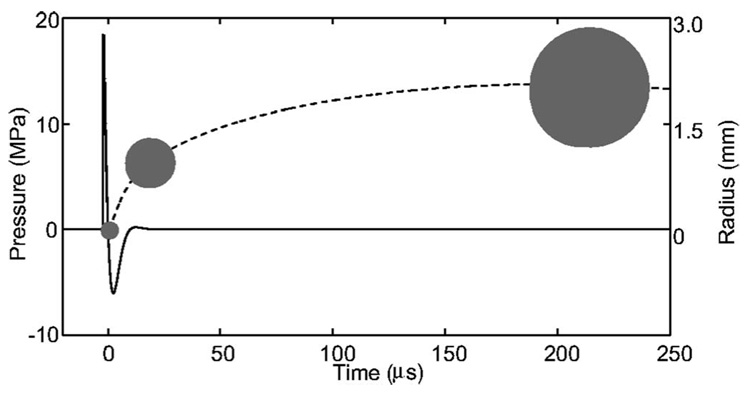
We motivate this by looking at a single spherical bubble that is forced with the rarefaction tail of a LSW (see Fig. 1). We only consider the rarefaction tail of the LSW here (and throughout the rest of the paper) because our tests showed that the short compressive part of the LSW does not affect bubble dynamics appreciably. In these tests, it was found that increasing the amplitude of the leading shock produced negligible changes in cavitation-related parameters such as the maximum radius and peak collapse temperature. The bubble dynamics were, however, strongly dependent on the nature of the rarefaction tail of the LSW. Similar results were noted by Church.20 The tests were performed using a Rayleigh-Plesset (RP) solver that incorporated gas diffusion, heat transfer, chemical reactions, surface tension, and viscous effects. The code21 was developed by Storey, and the details can be found in the corresponding reference. Hereinafter, the code will be referred to as BUBBLE.
FIG. 1.
The radial dynamics of a bubble (dashed) subjected to a typical LSW (solid) is shown.
Initially the bubble is regarded as having zero energy, i.e., KE+PE=0. The kinetic energy (KE) is zero because the bubble is still and we set the potential energy (PE) to zero for reference. After the LSW does work on the bubble, the bubble gains kinetic and potential energy, the sum of which equals the work done: W=KE+PE. The bubble then grows inertially without input from the LSW. At maximum volume, the bubble converts all of its kinetic energy into potential energy. Thus, the work done on the bubble is equal to the potential energy22 of the bubble at maximum radius:
| (2) |
Here the bubble pressure is the sum of the vapor and gas pressures within the bubble (pb=pv+pg) and the integral is taken along the path connecting the initial and maximum volumes: V0 and Vmax, respectively. Because (2) requires knowledge of the exact volume dynamics of the bubble, it cannot be integrated to give a general equation. However, we can learn something about the system by making a few approximations. First, for bubbles subjected to LSWs, pv≫pg, so pb can be replaced by pv in (2).21 Second, Vmax≫V0, so V0 can be replaced by 0. Finally, the vapor pressure is almost constant during the expansion phase of the bubble. Thus, (2) can be approximated by
where p̄v is some suitable mean value of the vapor pressure. Thus, we have motivated the notion that the work done on a bubble is closely related to the maximum radius the bubble achieves.
We now turn our attention to determining a more exact relationship between rmax and W. For this, we use BUBBLE to determine the dynamics of bubbles subjected to LSW pulses of the form
| (3) |
where Pamp, α, and f are parameters of the LSW. As defined above, the LSW starts at the rarefaction and does not include the leading shock wave. To add the leading shock wave to (3), one only needs to change the phase shift of the cosine term from π/2 to π/3. The work done on the bubble in changing its radius from r1 to r2 (from time t1 to t2) is calculated using
| (4) |
where F is the force applied on the bubble surface, A is the area of the bubble surface, r(t) is the bubble radius, and a dot represents a time derivative so ṙ(t) is the bubble wall velocity. Note that the external pressure, P(t), in (4) is given by (3) in the foregoing test. However, (4) is a general equation and is valid for any P(t).
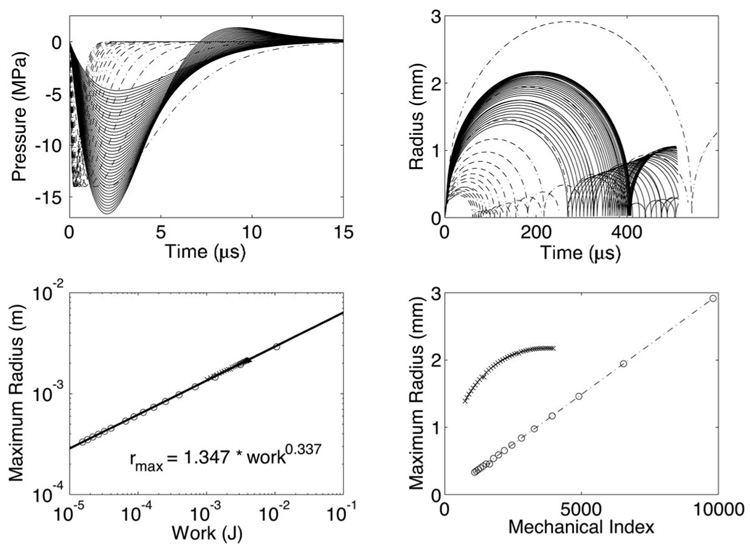
The test simulated argon bubbles in water using the following properties: initial ambient pressure p0=1.01 × 10⁵ Pa, initial gas pressure pg0=p0, water density ρl =996.6 kg/m3, argon molecular weight M=39.95 g/mol, water sound speed cl=1481 m/ s, water surface tension σl =72.8 dyn/cm, argon surface tension σg=3.418 dyn/cm, argon polytropic index κ=1.4, and water dynamic viscosity µl =1.00 cP. Note that argon bubbles were used for simplicity because the maximum radius a bubble attains when subjected to a LSW does not depend on the gas inside; water vapor dominates the interior contents so diffusion and compressible effects of the gas in the interior is of no conesquence. The test scanned a range of the parameter space {Pamp, f , α} that covered realistic pressure traces for typical lithotripters. In all the tests, the initial radius r0=4.5 µm was used because rmax does not depend on r0 for the parameters tested.20 Figure 2 shows the results of the test. A fit was done and the following relationship was found:
| (5) |
where W is in millijoules and rmax is in millimeters.
FIG. 2.
Test showing the relationship between the work done on a bubble and the maximum radius attained by the bubble (c). Various rarefaction shapes were tested (a) to yield the corresponding bubble dynamics are shown in (b). Note that maximum radius is not a function of the mechanical index (d) for the two families of rarefaction shapes shown in (a).
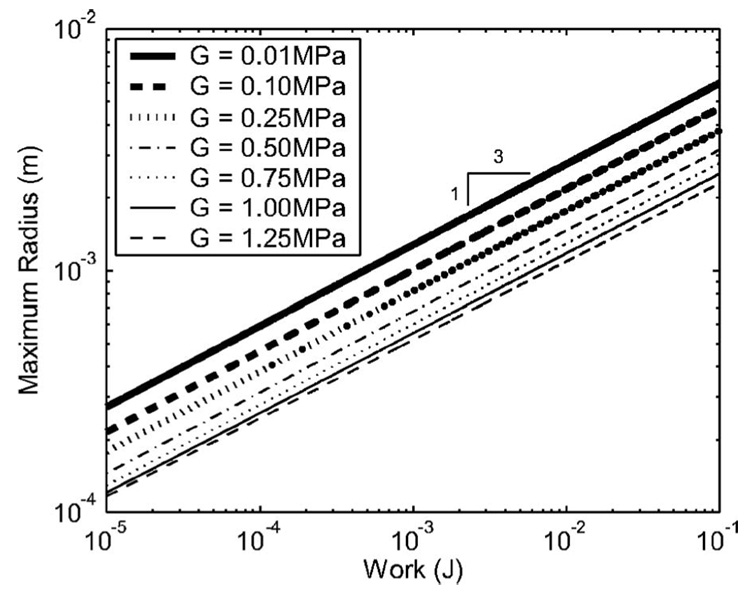
Before we move on, we show that the same work versus maximum radius analysis works for bubbles in elastic media. In this analysis, a different model for bubble dynamics is used instead of the RP equation. A good example of the governing equation for bubbles in elastic media is a modified Keller-Miksis equation23 given by Yang and Church.24 In that equation, extra terms account for the elasticity of the surrounding soft tissue through the shear modulus G. The results of the test are shown in Fig. 3.
FIG. 3.
Test showing the relationship between the work done on a bubble and the maximum radius attained by the bubble in an elastic medium.
The test was done using the parameters given by Yang and Church for air bubbles in blood and soft tissue: initial ambient pressure p0=1.01×10⁵ Pa, initial gas pressure pg0 =p0, tissue density ρt=1060 kg/m3, tissue sound speed ct =1540 m/ s, blood surface tension σb=5.6 dyn/cm, air poly-tropic index κ=1.4, tissue dynamic viscosity µ t =15 cP, and initial bubble radius r0=4.5 µm. The results show that there is a power law dependence between W and rmax (again with n=1/3) for bubbles in elastic media. However, the relation- ship departs slightly at higher shear moduli (i.e., G >1.5 MPa). This is due to the fact that bubbles undergo forced collapses, similar to those in diagnostic ultrasound, when the constraining stresses exerted by the elastic medium are large enough. A curve fit was done to determine the dependence of rmax on G, and the following was found:
where W is in millijoules, rmax is in millimeters, and G is in megapascals.
B. Applicability of our single-bubble formulation
We have thus established that the work done on a single spherical bubble by a LSW correlates well with the maxi-mum radius an isolated single bubble attains. Now we argue that our single bubble formulation is applicable to describing real bubbles and their maximum radii in SWL.
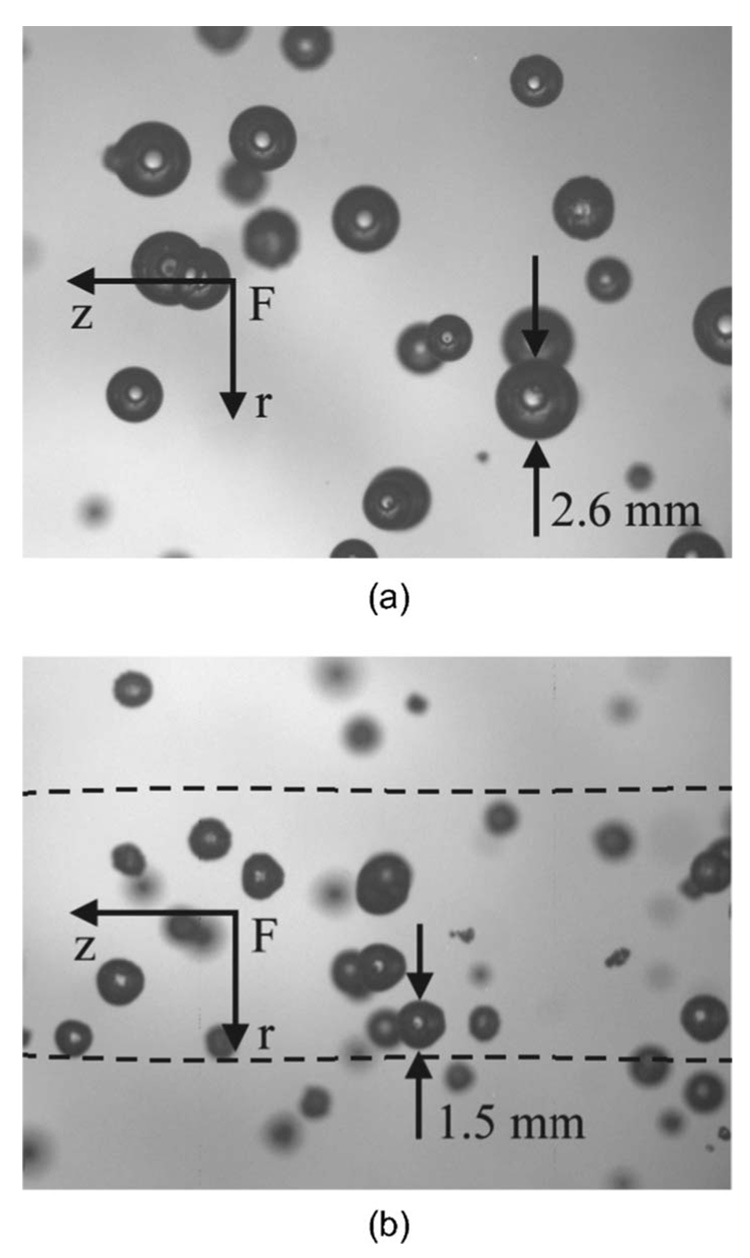
There have been numerous in vitro studies25 that show the formation of large dense bubble fields and/or bubble clusters. Here we define a dense bubble field as one in which bubbles are closely packed but remain spherical during their lifetime. We define a bubble cluster as one in which bubbles deviate from spherical due to strong bubble-bubble interaction. In both cases the dynamics of bubbles vary remarkably from that of a single isolated bubble. For example, the collapse time as measured with a passive cavitation detector for a bubble cluster can be an order of magnitude larger than that for a single bubble. Thus, an argument can then be made that a single bubble formulation is not appropriate and a dense bubble field (or bubble cluster) must be considered instead. However, our own in vitro experiments (see Fig. 16) show that the bubble fields near F2 are not always as dense as the fields photographed in other studies.9 One explanation might be that the gas content, and consequently the number of cavitation nuclei, was lower in our experiment. Another explanation may be the existence of small cavitation nuclei (undetectable by the naked eye, but readily seen with B-mode ultrasound), created by the passage of prior LSWs, in the other experiments.26,27
FIG. 16.
Bubble fields near the focus of the original (a) and upgraded (b) reflectors operating at 20 kV are shown at t=400 µs (counted from the spark) and t=350 µs, respectively. The shock wave comes from the right. Exposure time is ~1 µs. Frame width is 22 mm. The dotted line in (b) is the −6 dB contour.
The most convincing reason dense bubble fields need not be the only kind considered derives from recent in vivo experiments by Bailey et al.26 Using B-mode ultrasound, they showed that the initial cavitation field in the urine-space of a pig kidney can be described as a “sparse field” in which bubble-bubble interactions are low and bubbles collapses are spherical. They showed that the sparse field persists for approximately 150–250 shots before evolving into a “pulsating field” and finally a “static field.” Both the pulsating and static fields are characterized by bubble cluster dynamics and phenomena such as shielding occurs. However, the authors note that the urine-space field relaxes from a static to a sparse field after several minutes of no shots. Thus, we are confident that our single bubble formulation provides an accurate description of the onset of cavitation activity in vivo. Furthermore, if treatment is administered in 200-shot doses to allow for field relaxation, our formulation is perfectly valid for SWL.
Another concern is that the pressure (or rarefaction energy) measured near F2 may not be the true pressure (or rarefaction energy) of the LSW because some of the energy might have been lost due to cavitation inception as the LSW propagated toward F2.27 Thus, the work calculated with (4) using experimentally measured pressure data might be an underestimate of the work the LSW can actually do. As a consequence, the rmax field predicted by the work will be underestimated, not good if we are to use the cavitation potential as a safety index for lithotripters. However, Pishchalnikov et al.28 recently showed that the rarefaction tail of a LSW is not attenuated if a slow pulse frequency rate (PRF) is used and the bubble clouds are sparse. Moreover, stones break better as a consequence. Thus, it is becoming increaseingly clear that SWL should be performed at a slow PRF. Under such conditions, we are confident that our single-bubble formulation is valid.
Although we have argued that the work is expected to correlate well with rmax for an isolated bubble during cavitation onset and especially at slower PRF, one may still like to consider the case of a bubble in a denser field. This is because the presence of other growing bubbles creates a back-ground pressure field that is higher than that of the free-field. This higher pressure restricts the growth of bubbles, and the rmax field predicted by the work on an isolated bubble is likely a slight overestimation of the maximum radii of bubbles a denser field. However, such an upper bound is exactly what we need if we are to use the cavitation potential for safety reasons.
That having been said, we still expect the calculation of the work input to be valid. After all, the interaction between a bubble nucleus and the rarefaction occurs when the bubble is very small—without much influence from neighbors. Hence, the work input from the rarefaction is properly formulated. What would change in a denser field would be the link between the work input and rmax. This is a useful area for future work.
We conclude this section by giving another view of our analysis. We have shown that the maximum size of a bubble correlates well with the work done on the bubble by the LSW. Furthermore, the work done on the bubble is equal to the energy lost to the bubble. Thus, you can think of our analysis as measuring the energy of the LSW lost to bubble growth, and looking at such a field provides a valid way of estimating the potential for damage.
III. BUBBLE DYNAMICS
Now we turn our attention to the procedure for determining the work done on a bubble by a LSW. From (4), we see that the radial dynamics of a bubble is needed to get an expression for the work. If we assume that the bubble is in an incompressible (or only mildly compressible) fluid, we can use the RP equation to find the bubble radius.
A. Simplified Rayleigh-Plesset equation
Hilgenfeldt et al.29 define a useful form of the RP equation as
| (6) |
where ρl is the liquid density, pg is the internal gas pressure, Pf(t) is the acoustic forcing, p0 is the ambient pressure, cl is the liquid sound speed, µl is the liquid viscosity, and σis the surface tension. Equation (6) can be solved numerically for any Pf(t).
However, we wish to find a simpler model for r(t). This can be done by following the analysis of Hilgenfeldt et al.29 In their paper, the authors defined distinct phases for the RP equation in response to a spatially homogeneous, standing wave, and derived analytic expressions for the bubble dynamics and subsequent analytical laws for parameter dependencies. The phases were: Rayleigh collapse, turnaround and delayed re-expansion, afterbounces (a parametric resonance), and expansion. In our work we are interested in the RP approximation for the bubble expansion phase.
In the expansion phase of the bubble dynamics, the dynamical pressures roughly balance the external pressure P(t)=Pf(t)+p0. Thus, we only need to solve the simplified RP equation
| (7) |
to calculate the bubble dynamics during the time span of the LSW.
The validity of (7) was tested against (6) using BUBBLE. We tested five different driving pressures: three LSWs of the form given by (3) and the pressures at F2 for the original and upgraded reflectors we consider in Sec. V. The three LSWs were a theoretical shock wave as defined by Matula et al.21 (Pamp=33 MPa, α=0.35 MHz, f =50 kHz), a strong short-lived shock wave (Pamp=80.16 MPa, α=1.6 MHz, f =200 kHz), and a weak long-lived shock wave (Pamp =17 831.7 MPa, α=0.35 MHz, f =5 kHz).
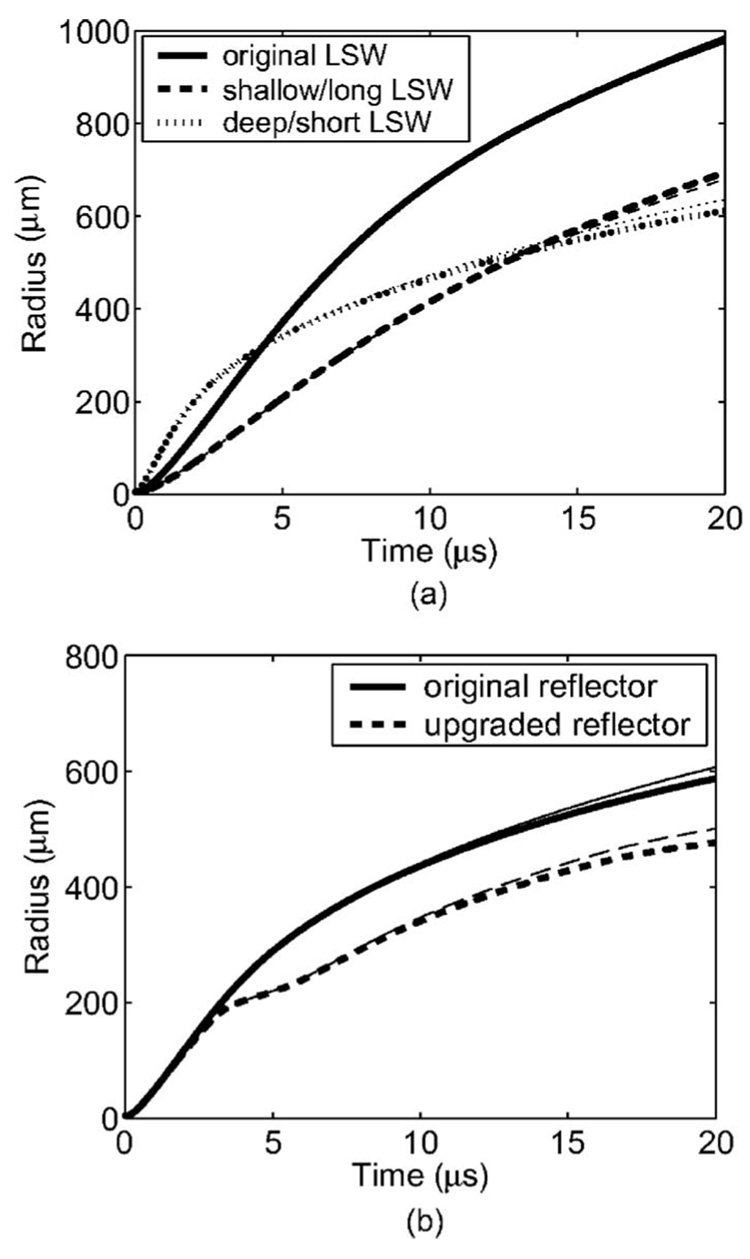
Figure 4 shows the results. As can be seen, (7) is an excellent approximation to (6), at least for the initial period of the bubble dynamics (i.e., while the work is being done from 0 µs≤t≤15 µs). After that period, the approximation breaks down because the other terms in (6) become comparable in magnitude to the dynamical pressures. However, (4) only needs the bubble dynamics from the initial period because the driving pressures of interest only last that long. Thus, the simplified RP works extremely well and saves computing costs in finding the work done on a bubble.
FIG. 4.
The bubble radius calculated using the full (heavy) and simplified (light) RP equations are compared. In (a) the driving pressures were of the form given by (3), and in (b) the pressures were the pressures at F2 for the reflector shapes considered in Sec. V. Note that there are six curves in (a) and four in (b).
B. Analytic expression for the work: New index
Before we continue with the results, we now develop an analytical expression for the work done on a bubble by an external pressure field P(t). To do so, we first simplify (7) further to
| (8) |
where j=3/4 if velocity is dominant (early stages of bubble growth) and j=1/2 if acceleration is dominant (near maxi-mum radius). In our analysis, we put j=3/4 in (8) and integrate twice to get
| (9) |
Here, the initial conditions used were r(t=0)=r0 and ṙ(t=0)=0. The velocity is found by differentiating (9)
| (10) |
Substitution of (9) and (10) into (4) gives the work:
| (11) |
Thus, the work can be considered a functional: W = W[P(t) , ρ,r0]. However, we can eliminate the dependence on r0 if
| (12) |
Furthermore, if the external pressure is parametrized by only an amplitude Pamp and frequency f, the work scales like
| (13) |
The constant of proportionality in (13) may be determined—at least approximately—for wave fields of certain forms. For example, the work done on a bubble driven by a LSW of the form of (3) for 0≤t≤1/(2f) and 0 for t >1/(2f) is approximated by
where x ≡ α/ f. This work index is not directly practical for use to characterize shock wave lithotripters. Instead, it gives one an idea of how the work input varies with different parameters.
IV. PRESSURE FIELD
To compare lithotripter designs via our cavitation potential, we need a way to determine the pressure fields of the reflectors. In the past, this has been accomplished numerically by several authors. Christopher30 used an acoustic beam model to determine the propagation of a LSW from a Dornier HM-3 for water and tissue. However, his scheme used an arbitrary tensile strength limit to produce “reasonable looking” waveforms. Averkiou and Cleveland31 modeled an EH lithotripter using geometrical acoustics and the Khokhlov-Zabolotskaya-Kuznetsov (KZK) equation. Their results showed good comparison with experimental measurements, but the accuracy was limited due to the parabolic approximation of the diffraction. Tanguay32 developed a model of shock wave propagation in a bubbly liquid mixture using an ensemble-averaged, two-phase flow scheme. His results also compared well with experiments, but he used a wall boundary condition for the reflector. Zhou and Zhong33 developed an equivalent reflector model coupled with the KZK equation to solve for the pressure field of their original and upgraded reflectors (see Sec. V B and Sec. V C, respectively).
In this section, we develop a new model of SWL that can be used to determine the pressure fields of different reflector designs. It is similar to the model developed by Tanguay,32 but treats the reflection problem differently. We chose to develop our own code for convenience and flexibility, and to allow for comparisons of different designs using the same code. The model described below is very simple (yet powerful) and easily implemented by many numerical solvers to provide qualitatively accurate pressure fields that can be tested by determining the cavitation potential of the field.
A. Model formulation
In our simplified model, we consider the shock propagation process to be isentropic and the flow field to be homogeneous. The domain is taken to be axisymmetric to reduce the number of space dimensions to two. With these approximations, the flow field is governed by the axisymmetric Euler equations
| (14) |
where the variables vector q, flux vectors F(q) and G(q), and the geometric source vector S(q) are defined as
| (15) |
Here, ρ(r,z,t) is the fluid density, u(r,z,t) is the axial velocity, v(r,z,t) is the radial velocity, and p(r,z,t) is the pressure.
The fourth component of (14) is the balance of mechanical energy per unit volume (hereinafter it will be simply referred to as the energy equation). It is found by taking the scalar product between the velocity vector and the balance of linear momentum. However, this energy balance lends no new information (i.e., the system is still open). It only introduces the total mechanical energy per unit mass (e), defined as the sum of the kinetic energy per unit mass and the “strain” energy per unit mass:
The system of equations (14) is closed by specifying the Tait equation of state (EOS). The Tait EOS is the isentropic (p, ρ)-relationship for water, and if rearranged as
| (16) |
it has the same form as the equation of state for an ideal gas; i.e., p/ργ=const. Here, γ≡cp/cv is the specific heat ratio, and cp and cv are the specific heats at constant pressure and volume, respectively. Thus, if p in (15) is replaced by pTait, our governing equations look formally like those of an ideal gas, because (14) is invariant to pressure translations. Note that although the energy equation is not invariant to pressure translations by itself, it is a direct consequence of the momentum equation, so invariance is already assumed in its derivation. In (16), B and n are experimentally determined constants and ρ0 is the density at atmospheric pressure. The Tait EOS is valid for pressures up to 105 atm with B = 3000 atm and n= 7.34 With p=pTait, ε=p/ [ρ(n−1)].
It is critical to note that the isentropic assumption breaks down when shocks are present due to irreversible processes within the shock. However, the normalized entropy jump for a weak shock is proportional to the cube of the normalized pressure jump, [p] / (ρc2), where c is the sound speed. For water, ρc2=2200 MPa and in SWL, [p]<100 MPa. Thus, the isentropic assumption is a good approximation.
B. Numerical implementation
The system of equations in (14) along with (16) is solved numerically using clawpack (Conservation LAWs PACKage).35 Clawpack is a collection of fortran subroutines that solves time-dependent hyperbolic systems based on the method of characteristics. The package is capable of solving nonlinear, nonconservative systems with source terms. The source code solves the Reimann problem between adjacent nodes in a finite volume mesh using a first-order Godunov scheme with second-order corrections. This determines the waves that propagate through the domain. Limiter functions are used to modify the second-order corrections to these waves. The code is stable for Courant-Friedrichs-Lewy numbers CFL≡max{cΔt /Δx}<1, where c is the wave speed, Δt is the time step, Δx is the grid size, and the max is taken over all coordinate directions.
In this work we use the message-passing interface (MPI) version of the two-dimensional (2D) Euler package with a source term for the cylindrical geometry. It solves the conservation of mass, momentum, and mechanical energy for an ideal gas using the MPI parallelization scheme. The source terms are handled with a Godunov (fractional-step) splitting technique in which the homogeneous problem is solved first and the inhomogeneous next. A “monotonized centered” limiter is used to resolve the shock waves. This scheme has been shown to be able to resolve the interaction of four shock waves and a shock wave hitting a bubble exceptionally well.35
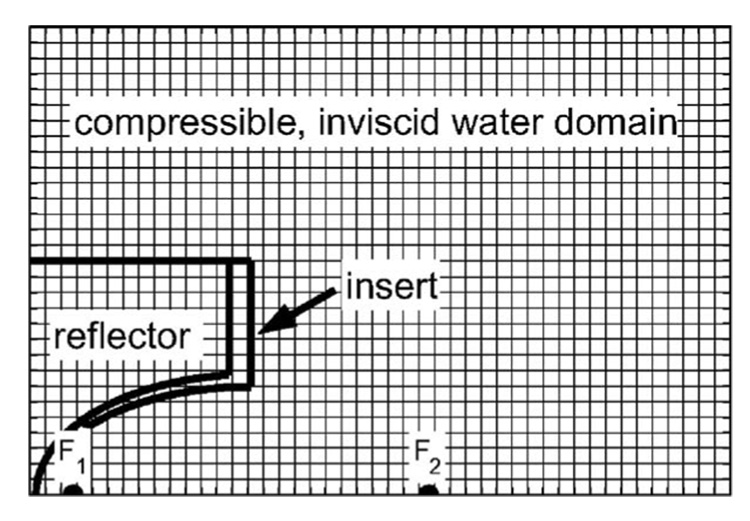
The computational domain in our work is a rectangular grid in the axisymmetric domain; for an example, see Fig. 5. The left, top, and right boundaries are ordinary outflow boundaries, while the bottom boundary is a reflective boundary because it serves as the axis of symmetry for the cylindrical domain. To ensure that the boundaries of the computation domain do not affect the numerical solution, the computational domain is taken to be large enough such that it contains the LSW at all times.
FIG. 5.
A schematic of the computational domain used by clawpack. The computational grid is not drawn to scale.
C. Initiation of the direct wave
The direct wave is generated by a source-like boundary condition at F1. The source is established by specifying the total mechanical energy per unit volume (ρe) of a ball of grid points surrounding F1. The idea arose by recognizing that our mechanical energy equation is equivalent to a thermodynamic energy equation for an ideal gas. To see this we define the total thermodynamic energy per unit mass (eth) as the sum of the internal energy per unit mass (eint) and kinetic energy per unit mass. For an isentropic process, eint is governed by deint=−p dv, and for an ideal gas this yields eint = p/[ρ(n−1)]. Therefore, eth is equivalent to e, and specifying the mechanical energy is equivalent to specifying the thermodynamic energy. Thus, our source creates the direct wave by introducing the heat energy produced by the spark discharge at F1.
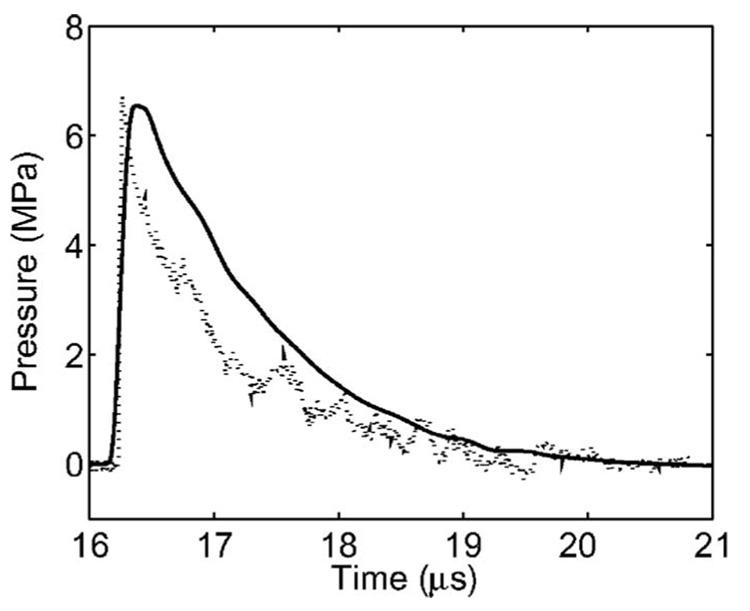
By using different source functions, we are able to create LSWs of varying magnitudes and thicknesses in order to match experimental results for different spark discharges. Such estimation is necessary because modeling the spark discharge directly is outside the scope of this work. Furthermore, waves generated from different spark discharges can vary dramatically from shot to shot. A typical initial pulse, similar to the triangular waves used in previous SWL studies,30–32 is shown in Fig. 6 along with the experimental measurements made with a fiber optic hydrophone. The experimental procedure is described in Sec. V C.
FIG. 6.
The direct wave generated by our source (solid line) is compared with experimental measurements (dotted) from a spark source.
D. Reflector
Unlike other SWL simulations32 in which a reflector is modeled as a rigid boundary aligned with a computational grid, in this work the reflector and any “insert” is approximated as an interface between two different regions within the computational domain (see Fig. 5). The interface is defined by a surface such that grid cells lying within the surface are in the reflector domain while cells outside are in the fluid domain. Grid cells cut by the surface are given properties of both domains, weighted by the volume of each domain contained by the grid cell. We note that a quadrilateral grid can be used instead of a rectangular mesh to place the reflector along a grid line. However, this approach is not taken because a rectangular mesh is accurate enough to show how the cavitation potential can be used to characterize lithotripters.
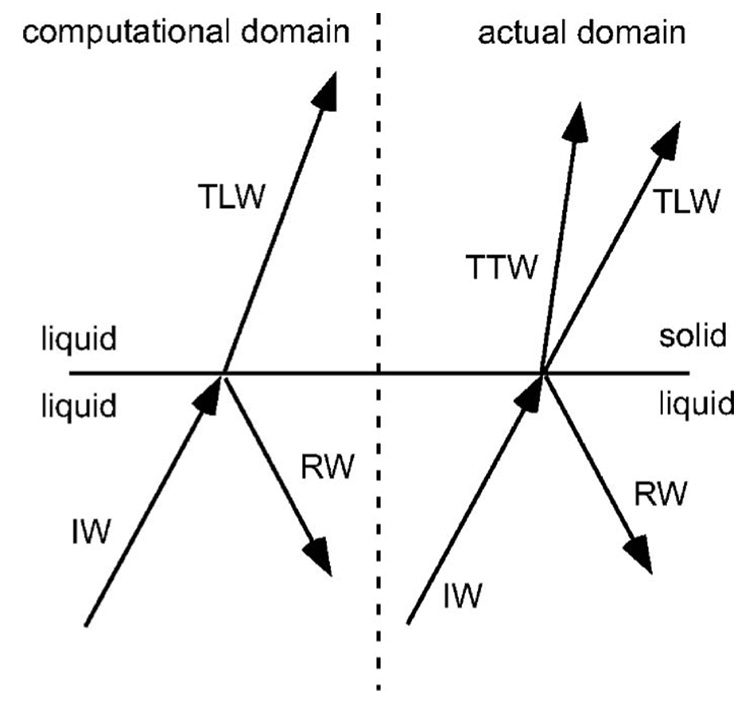
To simplify the problem, we model the solid reflector domain as a liquid with the same EOS (but different properties) as the fluid domain (see Fig. 7). By doing so, the entire computational domain is governed by the same set of equations and eliminates the need of coupling regions together where different equations (e.g., the Euler equations coupled with the nonlinear elastodynamics equations) are solved. The reflection problem is then treated by setting the properties of the reflector domain such that the reflection coefficient between the liquid-liquid computational interface matches analytical results for the reflection coefficient of an actual reflector (liquid-solid interface).
FIG. 7.
A schematic of the computational and actual reflector interface, and the waves set up upon reflection. In the computational domain, the incident wave (IW) gives rise to a reflected wave (RW) and transmitted longitudinal wave (TLW). In the actual domain, the IW gives rise to a RW, TLW, and transmitted transverse wave (TTW).
We argue that it is not necessary to solve physically accurate equations of motion within the reflector because only the reflected wave is of interest; the waves in the reflector do not directly affect the solution in the liquid. Of course, if the waves in the reflector are subsequently re-reflected from a back side and retransmitted into the liquid domain, there is an effect on the solution. However, this is accompanied by a time delay of sufficient length so as to render the alteration of the pressure field unimportant for the present purposes.
In the analysis that follows, we first consider the liquid-solid reflection problem to determine the reflection coefficient of the lithotripter reflector, on the liquid side. We then consider the liquid-liquid reflection within the computational domain to determine the properties of the reflector domain to achieve this same reflection coefficient. In both sections, only the main results are shown; interested readers should consult Refs. 37 and 38 for details.
The reflection coefficient for a plane wave incident from a liquid hitting a liquid-solid interface is given in Chap. 1.4 of Brekhovskikh37 and is outlined here for convenience. In general, the velocity at any point in a solid can be expressed through a scalar and a vector potential. In planar problems, this is reduced to two scalar potentials, ϕ and ψ, for the longitudinal and transverse waves, respectively. These potentials satisfy separate wave equations with different wave speeds given in terms of the density of the material and the Lamé constants λ and µ. For liquids, we take ψ and µ to be zero because liquids can only support longitudinal waves. The interface conditions are that the normal stress and displacement must be continuous and the tangential stress must vanish because liquids cannot support shear. To solve the system of equations, harmonic wave solutions are assumed for the potentials, and the amplitudes and wave numbers are determined.
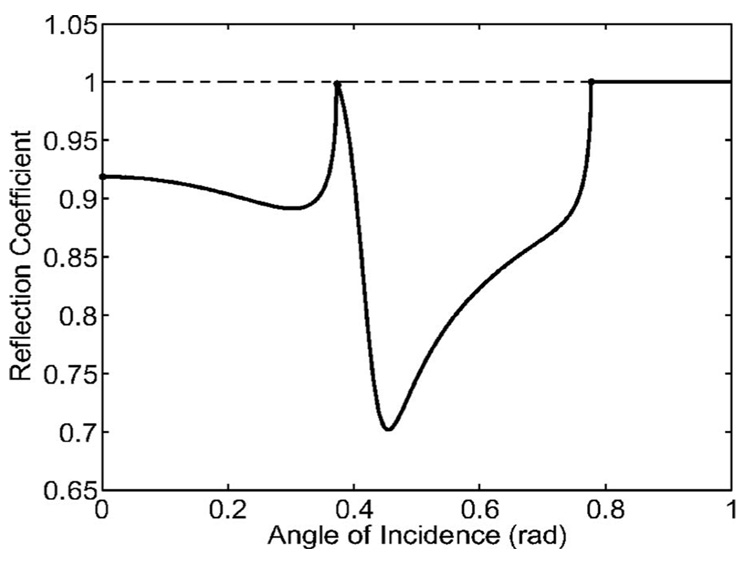
Figure 8 shows the reflection coefficient for a brass-water interface.We see that unlike the case for a liquid-liquid interface in which the modulus is a monotonically decreasing function of θi [see (17) below], the modulus for a liquid-solid interface has interesting features due to the wave dynamics in the solid. For θ i <0.37 both longitudinal and transverse waves are excited in the solid, and for 0.37< θi <0.78 only the transverse wave is excited while the longitudinal wave “glides” along the surface. For θi >0.78 perfect internal reflection occurs. Note that our scheme does not determine the dynamics of these waves, but captures their effects through changes in the reflection coefficient.
FIG. 8.
The reflection coefficient for a water-brass interface is shown (solid). The dotted line marks R=1 for reference.
Now that we have the reflection coefficient for the actual solid/liquid interface, we move to the analysis of the reflection/transmission for a wave at oblique incidence hitting a liquid/liquid interface in the computational domain. This is given in Chap. 5.B.1 of Blackstock,38 so we just cite the result. The reflection coefficient (Eq. B-9a of Blackstock38) is given by
| (17) |
where p− and p+ are the strengths of the incident and reflected waves, respectively, Zj= ρjcj is the impedance of the jth medium, θi is the angle of incidence, and θ t is the angle of transmission. The sound speed and the angles of incidence and transmission are related by Snell’s law (c1 sin θt =c2 sin θi). Here, and throughout the rest of the paper, “1” refers to the working medium and “2” to the reflector.
From (17) we see that the reflection coefficient is only a function of the pressure ratio p2/p1, the density ratio ρ2/ρ1, and the angle of incidence θi. Thus, we are free to vary any or all of these parameters to change the reflection coefficient in our computational domain. In our scheme, we choose to vary only the density ratio because a pressure jump induces motion and the angle of incidence is fixed by the geometry of the lithotripter. Thus, the reflector is simply modeled as a density jump across a prescribed boundary. The density ratio ρ2/ρ1 is calculated using (17) for a given interface and geometry. We note that this scheme is similar to the impedance mismatch method36 developed to study acoustic scattering.
The initial density of the reflector is set as follows: The reflection coefficient for the materials of interest is calculated as in Fig. 8. The density ratio in (17) that gives the same reflection coefficient pointwise is assigned to the interface (reflector). The interior grid points are given the same density ratio as the grid point along the surface with the same axial position. If the density ratio is almost infinite (i.e., R ≈ 1), a cutoff reflection coefficient is applied such that the code is stable with regard to the density ratio changing as a function of time due to numerical dissipation.
Note that we only set the initial density of the reflector and allow it to evolve according to the equations of motion. Thus, the density jump, and consequently the reflection coefficient, of the reflector changes with time. However, we now show that the change is negligible. From Fig. 6, the LSW has a peak pressure of about 7 MPa at 1 cm away from F1. Therefore, the peak pressure of the LSW at the reflector is at most 7 MPa. This is a change of 0.2% in the pressure. By (16), the density changes 0.029%. We now determine how these changes affect the accuracy of our reflection coefficient. This is done by defining a modified reflection coefficient R̄and comparing it to the original reflection coefficient. To maximize the error, we define R̄ by setting p1 =0.998p1, p2=1.002p2, ρ1=0.999 71 ρ1, and ρ2=1.000 29 ρ2 in (17). Comparing the reflection coefficients, we find that (R̄−R)/R ≤ 0.08% for the range of reflection coefficients in Fig. 8.
V. PRESSURE FIELD RESULTS
In this section, we show the results of the pressure fields calculated with our model. We first present tests to validate our reflector-density scheme. We then compare the pressure fields obtained with our model with previous numerical and experimental results for two lithotripter designs to validate our model. The designs we consider are an ellipsoidal reflector and ellipsoidal reflector with an insert.
A. Code validation
The principal validation for the numerical scheme is the following. Beginning with a numerical waveform that closely approximates experimental measurements near F1, the scheme is able to propagate forward the solution to yield a numerical waveform that closely approximates experimental measurements near F2. However, we first examine the reflection technique in some detail.
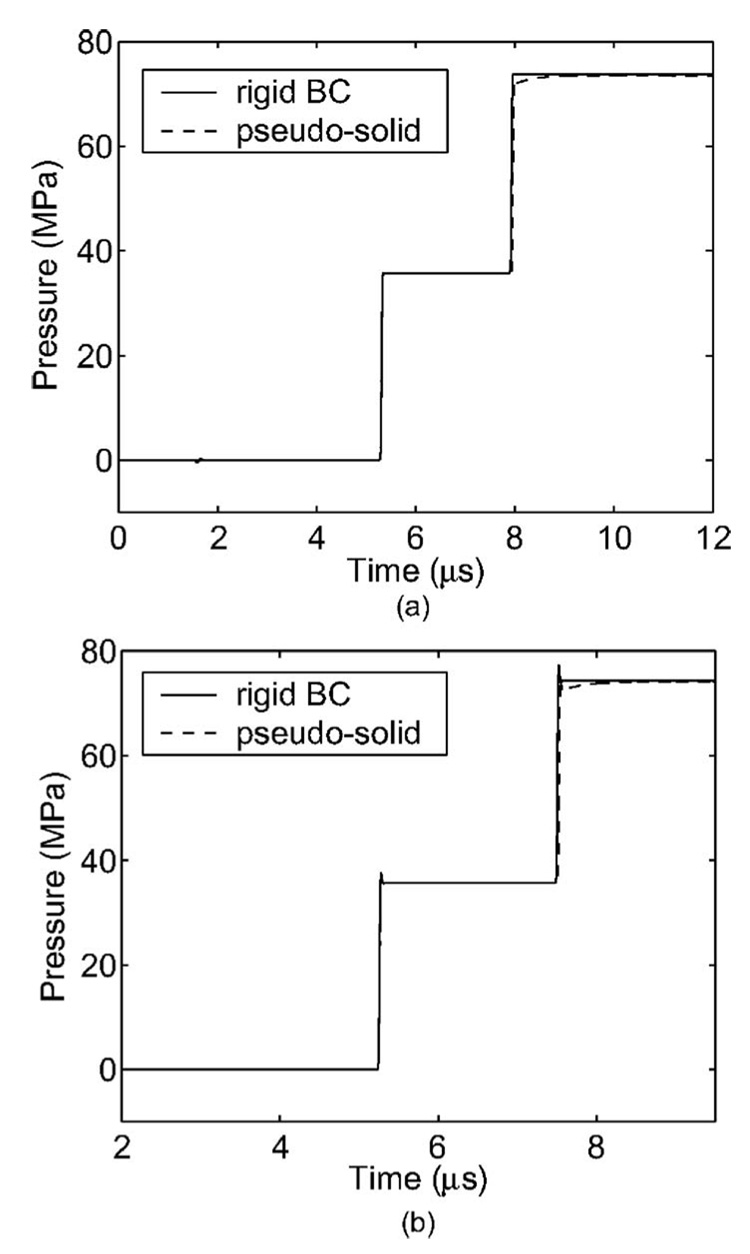
To assess the accuracy of our reflector scheme, we first present tests of shock reflection from a planar interface at different angles of incidence. However, instead of the using the axisymmetric Euler equations, we use the 2D Euler equations. This was done because planar shock waves (as opposed to conic shock waves) eliminate the symmetry axis and the reflections caused by it for a cleaner test. The 2D Euler equations have the same form as (14), but with S(q) =0. In these tests, we compared the reflection from our “pseudo-solid” domain with the standard rigid-boundary boundary condition from clawpack.
The tests were initiated by placing a 20 MPa shock in front of a wall or reflection boundary. The flow conditions ahead of and behind the shock were determined from the Rankine-Hugoniot relations. The density of the pseudo-solid domain was calculated using (17) with R=0.993.40 The computational grid had a mesh size dx=20 µm and a time step dt=10 ns was used. The results of the test are shown in Fig. 9.
FIG. 9.
A comparison of the reflection of a shock using a rigid-boundary boundary condition and our pseudo-solid is shown for two angles of incidence: (a) 0° and (b) 30°. The shock was initially 10 and 8.8 mm in front of the wall for cases (a) and (b), respectively, and the pressures were taken 2 mm in front of the wall.
We regard this as a favorable test of the validity of the approach for the following reason. The pseudo-solid interface conditions were developed based on linear theory, but the test is carried out using nonlinear partial differential equations and including shocks. However, as we mentioned, the most important validation is the correct propagation from F1 to F2, which we describe below.
B. Original reflector
Next we simulated an ellipsoidal reflector with dimensions similar to that of a clinical Dornier HM-3; for the setup geometry, see Fig. 5 of the present work or Fig. 1 from Zhou and Zhong.15 The figures show the ellipsoidal reflector with an axisymmetric insert placed within the bowl. Throughout the rest of the paper, we will refer to the ellipsoidal reflector without an insert as the “original reflector” and the reflector with an insert as the “upgraded reflector.” In this subsection we consider the original reflector. In addition, the nomenclature for reflector parameters will follow the nomenclature used by Zhou and Zhong.15
The original reflector we simulated had a semimajor axis a=13.8 cm, semiminor axis b=7.75 cm, and exit plane distance d=12.4 cm. Here, the exit plane distance is defined as the distance (along the semimajor axis) from the bottom of the reflector to the point where the reflector is truncated (the ellipse is not a complete hemi-ellipsoid). The working fluid (here and in all the other tests) was water and had an initial density of ρ1=1000 kg/m3. The brass reflector had an initial density calculated from the reflection coefficient given in Fig. 8. The analysis used the following parameters: density of brass ρ2=8600 kg/m3, longitudinal wave speed in brass c2=4073 m/s, transverse wave speed in brass b2 =2114 m/ s, and sound speed in water c1=1482 m/ s. As in Sec. V A, R≤0.993 was used for stability. The source function that produced the direct wave in Fig. 6 was used to initiate the simulation.
The computational grid had a mesh size dx=39 µm and time step dt=10 ns was used. This corresponded to a maximum Courant number CFLmax=0.4066 at t=196 µs. The simulation, as well as the one for the upgraded reflector, were run on DataStar, the largest IBM terascale machine at the San Diego Supercomputer Center (SDSC).41
To show that our scheme captures the correct propagation, we now turn to the pressure field of the original reflector and compare it with numerical and experimental mea-surements. We first start with a comparison with numerical results. In Fig. 10 we compare the pressure at various points along the symmetry axis as calculated with the present model and the KZK equation.31 As readily seen, the rarefaction tail calculated by our model and that calculated by the KZK equation have approximately the same duration and peak pressure. This agreement is exactly what we need in order to make objective conclusions based on the results of the calculated rmax fields. However, the compression wave does not focus as sharply as when modeled with the KZK equation. This can be attributed to the coarseness of the computational domain. In order to resolve such fine structures, the grid would have had to be made finer. However, that would have increased the computational time by a factor of 3, an increase not warranted by our goals.
FIG. 10.
The pressure at various locations along the symmetry axis for an ellipsoidal reflector as calculated with the present study (solid) and the KZK equation (Ref. 30) (dashed).
We note that perfect geometric focusing is not realized due to nonlinear wave interactions and edge wave effects. The edge wave is a diffraction wave that emanates from the edge of the lithotripter aperture. As time (or Δz2 in Fig. 10) increases the edge wave catches up to the LSW and affects the LSW through the steepening and expansion of the lead-ing shock wave and the rarefaction tail, respectively.
We now turn to a comparison with experimental data obtained by Cleveland et al.39 We first show how well the present model simulates the propagation from F1 to F2 by comparing focal waveform parameters that are commonly used and defined in literature. For completeness, the definitions are outlined here: P±≡peak positive/negative pressure; tr≡rise time of the shock front, measured from 10% to 90% of the peak positive pressure; t±≡positive/negative pulse duration, measured by the zero crossing duration of the first positive/negative cycle of the shock wave. Note that the source wave and lithotripter geometries in Cleveland et al.39 are not known in detail. In the following comparison, typical experimental results (Anat-IU in Ref. 39) are listed in paren-theses. The peak pressures were P+=27.54 MPa (31.7 MPa) and P−=−7.39 MPa (−10.9 MPa), the rise time was tr =107 ns (22 ns), and the pulse durations were t+=0.85 µs (0.85 µs) and t−=5.99 µs (4 µs).
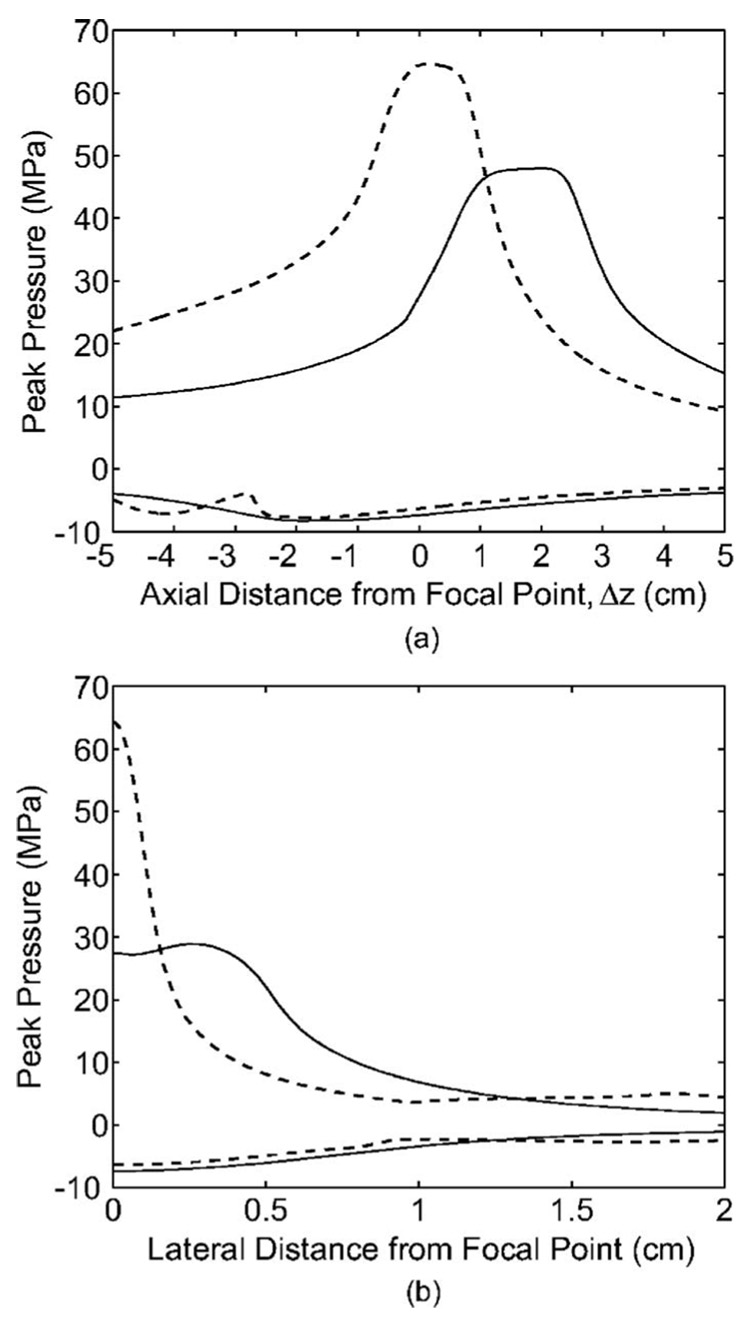
We now compare our pressure field results. Again we place the typical comparison results (GALCIT in Ref. 39) in parentheses. From Fig. 11, the peak pressures on the symmetry axis were P+=47.99 MPa (45 MPa) at Δz2=20.05 mm (10 mm) and P−=−8.25 MPa (−9 MPa) at Δz2 =−18.99 mm (−20 mm). The −6 dB (peak positive) region, found by plotting the entire peak pressure field (see Fig. 13), was approximately 37.9 mm (60 mm) long in the axial direction along the symmetry axis and 9.6 mm (10 mm) wide in the transverse direction at F2. The maximum dimensions for the −6 dB (peak positive) region were 43.7 mm in length and 10.2 mm in width. Here the agreement is good with the biggest discrepancy in the length of the −6 dB (peak positive) region.
FIG. 11.
Distribution of the peak pressures along the symmetry axis (a) and transverse axis at F2 (b) generated by the original reflector (solid) and upgraded reflector (dashed). The curves with positive/negative pressure values correspond to the peak positive/negative pressure for each reflector design.
FIG. 13.
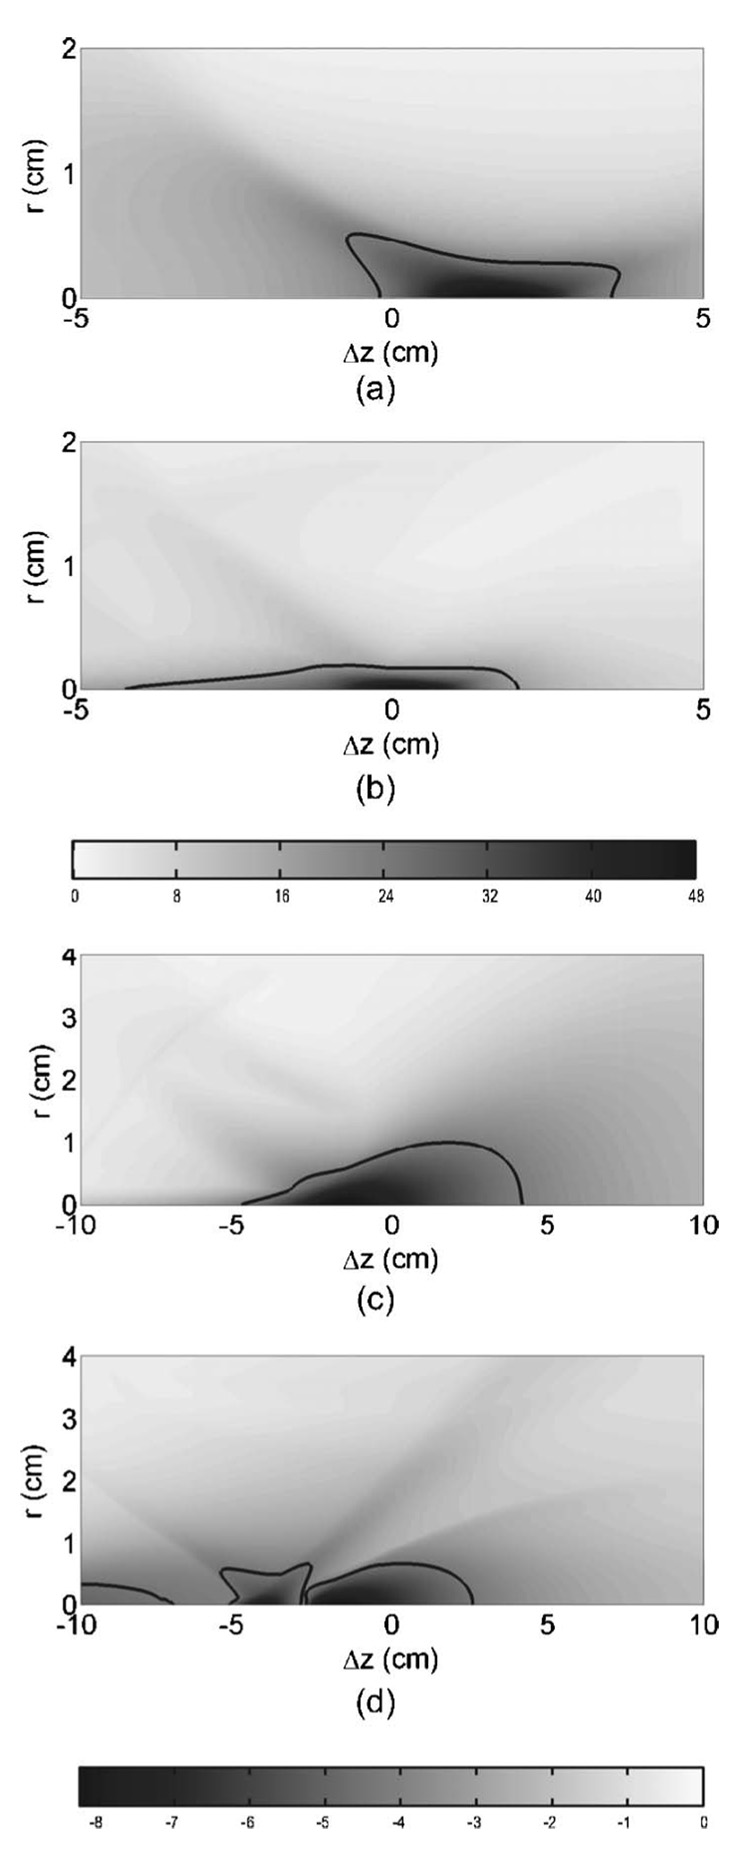
A comparison of the peak pressures (MPa) is shown in grayscale. The contours of the −6 dB regions P{with respect to the peak positive [(a) and (b)] and negative [(c) and (d)]} are outlined for the original [(a) and (c)] and upgraded reflectors [(b) and (d)]. The −6 dB contours for the upgraded reflector corresponds to the −6 dB pressures for the original reflector. The r-scale is exaggerated and the z-range is different between the positive and negative plots for better visualization of differences.
C. Upgraded reflector
Next we simulated an upgraded reflector modeled after the upgraded Dornier HM-3 developed by Zhou and Zhong.15 This geometry generates two LSWs, the leading LSW from the insert and the secondary LSW from the uncovered reflector bottom. The insert had a semimajor axis a′=13.25 cm, semiminor axis b′=7.13 cm, and exit plane distance of d′=11.3 cm. The insert shared the same first focus as the original reflector, but its second focus was 5 mm proximal to that of the original reflector. The reflector had an initial density of ρ2=5580 ρ1. In this test, the reflector density was taken to be constant because the exact reflection coefficient for the insert was not known at the time.
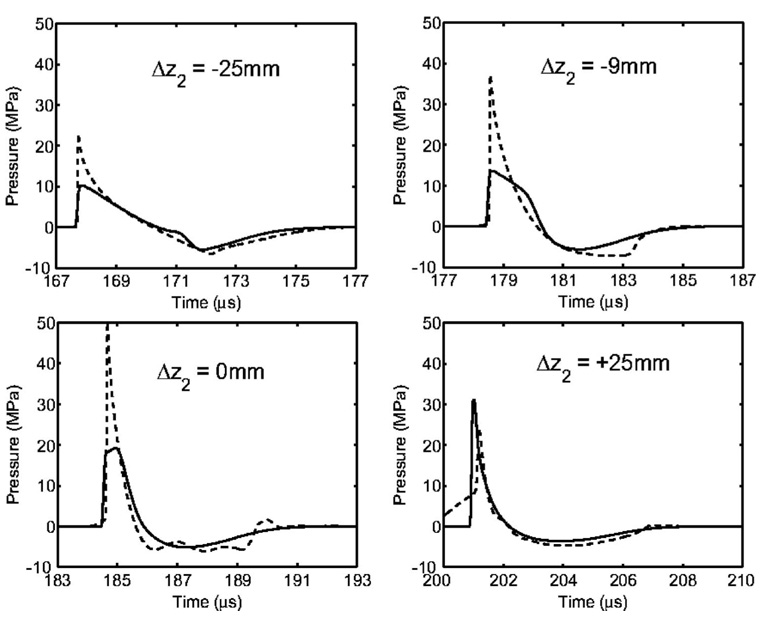
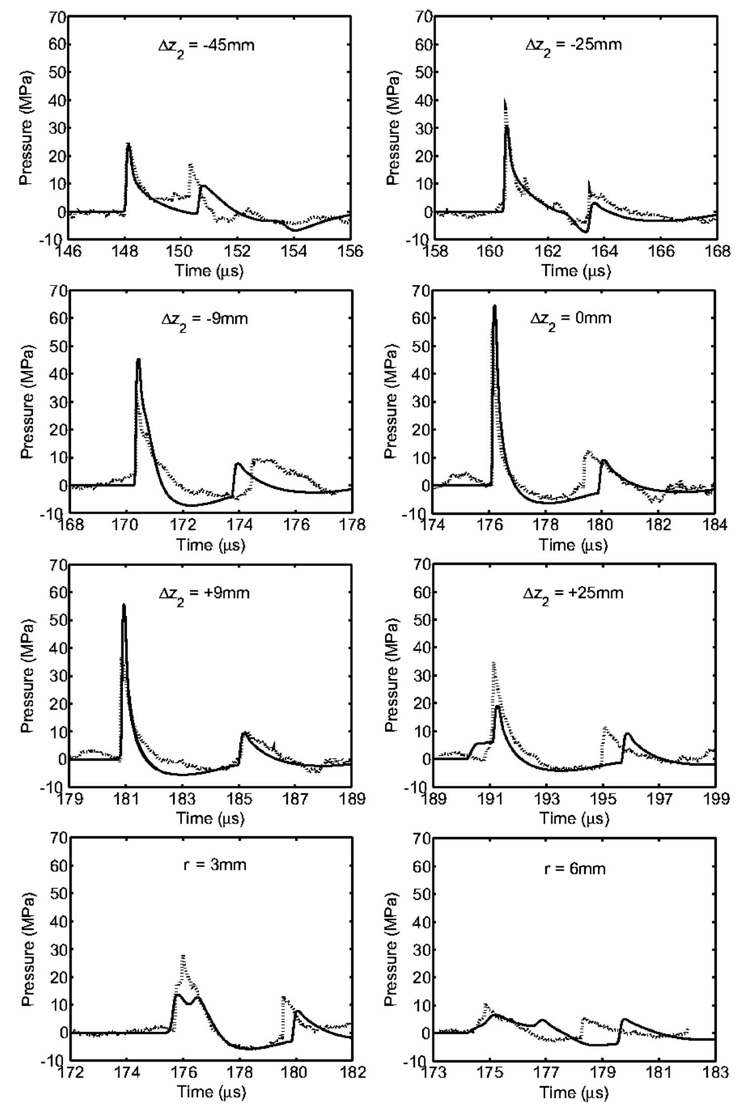
In Fig. 12 we compare the simulation results with experimental measurements. The pressure waveforms were measured using a fiber optic probe hydrophone (FOPH-500, RP Acoustics, Leutenbach, Germany). The probe of the hydrophone, the tip of a 100 µm optical fiber, was placed in-side a holder and attached to a three-dimensional position system (Velmex, Bloomfield, NY) with a minimum step size of 5 µm and a maximum scanning range of 250 mm. The hydrophone was tilted at 14° so that the probe could be aligned parallel to the lithotripter axis. A mechanical pointer was used to aid the alignment of the probe tip with F2. A LabView program was used to control the scan of the probe in the lithotripter field with a step size of 1 mm or larger. At each location, at least six pressure waveforms were recorded using a digital oscilloscope (LeCroy 9314 M, Chestnut Ridge, NY) operated at 100 MHz sampling rate and the data were subsequently transferred to a PC for offline analysis.
FIG. 12.
Comparison of numerical results (solid line) with experimental data (dashed line) at representative points in the vicinity of F2 for the upgraded reflector.
The comparison was made by shifting the numerical results in time such that the start of the leading LSW was the same for both simulation and experiment. A translation in time was needed for several reasons: (1) The experimental start time was when the spark was ignited while the simulation start time was when the direct wave was already a distance r0 from F1 due to the size of the source (r0 /c0 =4 mm/1459 ms−1=2.74 µs); (2) bubbles from previous shots were not fully dissolved before the arrival of the LSW and affected the propagation of the LSW; and (3) the individual plots in Fig. 12 are for different runs and the variability of the spark discharge affected the shape of the direct wave, and consequently, the waveforms near F2.
A quantitative comparison of our results with those mea-sured by Zhou and Zhong33 is made with experimental results in parentheses as before. The focal waveform (Δz2 =0 mm in Fig. 12) was in good agreement. The peak pres-sures were P+=64.04 MPa (56.19 MPa) and P− =−6.32 MPa (−5.15 MPa), the rise time was tr=58 ns (16 ns), and the pulse durations were t+=0.89 µs (0.97 µs) and t−=2.99 µs (2.16 µs).
We now compare our pressure field results as done for the original reflector. From Fig. 5 the peak pressures on the symmetry axis were P+=64.67 MPa (51.9 MPa) at Δz2 =2.05 mm (0.0 mm) and P−=−7.75 MPa (−9.67 MPa) at Δz2=−17.59 mm (−15 mm). The −6 dB (peak positive) region was approximately 36.3 mm (62.1 mm) long in the axial direction along the symmetry axis and 2.7 mm (5.9 mm) wide in the transverse direction at F2. The maximum dimensions for the −6 dB (peak positive) region were 36.3 mm in length and 2.9 mm in width.
VI. DISCUSSION
We now turn to the characterization of the two reflectors in this section. We first use the peak pressure field to analyze the flow physics. We then calculate the rmax fields using the work done on the bubbles to determine the effect reflector geometry has on the cavitation potential of the lithotripters. Finally, we present conclusions.
Figures 13(a) and 13(b) show the peak positive pressure field and Figs. 13(c) and 13(d) show the peak negative pressure field produced by the two reflectors. The dark areas in the grayscale denote high peak pressures (i.e., the most positive or negative pressures). The outline of the −6 dB regions for the original and upgraded reflectors are marked to help visualize the differences. To make an accurate comparison, the contours corresponding to the −6 dB pressures of the original reflector are plotted for the upgraded reflector. That is, the 24.05 and −4.13 MPa contours are shown for both reflectors. Note that the range of the axes are different between the positive and negative plots in order to represent better the dynamics of the flow field.
Several features of the field maps stand out. First, the focusing dynamics of the original reflector can be seen. The LSW approaches conically toward F2 and reflects off the symmetry axis at a smaller angle. Second, the −6 dB regions are larger for the negative case than the positive. This is due to the fact that leading shock of the LSW steepened and focused while rarefaction tail flattened out. Third, the field maps of the upgraded reflector contain distinct zones due to the multiple center and edge waves produced by the insert. A consequence of this is that the volume of strong negative pressure for the upgraded reflector is disconnected into three separate regions. Finally, the regions of intense compression and tension are more compact at F2 for the upgraded reflector. For example, the −6 dB volumes (with respect to peak positive pressure) were 1.6 and 0.4 cm3, and the −26 dB volumes (with respect to peak negative pressure) were 14.5 and 8.3 cm3 for the original and upgraded reflectors, respectively. Note that although the areas in Fig. 13 are similar, the corresponding volumes are vastly different when the plots are rotated about the symmetry axis.
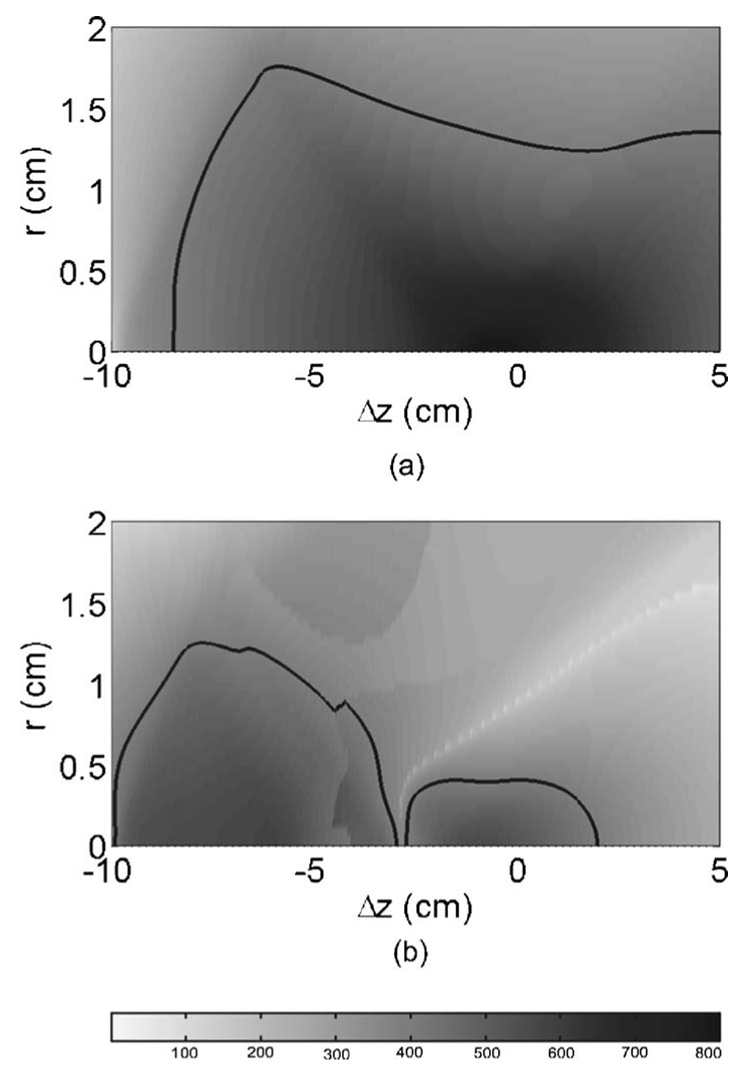
Next we make a comparison of the bubble dynamics associated with the pressure fields. Figure 14 shows the maximum radius fields produced by the original (a) and upgraded (b) reflectors. The radii were found by first determining the radial dynamics corresponding to the pressure fields with (7), then calculating the work done on the bubbles with (4), and finally determining the maximum radii by (5). The dark areas in the grayscale denote large radii. As before, the −6 dB contours are marked to help visualize the differences. Here we define the −6 dB radius the same way the −6 dB pressure is defined. Thus, the contours are the 429 µm contours.
FIG. 14.
A comparison of the maximum radius (µm) fields is shown in grayscale. The contours of the −6 dB regions are outlined for the original (a) and upgraded reflectors (b). The −6 dB contours for the upgraded reflector corresponds to the −6 dB radius for the original reflector. The r-scale is exaggerated for better visualization of differences.
From the maximum radius field maps, it is seen that the original reflector has its “focus” at Δz2=0. On the other hand, the upgraded reflector has two disconnected regions of high cavitation potential. The two regions are separated by a thin region of very low cavitation potential indicated by the white streak in the map. The streak, as well as the overall suppression of bubble growth for the upgraded reflector, is caused by the secondary LSW.
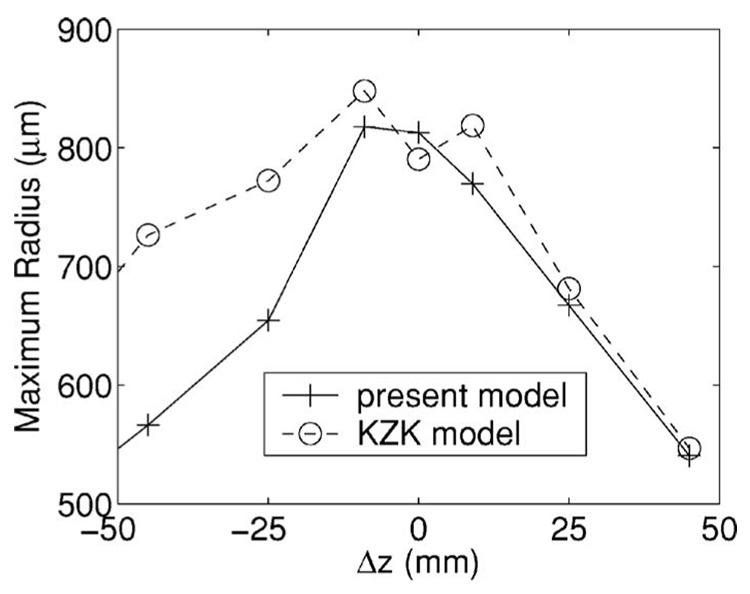
Figure 15 shows a comparison of the maximum radii on the symmetry axis for the original reflector calculated using pressure data from the present study and the KZK equation.31 Near and on the distal side of F2, both models show good agreement. In that range the difference between the two models is only a few percent. However, the models disagree by 10%–20% on the proximal side of F2.
FIG. 15.
A comparison of the maximum radii on the symmetry axis for the original reflector calculated using pressure data from the present study and the KZK equation (Ref. 30) is shown.
To provide even more qualitative validation for these bubble dynamics calculations, a simple experiment was performed to image bubbles near F2. The images were taken with a resettable CCD camera (Sony XC-ST50, Edmund Optics, Barrington, NH). A strobe backlight (1100 Series Lite- Pac, EG&G, Salem, MA) with a diffuser was used to illuminate the bubbles for ~1 µs during the bubble oscillation. The lithotripter spark registering on a photodetector was used to trigger the camera and the strobe light via a delay generator (DG535, Stanford Research Systems, Sunnyvale, CA). The instant of the spark discharge was used as the reference time (t=0) for the shadowgraph images. An ultrasound transducer (V395, F=150 mm, Panametics, Waltham, MA) was used as a passive cavitation detector (PCD) to mea-sure collapse time of the bubble field. The PCD signals were amplified and filtered with a Pulser/Receiver (PR5052, Panametics) recorded by a digital oscilloscope (Wave Runner 6050A, LeCroy, Chestnut Ridge, NY).
Figure 16 shows representative images of bubble fields near F2 for the original and upgraded reflectors at half the collapse time Tc. In the experiments, the collapse time (counted from the spark) was measured with the PCD (subtracting the propagation delay of the acoustic emission signal) and found to be 620 and 540 µs for the original and upgraded reflectors, respectively. This corresponded to collapse times of Tc=440 and 360 µs, respectively, because the LSW included a delay time of 180 µs. Thus, the moments of maximum bubble expansion (as measured by the PCD) were t=180 µs+Tc/2=400 µs and 360 µs. Figure 16 shows the bubble clusters at t=400 and 360 µs. At those times, the maximum bubble diameters were 2.6 mm and 1.5 mm for the original and upgraded reflectors, respectively. In comparison, the maximum bubble diameters calculated by our numerical scheme were 1.71 and 1.24 mm. The comparison is better for the upgraded reflector case than the original reflector case.
However, a better comparison is to look at the whole field rather than individual bubbles. In (a) large distinct bubbles can be seen throughout the frame, but in (b) distinct bubbles can only be found along the symmetry axis. This result is consistent with Fig. 14 in which the focal region is almost a constant black in (a), but varies greatly in (b). To facilitate the comparison, the −6 dB curve from Fig. 14(b) is plotted in Fig. 16(b) in order to show that the numerically obtained region of high cavitation captures all but a few of the large distinct bubbles seen in the experiments.
Now that we have asserted that the LSW simulation and cavitation potential are reasonably accurate, we turn to the implications of the results. From Fig. 14 we see that the use of an insert reduced the maximum cavitation potential of the original reflector. This implies that the use of an insert should decrease the propensity of vascular damage as well as the effectiveness of the reflector to break stones into fine grains. In vitro tests15 of vessel and stone phantoms confirm these statements. Those tests show that vessel phantoms can withstand over 200 shocks from the upgraded reflector but only 30 shocks from the original reflector. In addition, the upgraded reflector produced slightly larger stone fragments than the original.
Figure 14 also shows that the insert greatly reduced the extent of the high cavitation potential region of the original reflector. By localizing the region of high cavitation potential, one is able to maintain effective stone comminution while reducing collateral tissue damage, provided, of course, that adequate targeting can be maintained. Quantitatively, the volumes enclosed by the −6 dB contours for the original and upgraded reflectors were 102.8 and 25.8 cm3, respectively. Thus, the insert was a promising start to localization, and its effects suggest the possibility of optimizing the shape of the reflector.
In conclusion, a method to characterize shock wave lithotripters has been developed. The method is based on the cavitation potential of bubbles and uses the maximum radius achieved by a bubble as the key parameter that defines the potential damage a lithotripter could cause. Using this method, we characterized two reflectors: an ellipsoidal reflector and the same ellipsoidal reflector with an insert. The results showed that the use of an insert greatly reduced the extent of high cavitation potential region of the ellipsoidal reflector without compromising the magnitude of cavitation potential. In other words, the effect of the insert is primarily one of localizing—rather than eliminating—the region of high cavitation potential.
ACKNOWLEDGMENTS
This work was funded jointly by the National Science Foundation Program in Biomedical Engineering and the National Institutes of Health through Grant No. RO1-DK52985. The allocation on DataStar was granted through the Academic Associates Program to researchers from the University of California. We thank Dr. Brian Storey for use of his code. We acknowledge Mr. Prahallad Iyengar and Ms. Nicola Fung for help with the analysis. We also thank Dr. David Black-stock, Dr. Othmar Wess, and Dr. Tom Matula for their useful conversations.
Contributor Information
Jonathan I. Iloreta, Department of Mechanical Engineering, University of California, Berkeley, California 94720-1740, USA
Yufeng Zhou, Department of Mechanical Engineering and Materials Science, Duke University, Durham, North Carolina 27708, USA.
Georgy N. Sankin, Department of Mechanical Engineering and Materials Science, Duke University, Durham, North Carolina 27708, USA
Pei Zhong, Department of Mechanical Engineering and Materials Science, Duke University, Durham, North Carolina 27708, USA.
Andrew J. Szeri, Department of Mechanical Engineering, University of California, Berkeley, California 94720-1740, USA.
References
- 1.Chaussy C, Schmiedt E, Brendel W, Forssmann B, Walther V. 1st clinical experience with extracorporeally induced destruction of kidney-stones by shock-waves. J. Urol.(Baltimore) 1982;127:417. doi: 10.1016/s0022-5347(17)53841-0. [DOI] [PubMed] [Google Scholar]
- 2.Knapp PM, Kulb TB, Lingeman JE, Newman DM, Mertz JHO, Mosbaugh PG, Steele RE. Extracorporeal shock-wave lithotripsy-induced perirenal hematomas. J. Urol. (Baltimore) 1988;139:700. doi: 10.1016/s0022-5347(17)42604-8. [DOI] [PubMed] [Google Scholar]
- 3.Evan AP, Willis LR, Lingeman JE, McAteer JA. Renal trauma and the risk of long-term complications in shock wave lithotripsy. Nephron. 1998;78:1. doi: 10.1159/000044874. [DOI] [PubMed] [Google Scholar]
- 4.Coleman AJ, Saunders JE. A survey of the acoustic output of commercial extracorporeal shock wave lithotripters. Ultrasound Med. Biol. 1989;15:213. doi: 10.1016/0301-5629(89)90066-5. [DOI] [PubMed] [Google Scholar]
- 5.Zhong P, Zhou YF, Zhu SL. Dynamics of bubble oscillation in constrained media and mechanisms of vessel rupture in SWL. Ultrasound Med. Biol. 2001;27:119. doi: 10.1016/s0301-5629(00)00322-7. [DOI] [PubMed] [Google Scholar]
- 6.Bailey MR, Blackstock DT, Cleveland RO, Crum LA. Comparison of electrohydraulic lithotripters with rigid and pressure release ellipsoidal reflectors. II. Cavitation fields. J. Acoust. Soc. Am. 1999;106:1149. doi: 10.1121/1.427123. [DOI] [PubMed] [Google Scholar]
- 7.Evan AP, Willis LR, McAteer JA, Bailey MR, Connors BA, Shao Y, Lingeman JE, Williams JC, Jr., Fineberg NS, Crum LA. Kidney damage and renal functional changes are minimized by waveform control that suppresses cavitation in shock wave lithotripsy. J. Urol. (Baltimore) 2002;168:1556. doi: 10.1016/S0022-5347(05)64520-X. [DOI] [PubMed] [Google Scholar]
- 8.Sass W, Bräunlich M, Dreyer HP, Matura E, Folberth W, Priesmeyer HG, Seifert J. The mechanisms of stone disintegration by shock waves. Ultrasound Med. Biol. 1991;17:239. doi: 10.1016/0301-5629(91)90045-x. [DOI] [PubMed] [Google Scholar]
- 9.Pishchalnikov YA, Sapozhnikov OA, Bailey MR, Williams JC, Cleveland RO, Colonius T, Crum LA, Evan AP, McAteer JA. Cavitation bubble cluster activity in the breakage of kidney stones by lithotripter shockwaves. J. Endourol. 2003;17:435. doi: 10.1089/089277903769013568. [DOI] [PMC free article] [PubMed] [Google Scholar]
- 10.Sokolov DL, Bailey MR, Crum LA. Use of a dual-pulse lithotripter to generate a localized and intensified cavitation field. J. Am. Ceram. Soc. 2001;110:1685. doi: 10.1121/1.1394221. [DOI] [PubMed] [Google Scholar]
- 11.Sokolov DL, Bailey MR, Crum LA, Connors BA, Blomgren PM, Evan AP. Prefocal alignment improves stone comminution in shockwave lithotripsy. J. Endourol. 2002;16:709. doi: 10.1089/08927790260472845. [DOI] [PubMed] [Google Scholar]
- 12.Xi XF, Zhong P. Improvement of stone fragmentation during shock-wave lithotripsy using a combined EH/PEAA shock wave generator—in vitro experiments. Ultrasound Med. Biol. 2000;26:457. doi: 10.1016/s0301-5629(99)00124-6. [DOI] [PubMed] [Google Scholar]
- 13.Urosovskiĭ IA. Negative role of paraxial sound rays in lithotripsy. Acoust. Phys. 2000;46:430. [Google Scholar]
- 14.Zhong P, Zhou YF. Suppression of large intraluminal bubble expansion in shock wave lithotripsy without compromising stone comminution: Methodology and in vitro experiments. J. Am. Ceram. Soc. 2001;110:3283. doi: 10.1121/1.1416906. [DOI] [PubMed] [Google Scholar]
- 15.Zhou YF, Zhong P. Suppression of large intraluminal bubble expansion in shock wave lithotripsy without compromising stone comminution: Refinement of reflector geometry. J. Am. Ceram. Soc. 2003;113:586. doi: 10.1121/1.1528174. [DOI] [PubMed] [Google Scholar]
- 16.Zhou YF, Cocks FH, Preminger GM, Zhong P. Innovation in shock wave lithotripsy technology; updates in experimental studies. J. Urol. (Baltimore) 2004;172:1892. doi: 10.1097/01.ju.0000142827.41910.a2. [DOI] [PubMed] [Google Scholar]
- 17.Loske AM, Prieto FE, Gutierrez J, Zendejas H, Saita A, Gomez EV. Evaluation of a bifocal reflector on a clinical lithotripter. J. Endourol. 2004;18:7. doi: 10.1089/089277904322836596. [DOI] [PubMed] [Google Scholar]
- 18.Apfel RE, Holland CK. Gauging the likelihood of cavitation from short-pulse, low-duty cycle diagnostic ultrasound. Ultrasound Med. Biol. 1991;17:179. doi: 10.1016/0301-5629(91)90125-g. [DOI] [PubMed] [Google Scholar]
- 19.Holland CK, Apfel RE. An improved theory for the prediction of microcavitation thresholds. IEEE Trans. Ultrason. Ferroelectr. Freq. Control. 1989;36:204. doi: 10.1109/58.19152. [DOI] [PubMed] [Google Scholar]
- 20.Church CC. A theoretical study of cavitation generated by an extracorporeal shock wave lithotripter. J. Am. Ceram. Soc. 1989;86:215. doi: 10.1121/1.398328. [DOI] [PubMed] [Google Scholar]
- 21.Matula TJ, Hilmo PR, Storey BD, Szeri AJ. Radial response of individual bubbles subjected to shock wave lithotripsy pulses in vitro. Phys. Fluids. 2002;14:913. [Google Scholar]
- 22.Pearson A, Blake JR, Otto SR. Jets in bubbles. J. Eng. Math. 2004;48:391. [Google Scholar]
- 23.Keller JB, Miksis M. Bubble oscillations of large amplitude. J. Am. Ceram. Soc. 1980;68:628. [Google Scholar]
- 24.Yang XM, Church CC. A model for the dynamics of gas bubbles in soft tissue. J. Am. Ceram. Soc. 2005;118:3595. doi: 10.1121/1.2118307. [DOI] [PubMed] [Google Scholar]
- 25.Ohl CD. Cavitation inception following shock wave passage. Phys. Fluids. 2002;14:3512. [Google Scholar]
- 26.Bailey MR, Pishchalnikov YA, Sapozhnikov OA, Cleveland RO, McAteer JA, Miller NA, Pishchalnikova IV, Connors BA, Crum LA, Evan AP. Cavitation detection during shock-wave lithotripsy. Ultrasound Med. Biol. 2005;31:1245. doi: 10.1016/j.ultrasmedbio.2005.02.017. [DOI] [PubMed] [Google Scholar]
- 27.Pishchalnikov YA, Sapozhnikov OA, Bailey MR, Pishchalnikova IV, Williams JC, McAteer JA. Cavitation selectively reduces the negative-pressure phase of lithotripter shock pulses. ARLO. 2005;6:280. doi: 10.1121/1.2127115. [DOI] [PMC free article] [PubMed] [Google Scholar]
- 28.Pishchalnikov YA, McAteer JA, Williams JC, Pishchalnikova IV, Vonderhaar RJ. Why stones break better at slow shockwave rates than at fast rates: In vitro study with a research electrohydraulic lithotripter. J. Endourol. 2006;20:537. doi: 10.1089/end.2006.20.537. [DOI] [PMC free article] [PubMed] [Google Scholar]
- 29.Hilgenfeldt S, Brenner MP, Grossman S, Lohse D. Analysis of Rayleigh-Plesset dynamics for sonoluminescing bubbles. J. Fluid Mech. 1998;365:171. [Google Scholar]
- 30.Christopher T. Modeling the Dornier-HM3 lithotripter. J. Am. Ceram. Soc. 1994;96:3088. doi: 10.1121/1.411245. [DOI] [PubMed] [Google Scholar]
- 31.Averkiou MA, Cleveland RO. Modeling of an electrohydraulic lithotripter with the KZK equation. J. Am. Ceram. Soc. 1999;106:102. doi: 10.1121/1.427039. [DOI] [PubMed] [Google Scholar]
- 32.Tanguay M. Ph.D. thesis. California Institute of Technology; 2004. [Google Scholar]
- 33.Zhou YF, Zhong P. The effect of reflector geometry on the acoustic field and bubble dynamics produced by an electrohydraulic shock wave lithotripter. J. Am. Ceram. Soc. 2006;119:3625. doi: 10.1121/1.2195074. [DOI] [PMC free article] [PubMed] [Google Scholar]
- 34.Batchelor GK. An Introduction to Fluid Dynamics. Cambridge: Cambridge University Press; 1967. [Google Scholar]
- 35.LeVeque RJ. Wave propagation algorithms for multidimensional hyperbolic systems. J. Comput. Phys. 1997;131:327. [Google Scholar]
- 36.Chung C, Morris PJ. Acoustic scattering from two- and three-dimensional bodies. J. Comput. Acoust. 1998;6:357. [Google Scholar]
- 37.Brekhovskikh LM. Waves in Layered Media. New York: Academic; 1960. [Google Scholar]
- 38.Blackstock DT. Fundamentals of Physical Acoustics. New York: John Wiley & Sons; 2000. [Google Scholar]
- 39.Cleveland RO, Bailey MR, Fineberg N, Hartenbaum B, Lokhandwalla M, McAteer JA, Sturtevant B. Design and characterization of a research electrohydraulic lithotripter patterned after the Dornier HM3. Rev. Sci. Instrum. 2000;71:2514. [Google Scholar]
- 40.The reflection coefficient was not set to unity because it was found that the code was stable for R < 0.993. When reflection coefficients greater than this were used, spurious waves were emitted from the interface due to numerical dissipation. For R=0.993, the pressure waves emitted by the interface had amplitudes less than 1 MPa.
- 41.The simulation took a total of 7350 CPU hours. This huge computational cost could have been decreased significantly (by an estimated factor of at least 8) if we used the smallest domain that would have contained the LSW at all times and used the optimal number of CPUs that balanced computation and communication between CPUs. An adaptive mesh refinement (AMR) scheme was not implemented because clawpack does not incorporate both MPI and AMR.


