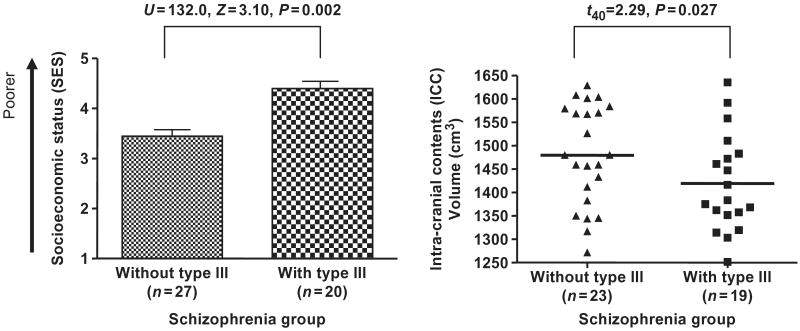
Fig. 5.
Functional and structural association with theType III expression in the patient group. The higher SES indicates poorer socioeconomic status. The volume of the intracranial contents (ICC) was computed from total grey matter, white matter and CSF volumes, i.e. above the most inferior axial slice containing cerebellum.

