Abstract
The vibrations in the OCN stretching region of phenyl cyanate are examined by two-dimensional infrared spectroscopy. In water and THF, these spectra display three diagonal peaks having cross peaks characteristic of anharmonically coupled transitions. The pattern of the spectra is reproduced by coupling of two overtones with the OCN fundamental.
1. Introduction
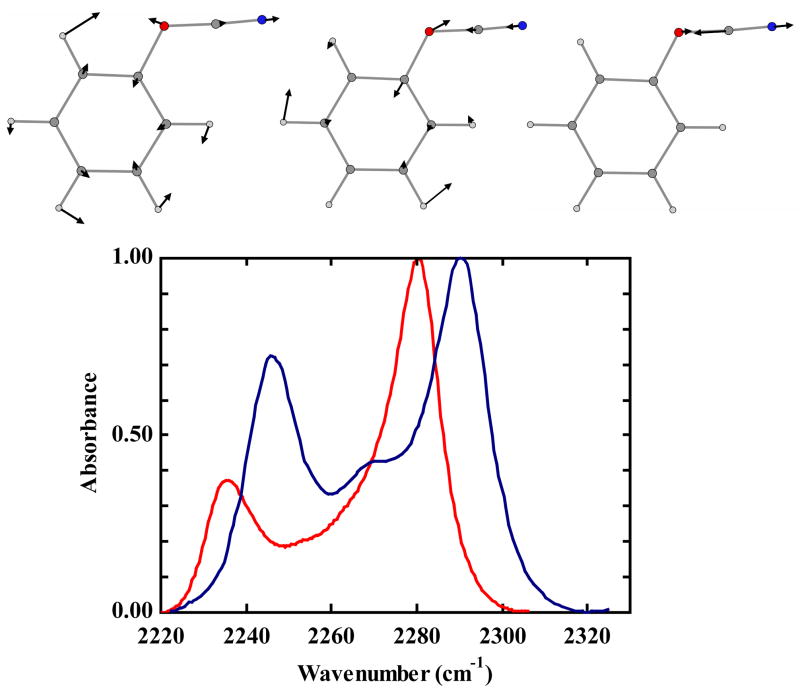
Infrared vibrational markers, such as the amide-I band as well as non-natural amino acid side chains have become very useful to expose protein and peptide interactions [1]. For example, the stretching frequency of the nitrile group is an infrared probe that can provide local site-specific vibrational dynamics for biological studies including ultrafast measurements. The relatively sharp spectral features of nitriles in a spectral region that is separated from other peptide absorptions combined with their sensitivity to the local environment renders them useful for the investigation of peptide membrane interactons, drug-enzyme interactions, and other protein and peptide studies [2–7]. However, the relatively small absorption cross section of the nitrile vibrational transition necessitates that it be used in higher concentrations than is usually desirable for protein systems; furthermore the absorption signal can become buried in the water absorption bands. It is important to seek new vibrational probes that are suitable for protein studies. One possible candidate is the cyanate, OCN, group (Figure 1). The absorption cross section of cyanates is about one order of magnitude greater than nitriles allowing it to be utilized at concentrations comparable to those used for amide-I infrared spectra. Although not yet utilized as a probe, it has been shown that it can be incorporated into a peptide system [8].
Figure 1.
FTIR spectra of phenyl cyanate in water (blue) and tetrahydrofuran (red).(normalized to unity at the strongest peak) The three normal mode displacements involved in the anharmonic coupling are shown above the spectra. (O and N atoms are colored red and blue, respectively)
The FTIR spectra of aromatic and allyl cyanates have shown an interesting vibrational signature in the 2100 cm−1 region where at least three transitions are seen [9–11]. Since there is only one asymmetric OCN stretching mode in this spectral region, these bands arise from its coupling with combinations of other lower frequency modes. The mechanism of this coupling is not yet described [10]. Theoretical calculations of alkyl cyanates have assigned these peaks as Fermi resonances but experimental confirmation is lacking [12]. The two lower frequency peaks of phenyl cyanate (see Figure 1) have been suggested to arise from coupling with the phenyl ring modes which is consistent with the fact that most cyanic acid alkylesters show only one intense OCN band [10,13]. However, two strong bands have been observed in the infrared spectrum of ethyl cyanate which suggests there are resonances that do not require phenyl modes [14,15]. Although the general theoretical descriptions of Fermi resonance are well established [16], linear IR alone does not characterize these couplings unequivocally. On the other hand, two-dimensional infrared photon echo (2D IR) measurements can expose the anharmonic coupling between modes. The 2D IR spectroscopy has been shown to be useful method for clarifying vibrational spectral features of numerous condensed-phase systems including intermode coupling in peptides, identification of multiple conformers, chemically exchanging species, and other examples [17–22]. Here, we report the 2D IR of the OCN region of phenyl cyanate and show that the multiple transition pattern observed is consistent with near, accidental resonances between a small number of overtone states with the OCN mode.
As the energy increases in the vibrational manifold, the likelihood of near degeneracies becomes much larger and spectral manifestations of anharmonic coupling become common [23–25]. There are relatively few 2D IR studies of Fermi resonances in vibrationally sparse systems [17,24,26]. The Fermi resonances of benzene have been investigated by controlling the pulse ordering in 2D IR [26]. Hamm and coworkers have reported on the Fermi resonance of the C=O mode of benzoylchloride by means of 2D IR [17]. In this example, the zero-order modes are considered to be degenerate. For the OCN mode of phenyl cyanate, it will be seen that the 2D IR spectra present a different pattern than that observed for benzoylchloride. A vibrational coupling model is presented that has interesting and novel features in 2D IR that are accounted for by the zero order peak separation and the anharmonicities of the modes involved. The 2D IR allows direct confirmation of the presence of these resonances. The combination of the large absorption cross section of cyanates, their sensitivity to solvent, and ability to be incorporated into peptides render them useful as candidates for protein studies and the pattern of anharmonically coupled states renders them highly distinctive.
2. Experimental Section
Materials
Solutions of 30–60 mM Phenyl cyanate (Sigma-Aldrich) in water and tetrahydrafuran (THF, Fisher) were used for both 2D IR and FTIR experiments. The optical density of the samples ranges from 0.14–0.45 with a 56 μm path length CaF2 cell.
2D IR Method
Fourier-transform limited 75-fs pulses with center frequencies of 2260 cm−1 or 2280 cm−1 were used in the 2D IR experiments for the samples in THF or water, respectively. Three laser pulses each with energy, ~ 400 nJ, having wave vectors k1, k2, and k3, were incident to the sample to generate a signal in the direction ks=−k1+k2+k3. The phase-matched signal was detected by heterodyning with a local oscillator pulse that preceded it by a fixed interval of ~1.5 ps. The time interval between pulse 1 and 2 is denoted as τ, the coherence time, and the time between pulses 2 and 3 is denoted as T, the waiting time. The rephasing and nonrephasing signals arises when the k1 pulse arrives earlier or later than k2. The signal and local oscillator pulses are combined at the focal plane of a monochromator equipped with a 64 element mercury-cadmium-telluride array detector (InfraRed Associates, Stuart, FL). Each detector element is 200 μm in width and 1 mm in height. The monochromator had a focal length of 190 mm and a 100 lines per mm groove grating was used in our experiments. All 2D IR spectra were obtained by sampling a coherence time from −5 to 5 ps in steps of 2 fs. To obtain absorptive spectra, the rephasing and nonrephasing 2D frequency spectra were combined. To observe the dynamics of the spectra, the waiting time, T, was varied from 0 to 2 ps with a 200 fs interval. After appropriate Fourier transforms along the coherence and detection axes they are plotted as ωτ vs.ωt in a standard manner [27]. The timezeros or overall phases of the spectra were determined by matching the pump probe data to the projection of the absorptive spectrum taken under the same conditions. The vibrational relaxation time, T1, for the two main transitions were determined from 2D IR spectra at different T values. Assuming single exponential decays of the diagonal signals, I = I0e−T/T1, where I is the intensity of the diagonal peaks and T is the waiting time, the relaxation time, T1, is equal to the time when only 1/e or 37% of the signal remains.
Gaussian03 Computations
An anharmonic frequency calculation of phenyl cyanate was performed using a B3LYP/6-31+G* level of theory. The computation was used as a guide to estimate the anharmonicities, determine whether certain modes were coupled, as well as to assign vibrational transitions.
3. Results
The linear IR spectrum of phenyl cyanate in THF exhibits three bands in the region of the OCN asymmetric stretching mode. The strongest transition is at 2281 cm−1 which we will refer to as the main OCN stretching band. The peak extinction for the main band is equal to 800 ± 50 M−1 cm−1. There is also a band at 2236 cm−1 of moderate intensity and a weaker one at 2265 cm−1 (Figure 1 - red curve). A spectral shift of all three bands to higher frequency of approximately 10 cm−1 is observed when changing from the aprotic solvent, THF, to water. The dielectric constant of THF is ca. 10 times greater than water. Changes in the band widths of the peaks are also observed. By fitting the absorption spectrum in both solvents to three gaussians, the widths(relative amplitudes in parenthesis) were determined to be 11(1), 35(0.52), and 14(0.48) cm−1 for 2281, 2265, 2236 cm−1, respectively, in THF and 15(1), 36(0.5), 14(0.79) cm−1 for the peaks at 2291, 2272, and 2246 cm−1, respectively, in water. The bandwidth of the main OCN band increases in water compared with THF while the other bands undergo no significant change. The relative signal amplitudes of the bands are different for the two solvents. Temperature has negligible effects on the relative strengths of the three transitions in either solvent. The adoption of a model of the spectrum that includes only three transitions is an assumption that proves to be consistent with the simulations of spectra but clearly has some arbitrariness.
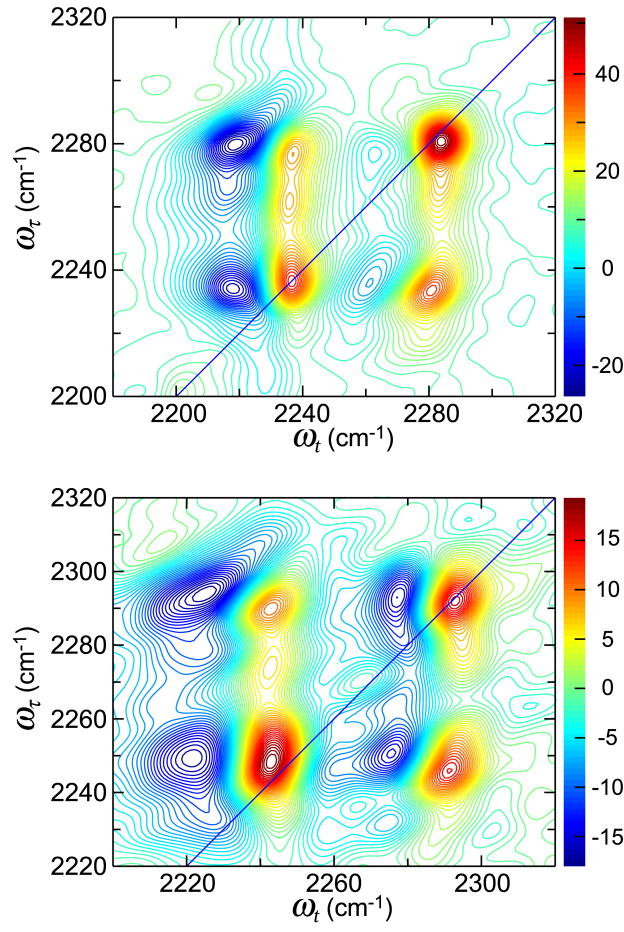
The 2D IR spectra (Figure 2) of phenyl cyanate in THF have at least three peaks along the diagonal shown as positive peaks at positions ωτ= ωt= 2236, 2265, and 2281 cm−1. The peaks do not tilt or elongate along the diagonal as would be typical for inhomogeneously broadened transitions. The negative regions of the 2D IR at 2236 and 2281 cm−1 correspond to shifts of ca. 16 cm−1 from the main diagonal peaks. A 16 cm−1 shifted transition is not observed for the middle peak at 2265 cm−1. Coupling between the three diagonal transitions is indicated by the presence of positive cross peaks located at {ωτ, ωt} values of {2281,2236} cm-1, {2236,2281} cm−1, {2265,2236} cm−1, and {2265,2281} cm−1. Each of the positive signal cross peaks is associated with a negative peak that is shifted ca. 17 cm−1 to lower frequency. The cross peaks are elliptically shaped and the major axis of the ellipse is tilted in a direction parallel to the diagonal (see e.g. {ωτ, ωt}={2236,2281}). Later it will be shown that this directionality is related to the correlation of the frequency distributions of the coupled modes. The 2D IR peaks of phenyl cyanate in water form a similar two-dimensional pattern to those in THF but with altered frequencies, relative signal strengths, and slight differences in their shapes (Figure 2). The three transitions along the diagonal are observed as positive peaks at positions ωτ= ωt= 2246, 2272, and 2291 cm−1. The positive cross peaks due to the coupling of these transitions are located at {ωτ, ωt} values of {2291,2246} cm−1, {2246,2291} cm−1, {2272,2246} cm−1, and {2272,2291} cm−1. The signal amplitudes of the 2291 cm−1 and 2246 cm−1 diagonal transitions have a ratio of 1:2. The observed cross peaks in the water spectrum are also tilted in the direction parallel to the diagonal.
Figure 2.
2D IR spectra of phenyl cyanate in tetrahydrafuran (top) and water (bottom) at waiting time, T=0.
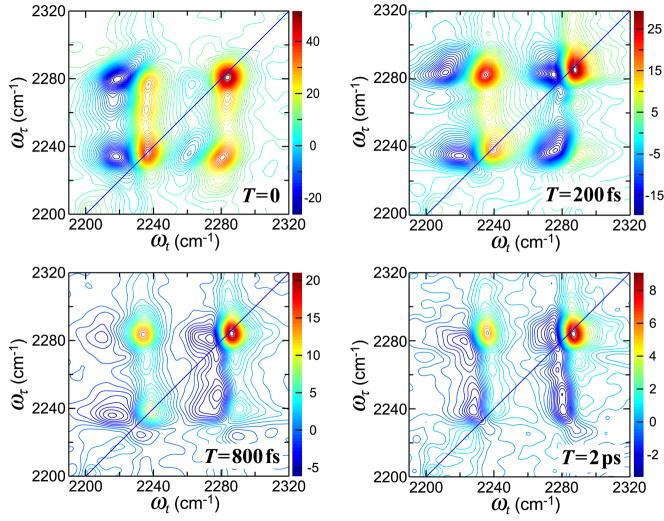
The 2D IR of the OCN region (Figure 3) in THF changes significantly with waiting time. The elliptically shaped cross peak becomes oriented vertically with the aforementioned tilt having disappeared by 800 fs. All the diagonal signals decay with a time constant of approximately 2 ps assumed to be due to population relaxation. The shape of the high frequency diagonal peak, 2281 cm−1, does not seem to vary much over the 2 ps relaxation time. All the cross peak signals also decay over a time of 2 ps. One of the cross peaks, {ωτ, ωt}={2281,2236}, appears to increase by 30% during the first 200 fs of waiting time interval and then decays with the 2 ps time constant. This initial increase is not a simple beating between the two coupled modes, which would be on the timescale of 700 fs. The peak signals of the negative transitions decay about 2–3 times faster than the positive ones. However, the significant spectral diffusion occurring will not be quantitatively evaluated in this paper.
Figure 3.
Real part of the absorptive 2D IR spectra for phenyl cyanate in THF at waiting times T=0 (top left), T=200 fs (top right), T=800 fs (bottom left), and T=2.0 ps (bottom right).
Modeling
The only stable conformer from Gaussian03 optimization has the OCN in the plane of the benzene ring. No other conformations have been reported. Gaussian03 calculations for phenyl cyanate predict one allowed transition in the 2200 cm−1 region. This mode corresponds approximately to an OCN asymmetric stretch. We utilized these calculations to determine modes whose overtones or combinations are close to 2200 cm−1. The COC stretching mode and another low frequency mode involving the COC and ring motions were identified in the appropriate region of 1100–1250 cm−1. Therefore, a theoretical description of the 2D IR spectrum of the OCN resonance region was developed assuming the involvement of the three modes ν1 (the OCN stretch), ν2 (the COC stretch), and ν3 (ring motion) with the basis states written as |ν1ν2ν3>, where νk is the number of quanta of mode k. The 2D IR spectra involve all the bleaching, stimulated emission and excited state absorption diagrams [28] that incorporate these three transitions with all the dipole strength arising from the OCN stretch. The fundamental region consists of transitions from the ground state to the three states seen in FTIR. The energies and eigenvectors of these states in the absence of the anharmonic coupling between the nearby modes are needed for 2D IR calculation. They were deduced from the linear IR spectra by demixing [29], which is a least-squares fitting procedure that uses the observed frequencies and their relative integrated transition cross sections to find the three zero-order frequencies ω1,ω2 andω3 corresponding to the fictitious partially anharmonic states |100〉, |020〉, and |002〉 respectively, and the three anharmonic coupling constantsα1,α 2 andα3 that mix them. The zero order levels in the V=1 → V=2 region of the OCN stretch were located at the six combinations of these three frequencies ω4 = 2ω1,ω5 = 2ω2,ω6 = 2ω3,ω7 =ω1 +ω2,ω8 =ω1 +ω3 andω9 =ω2 +ω3. The required first order diagonal anharmonic shifts χk for levels 4 to 6 were determined from Gaussian03 and 7 to 9 were varied to fit the observed spectra. The cubic and quartic anharmonic couplings between the overtone region states 4 to 9 were expressed, by assuming harmonic oscillator combination rules, in terms of the three values of α obtained from the demixing of the linear spectra. In the lowest order, the values of α1 andα2 are the cubic couplings of the state |100〉, at ω1, with |020〉 and |002〉 at ω2 and ω3 respectively, whereas α3 is a quartic coupling of |020〉 with |002〉. The six eigenvalues and eigenvectors were determined by matrix diagonalization. As an example we consider the cubic term V57:
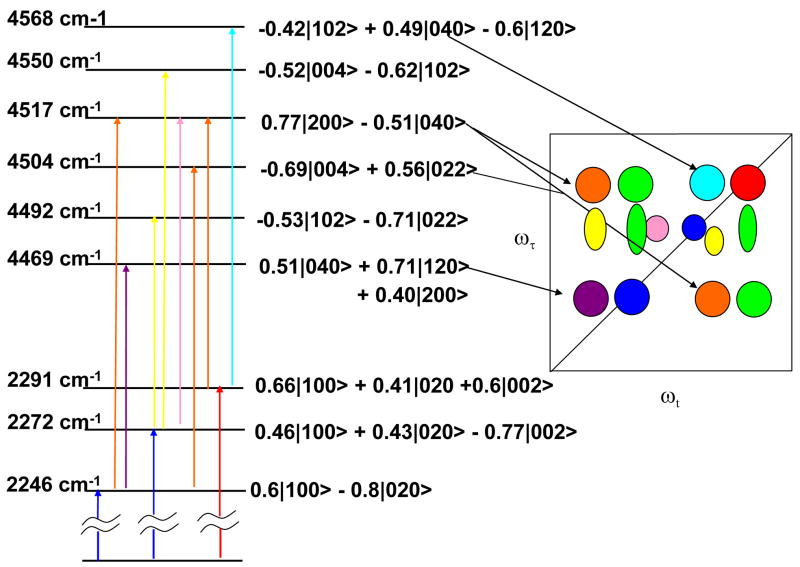
Terms of sixth, seventh and eighth order in the normal mode displacements naturally arise in this treatment but were neglected in the analysis. The evaluation of the matrix elements between states 4 to 9 follows closely the approach reported by Hamm and coworkers.23 The values determined by the best least square fit to the experimental data for THF were 2265.5, 1123.2, and 1135 cm−1 for ω1,ω2 andω3, respectively, and 35.1, 12.3, and 8.5 cm−1 for the α1,α2 andα3, respectively. The values determined by the best least square fit to the experimental data for water were 2271.4, 1129.3, and 1139.8 cm−1 for ω1,ω2 andω3, respectively, and 35.1, 18.2, and 5.7 cm−1 for the α1,α2 andα3, respectively. The χ’s were then varied to find the best fit to the locations of the negative transitions in the 2D IR experimental spectrum. The energies of the OCN overtone region determined from the three state model are 4444, 4453, 4481, 4497, 4519, and 4545 cm−1 for THF. For water, they are: 4568, 4550, 4517, 4504, 4492, and 4569 cm−1.
A calculation of the 2D IR calculation including all relevant Liouville diagrams [30] based on the eigenstates in Figure 5 was carried out assuming Bloch dynamics. Each pathway incorporates the product of four transition dipoles. The relative magnitude of each dipole product is obtained from the contribution of the OCN stretch dipole to each of the four dipoles in the product. Diagrams representing ground-state bleaching μ0 jμj0μ0iμi0{0i|00|j0}, stimulated emission μ0iμi0μ0iμi0{0i|ii|i0}, excited-state absorption μikμkiμi0μ0i{0i|ii|ki} and their coherence terms μ0 jμj0μ0iμi0{0i|ji|j0} and μikμkjμj0μ0i{0i|ji|ki} were included along with their nonrephasing counterparts, where i and j can be chosen as any of the V=0 → V=1 region states and k as any of the eigenstates involved in V=1 → V=2 region transitions of the OCN stretch. The inhomogeneous and homogeneous parameters, assuming Voigt profiles, were incorporated into the frequency domain responses[31] by averaging them (homogeneous damping parameters: 9, 9, and 8 cm−1) over gaussian distributions having widths of 12, 20, and 12 cm−1 for the 2236, 2265, 2281 cm−1 modes, respectively. For the water example, the homogeneous damping parameters were chosen as 9.5, 9.1, 7.4 cm−1 and the gaussian distributions widths as 9.1, 16.7, and 10.3 cm−1. It will be seen that this model, while providing a reasonable fit to the FTIR, does not capture the detail of the 2D IR spectral shapes.
Figure 5.
Diagram of energy levels involved in the simulated 2D IR spectrum of phenyl cyanate.
5. Discussion
It appears certain that the three transitions seen in the FTIR spectrum in the region of the OCN stretch arise from near resonance anharmonic interactions. They do not correspond to different conformations caused by specific solvent interactions since they are observed in different solvents. Furthermore, the relative intensities of the two main bands in either THF or water solvent are temperature independent corroborating that the spectra are not due to an equilibrium between conformations [21]. The solvent shifts in combination with the strong dipole strength and bandwidth variations illustrate the sensitivity of this probe to different environments. The increase in the relative intensity of the low energy bands observed in water is caused by the increased inhomogenous broadening in the water reducing the main band peak intensity. Our observations of the 2D IR spectrum of phenyl cyanate indicate that a strong anharmonic coupling generates the pattern of transitions reported using FTIR. This is in contrast to a previous interpretation of the FTIR spectrum [10]. The pattern of transitions is reminiscent of that reported by Hamm and coworkers [17] for a C(CO)Cl mode having a ‘perfect’ Fermi resonance with two degenerate zero order states. In contrast to the present results for cyanate, the multiple peaks seen in the linear spectrum of ethyl isocyanate have been shown by 2D IR to correspond to gauche-trans isomers which exchange and exhibit cross peaks only after a waiting time delay [32].
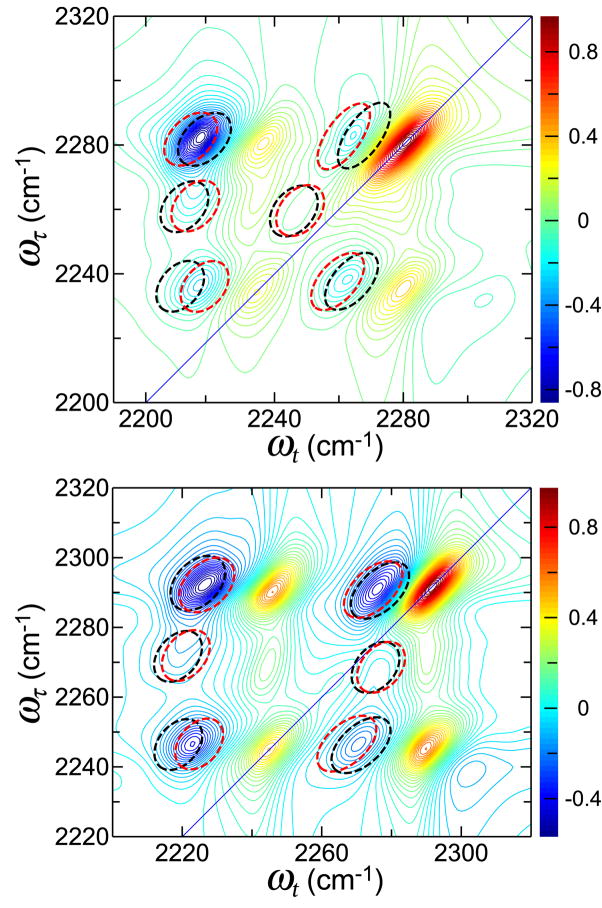
The three-state model was able to reproduce the general trend of the pattern of frequencies observed in the experimental 2D IR spectrum (Figure 4). The close proximity of the zero-order states in the OCN overtone region causes the fundamental transition strength to be significantly delocalized among the different modes. Therefore the results, such as those in Figure 5, are very sensitve to the choices of diagonal anharmonicity. For example, modes |120> and |102> are strongly mixed with the higher energy transitions as seen by the eigenvectors (Figure 5). The negative portions of the 2D IR spectrum arise mainly from the strong interactions of |120> with |040> and |200>, and of |102> with |004>. Thus, the anharmonic shifts of these modes, χ7 and χ8, have significant effects on the positions of all the negative transitions in the 2D IR spectra. By varying these values by as little as 5%, the overall spectrum can be modified significantly. The patterns of black ellipses (dashed lines) in Figure 4 are computed by increasing χ7 and χ8 by just 5% from the best fit values, while the red ellipses are obtained when these values are decreased by 5%. The resulting deviation from the experimental frequency pattern, which is coincident with the colored contours, is significant and systematic as is seen by inspection of Figure 4.
Figure 4.
Simulated 2D IR Spectrum of phenyl cyanate generated from the interaction of the OCN stretch with two overtones (see text) at T=0 for THF (top) and water (bottom).
The analysis using frequency correlation function based on Bloch dynamics is clearly not capturing the correct shapes of the 2D IR peaks. This approximation assumes a static distribution of frequencies that spreads the signals into the elliptical shapes along the diagonal direction. The observed shapes are significantly more circular and not so extended along the diagonal as those in the simulation for any choice of parameters. This result implies that the inhomogeneous distribution of frequencies is not static during the coherence and detection periods. More circular shapes will be captured by employing correlation functions that are linear combinations of Kubo functions [33,34]. A detailed fit of the signals to such multiparameter correlation functions will form the basis of a future publication but already the occurrence of significant spectral diffusion is evident from the 2D IR shape changes during the T interval shown in Figure 3. The main results from the present work concern the modeling of the peak frequencies associated with the linear spectrum and the positive and negative regions of the 2D IR spectrum. Furthermore, it is evident that the spectral diffusion significantly influences the T=0 spectral shapes in 2D IR.
The 2D IR cross peaks are sensitive to the correlations of the frequency fluctuations of the diagonal peaks of the coupled modes. These correlations can be visualized from the angle of tilt of the major axes of the cross peak elliptically shaped signals at early waiting times. The tilt disappears in ca. 500 fs (Figure 3). The simulations showed that the two intense modes, 2236 and 2281 cm−1, needed to be strongly correlated but all other correlation coefficients could be set to zero.
6. Conclusions
We have shown that the spectral features in the OCN stretch region of phenyl cyanate are a result of its anharmonic coupling (Fermi near-resonance interactions) with overtone states. This result is made evident by 2D IR experiments that show the static coupling between the spectral components. The cubic and quartic anharmonic coupling constants obtained by ‘demixing’ of the FTIR spectra provide a qualitative reproduction of the 2D IR peak locations but a simple Bloch model does not reproduce the diagonal spectral shapes in 2D IR.
Acknowledgments
The research was supported by NIH and NSF and instrumentation developed at the Research Resource (NIH P41RR001348).
Footnotes
Publisher's Disclaimer: This is a PDF file of an unedited manuscript that has been accepted for publication. As a service to our customers we are providing this early version of the manuscript. The manuscript will undergo copyediting, typesetting, and review of the resulting proof before it is published in its final citable form. Please note that during the production process errors may be discovered which could affect the content, and all legal disclaimers that apply to the journal pertain.
References
- 1.Barth A, Zscherp C. Q Rev Biophys. 2002;35:369. doi: 10.1017/s0033583502003815. [DOI] [PubMed] [Google Scholar]
- 2.Tucker MJ, Getahun Z, Nanda V, DeGrado WF, Gai F. J Am Chem Soc. 2004;126:5078. doi: 10.1021/ja032015d. [DOI] [PubMed] [Google Scholar]
- 3.Suydam IT, Snow CD, Pande VS, Boxer SG. Science. 2006;313:200. doi: 10.1126/science.1127159. [DOI] [PubMed] [Google Scholar]
- 4.Suydam IT, Boxer SG. Biochemistry. 2003;42:12050. doi: 10.1021/bi0352926. [DOI] [PubMed] [Google Scholar]
- 5.Getahun Z, Huang CY, Wang T, De Leon B, DeGrado WF, Gai F. J Am Chem Soc. 2003;125:405. doi: 10.1021/ja0285262. [DOI] [PubMed] [Google Scholar]
- 6.Fang C, Bauman JD, Das K, Remorino A, Arnold E, Hochstrasser RM. Proc Natl Acad Sci U S A. 2008;105:1472. doi: 10.1073/pnas.0709320104. [DOI] [PMC free article] [PubMed] [Google Scholar]
- 7.Maienschein-Cline MG, Londergan CH. J Phys Chem A. 2007;111:10020. doi: 10.1021/jp0761158. [DOI] [PubMed] [Google Scholar]
- 8.Powers JC, Tuhy PM, Witter F. Biochim Biophys Acta. 1976;445:426. doi: 10.1016/0005-2744(76)90096-6. [DOI] [PubMed] [Google Scholar]
- 9.Groving N, Holm A. Acta Chemica Scandinavica. 1965;19:1768. doi: 10.3891/acta.chem.scand.19-2423. [DOI] [PubMed] [Google Scholar]
- 10.Reich P, Martin D. Proc Conf Appl Phys-Chem Methods Chem Anal. 1966;3:197. [Google Scholar]
- 11.Groving N, Holm A, Jensen KA, Due M. Acta Chemica Scandinavica. 1965;19:443. [Google Scholar]
- 12.Pasinszki T, Westwood NPC. J Phys Chem. 1995;99:1649. [Google Scholar]
- 13.Reich P, Martin D. Chem Ber. 1965;98:2063. [Google Scholar]
- 14.Martin D. Angewandte Chemie-International Edition. 1964;3:311. [Google Scholar]
- 15.Martin D, Bauer M. Org Synth. 1983;61:35. [Google Scholar]
- 16.Kondratyuk P. Spectrochimica Acta Part a-Molecular and Biomolecular Spectroscopy. 2005;61:589. doi: 10.1016/j.saa.2004.05.010. [DOI] [PubMed] [Google Scholar]
- 17.Edler J, Hamm P. Journal of Chemical Physics. 2003;119:2709. [Google Scholar]
- 18.Fang C, Wang J, Charnley AK, Barber-Armstrong W, Smith AB, Decatur SM, Hochstrasser RM. Chem Phys Lett. 2003;382:586. [Google Scholar]
- 19.Fang C, Wang J, Kim YS, Charnley AK, Barber-Armstrong W, Smith AB, Decatur SM, Hochstrasser RM. J Phys Chem B. 2004;108:10415. [Google Scholar]
- 20.Kim YS, Hochstrasser RM. Proc Natl Acad Sci U S A. 2005;102:11185. doi: 10.1073/pnas.0504865102. [DOI] [PMC free article] [PubMed] [Google Scholar]
- 21.Kim YS, Hochstrasser RM. J Phys Chem B. 2006;110:8531. doi: 10.1021/jp060935n. [DOI] [PMC free article] [PubMed] [Google Scholar]
- 22.Kumar K, Sinks LE, Wang JP, Kim YS, Hochstrasser RM. Chem Phys Lett. 2006;432:122. [Google Scholar]
- 23.Heyne K, Huse N, Nibbering ETJ, Elsaesser T. Chem Phys Lett. 2003;382:19. doi: 10.1103/PhysRevLett.91.197401. [DOI] [PubMed] [Google Scholar]
- 24.Huse N, Bruner BD, Cowan ML, Dreyer J, Nibbering ETJ, Miller RJD, Elsaesser T. Phys Rev Lett. 2005;95:147402/1. doi: 10.1103/PhysRevLett.95.147402. [DOI] [PubMed] [Google Scholar]
- 25.Asbury JB, Steinel T, Stromberg C, Gaffney KJ, Piletic IR, Goun A, Fayer MD. Chem Phys Lett. 2003;374:362. doi: 10.1103/PhysRevLett.91.237402. [DOI] [PubMed] [Google Scholar]
- 26.Donaldson PM, Guo R, Fournier F, Gardner EM, Barter LMC, Barnett CJ, Gould IR, Klug DR, Palmer DJ, Willison KR. J Chem Phys. 2007;127 doi: 10.1063/1.2771176. [DOI] [PubMed] [Google Scholar]
- 27.Kim YS, Wang J, Hochstrasser RM. J Phys Chem B. 2005;109:7511. doi: 10.1021/jp044989d. [DOI] [PubMed] [Google Scholar]
- 28.Hamm P, Lim MH, Hochstrasser RM. J Phys Chem B. 1998;102:6123. [Google Scholar]
- 29.Wang J, Hochstrasser RM. J Phys Chem B. 2006;110:3798. doi: 10.1021/jp0530092. [DOI] [PubMed] [Google Scholar]
- 30.Ge NH, Zanni MT, Hochstrasser RM. J Phys Chem A. 2002;106:962. [Google Scholar]
- 31.Hochstrasser RM. Adv Chem Phys. 2006;132:1. [Google Scholar]
- 32.Levinger NE, Davis PH, Behera PK, Myers DJ, Stromberg C, Fayer MD. J Chem Phys. 2003;118:1312. [Google Scholar]
- 33.Mukamel S. Principles of nonlinear optical spectroscopy. Oxford University Press; New York: 1995. [Google Scholar]
- 34.Schmidt JR, Sundlass N, Skinner JL. Chem Phys Lett. 2003;378:559. [Google Scholar]


