Abstract
BACKGROUND/PURPOSE: Despite its potential for visualizing white matter fiber tracts in vivo, diffusion tensor tractography has found only limited applications in clinical research in which specific anatomic connections between distant regions need to be evaluated. We introduce a robust method for fiber clustering that guides the separation of anatomically distinct fiber tracts and enables further estimation of anatomic connectivity between distant brain regions.
METHODS: Line scanning diffusion tensor images (LSDTI) were acquired on a 1.5T magnet. Regions of interest for several anatomically distinct fiber tracts were manually drawn; then, white matter tractography was performed by using the Runge-Kutta method to interpolate paths (fiber traces) following the major directions of diffusion, in which traces were seeded only within the defined regions of interest. Next, a fully automatic procedure was applied to fiber traces, grouping them according to a pairwise similarity function that takes into account the shapes of the fibers and their spatial locations.
RESULTS: We demonstrated the ability of the clustering algorithm to separate several fiber tracts which are otherwise difficult to define (left and right fornix, uncinate fasciculus and inferior occipitofrontal fasciculus, and corpus callosum fibers).
CONCLUSION: This method successfully delineates fiber tracts that can be further analyzed for clinical research purposes. Hypotheses regarding specific fiber connections and their abnormalities in various neuropsychiatric disorders can now be tested.
Diffusion tensor imaging (DTI) is one of the first methods that made it possible to visualize and quantify the organization and integrity of white matter fiber tracts in the human brain in vivo. Since its introduction,1 this method has become increasingly popular in clinical research. Numerous studies have investigated either global diffusion changes within the white matter in various neuropsychiatric diseases or in particular fiber tracts hypothesized to be affected in conditions, such as schizophrenia, Alzheimer disease, multiple sclerosis, brain tumor, and so forth.2,3 DTI characterizes the behavior of local water diffusion for each image voxel. Several indices of anisotropy (the extent to which local water diffusion remains restricted by linearly organized axonal fibers) have been introduced to quantify this phenomenon. Among the most popular scalar indices measured from DTI are fractional anisotropy (FA) and mean diffusivity. These measures, believed to be related to axonal coherence and attenuation in each voxel, are usually obtained on several sections, within either a small manually defined region of interest or large standardized regions of interest. Neither method, however, captures properties of water diffusion for the whole single fiber tract.
Fiber tractography4 is a promising new method for visualizing bundles of white matter fiber tracts in the brain. The method follows the principal diffusion direction (direction of maximal diffusion) in small steps, producing long fiber tracts that connect anatomically distant brain regions. These tractographic paths are commonly referred to as fibers, though the data resolution is too low to measure any individual fibers or axons; instead, the paths represent large-scale features of the diffusion data. The remaining problem in clinical research, however, is how to quantify the features defined by tractography and, in particular, how to extract tracts of interest. Since the introduction of fiber tractography, several methods have been proposed to delineate anatomically distinct fiber tracts. So far, the most frequently used method has multiple regions of interest. This is a guided method that performs fiber tractography, starting from seed points within the first predefined region of interest, and then preserves only traces that touch the other predefined region of interest.
Instead of this guided method, fiber clustering approaches, which are fully automatic, unguided, and take advantage of the similarity of the fiber paths, have been proposed. Fiber clustering methods analyze a collection of tractographic paths in 3D and separate them into bundles, or clusters, that contain paths with similar shape and spatial position. These bundles are expected to contain fiber paths with similar anatomy and function. Several fiber clustering methods have been described in the literature. One method by Brun et al5 uses a 9D path shape descriptor, performs a pairwise path shape comparison, and then uses the normalized cuts spectral clustering method6-8 to group the paths into bundles. This work is an extension of pioneering work by Brun et al,9 who performed soft grouping of fiber paths by using spectral embeddings. Another method10,11 compares path shapes by using variants on the Hausdorff distance (the largest distance separating pairs of points on the paths).12 This latter method then groups paths by using a hierarchical clustering algorithm, an iterative approach that groups the most similar paths at each step. O’Donnell and Westin13 explored extension of clustering techniques to simultaneously cluster multiple subjects. Our method groups tract paths on the basis of shape and location by using k-way normalized cuts spectral clustering. Here, we test the method on several brain fiber bundles and demonstrate its utility, advantages, and disadvantages.
Methods
Acquisition
Line scanning diffusion imaging (LSDI)14 was used to acquire diffusion tensor data on a 1.5T GE Echospeed system (GE Healthcare, Milwaukee, Wis), permitting maximum gradient amplitudes of 40 mT/m. Coronal oblique images, perpendicular to the anterior commissure-posterior commissure line were acquired with a quadrature head coil. For each line, 6 images with high (1000 seconds/mm2) diffusion-weighting along 6 noncollinear directions and 2 with low (5 seconds/mm2) diffusion-weighting were collected. We used the following scanning parameters: receiver bandwidth, ±4 kHz; TR/TE, 2592/64 ms; effective TR, 2592 ms. We acquired a total of 32–36 sections (1.7 × 1.7 × 4 image resolution) covering the entire brain, depending on brain size. As part of the same protocol, 5 midsagittal oblique LSDI scans (again 1.7 × 1.7 × 4 mm) were also acquired, parallel to the interhemispheric fissure. These images were coregistered to coronal sections and used for corpus callosum region of interest definition.
Subjects were normal controls recruited from the general community and participating in other studies through the Laboratory of Neuroscience. Inclusion criteria for all subjects were the following: right-handedness, age between 18 and 55 years, no history of electroconvulsive shock treatment, no history of neurologic illness, no alcohol or drug abuse in the last 5 years, no medication with known effects on MR imaging such as steroids, verbal IQ above 75, and an ability and desire to cooperate with the procedures as evidenced by written informed consent. The study was approved by the local institutional review board committee.
Region of Interest Definition
For the purpose of this study, we manually delineated several regions of interest. Because the resolution of our DTI acquisition is much higher in-plane (coronal), 2 of our 3 regions of interest were defined on the coronal plane. The first region of interest included the fornix (left and right together). The second region of interest was drawn on the temporal stem, where 2 fiber tracts, the uncinate fasciculus and inferior occipitofrontal fasciculus, merge. The third region of interest for the corpus callosum was drawn on sagittal DTI images acquired at the same time as the coronal scans. Because the sagittal reconstruction of coronal data was characterized by poor resolution, this step allowed us to take advantage of the high in-plane resolution of the sagittal sections. All regions of interest were drawn on the fractional anisotropy (FA) map because the fiber bundles were easier to define than on the regular structural images. FA is a measure of tensor anisotropy that is high in voxels when a single fiber direction is present. Seeding for the fiber tracking was performed for each voxel included in the region of interest.
Data Analysis
Our method of data analysis involved 2 steps. First, fiber tractography produced fiber paths; then, fiber clustering delineated the paths into separate bundles. Both of these analyses, tractography and fiber clustering, were performed by using 3D Slicer software (www.slicer.org).
Tractography
Diffusion tensor tractography was performed on coronal DTI images using an eigenvector (principal diffusion direction) tracking algorithm based on the second-order Runge-Kutta method. First, points were seeded within the predefined regions of interest; then, tractography was performed by repeatedly following in small steps along the interpolated direction of maximal diffusion. Tracking stopped when FA dropped below 0.1 or when fiber direction rapidly changed (because of noise that had caused a higher curvature than expected anatomically).
Fiber Clustering
Spectral clustering6-8 is a method that groups data on the basis of its similarity to other data. First, each item to be clustered is compared with every other item to calculate a similarity value. If there are N items, N-squared similarity values will be calculated, and these values are stored in a matrix. For the fiber clustering, we calculated fiber path similarity on the basis of shape and position. To measure similarity between 2 paths, we used the average distance between pairs of nearest points on the paths (we then averaged the value computed from path A to path B with the value from path B to path A, because the pairs of nearest points could be different). This is a modification of the Hausdorff distance,12 which was suggested by Corouge et al10 and Gerig et al.11 We also had the option of using the distance between pairs of end points9 or the mean and covariance distance as defined by Brun et al.5 Next we produced a similarity value from this distance by inverting the values (converting low distances to high similarities and vice versa) by using a gaussian function.5
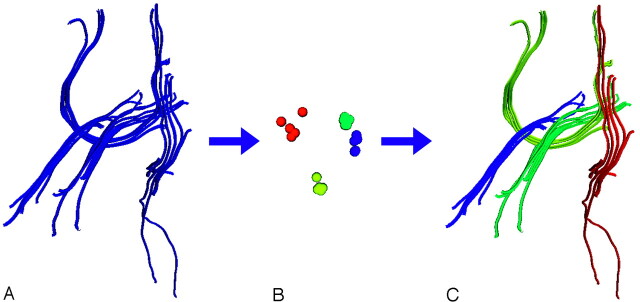
After calculating similarity values, we automatically extracted the most important shape similarity information and used it to group the tractographic paths into bundles. The term “spectral” in spectral clustering refers to the use of the eigenvectors of the similarity matrix. An eigenvector is a vector that when multiplied by the matrix, still points in the same direction (the eigenvector is only scaled by the matrix, not rotated). The scale factor is called an “eigenvalue.” In general, a square matrix such as our N-by-N similarity matrix can be approximated by using its top eigenvectors and eigenvalues. The higher the eigenvalue, the more information the corresponding eigenvector contains about the matrix. In our clustering application, we used the top eigenvectors of the fiber similarity matrix to calculate the most important shape similarity information for each fiber path while removing noise. For each fiber path, this information could be visualized as a point, to show the separation of clusters according to similarity, as shown in Fig 1. The specific type of spectral clustering that we used, k-way normalized cuts,6-8 has been shown to produce clusters that have high within-cluster similarity and low between-cluster similarity.
Fig 1.
The most important shape information is automatically extracted and used for clustering. A, Image shows the input fiber tracts. B, Image shows the clustering step. Each point in this image represents the similarity relationships of 1 fiber (these points come from the highest eigenvectors of the similarity matrix in a process called “spectral embedding”). C, Image shows the tracts are colored by cluster.
Results
Fornix
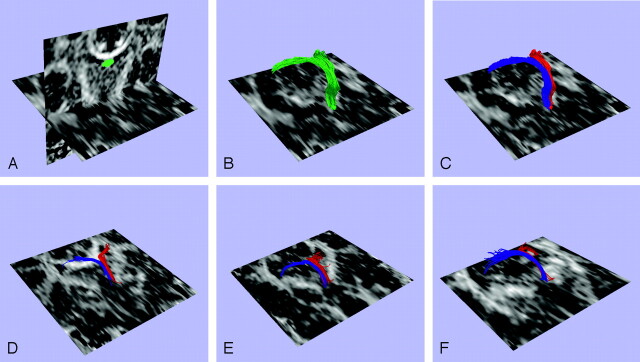
These fibers originate from the crux of the hippocampi, and before they merge, they are relatively thick and short, being theoretically easy to define. Their trajectory, however, is almost parallel to our coronal plane; this location makes it difficult to avoid partial volume effects. Starting from the body of the fornix, we found that the 2 structures are located so close together that it is extremely difficult to manually divide them into left and right. Moreover, because of the aforementioned partial volume effect due to the curvature of the fornix, a region of interest can be drawn reliably on only 1 coronal section perpendicular to the body of the fornix. Thus, the guided multiple-region-of-interest method would have been unreliable in defining left and right fornices. Using the clustering method, we could reliably separate left and right fornices (Fig 2C, left [red] and right [blue] fornix).
Fig 2.
Fiber tract clustering in the fornix. A fiber path was seeded in each voxel of the single region of interest, which can be seen in image A. These fibers are shown in image B. Next the clustering method was applied to separate the fiber paths into 2 clusters, the left (red) and right (blue) fornices, as shown in image C. Images D–F show similar clustering results for additional subjects.
Temporal Stem
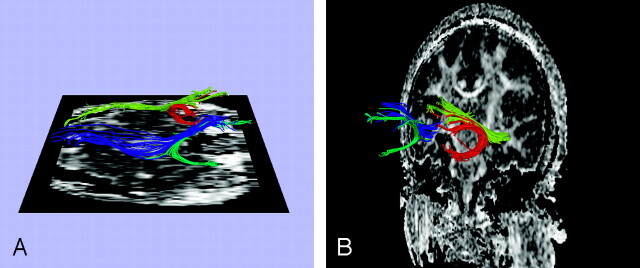
The temporal stem forms the bridge between frontal and temporal lobes, containing fiber tracts connecting the frontal lobes with more posterior brain regions such as the temporal, parietal, and occipital lobes. Thus in a small cross-sectional area, the temporal stem includes fibers of different functions. Previous region-of-interest methods have attempted to measure anisotropy within the temporal stem but could not distinguish separate fiber tracts included in this region.2 The clustering method clearly differentiates the uncinate fasciculus (fiber tract connecting orbitofrontal and anterior temporal regions) from the inferior occipitofrontal fasciculus (tract connecting frontal, posterior temporal, and occipital lobes), 2 fiber tracts traveling in close vicinity through the temporal stem (Fig 3). The advantage of clustering over the multiple-region-of-interest fiber tracking method for this region lies in the fact that the uncinate fasciculus includes many short fibers that arc around the lateral fissure. Consequently, the multiple-region-of-interest method would cut off most of them (and would be dependent on the placement of the second region of interest), whereas clustering could preserve all the fiber paths of similar function.
Fig 3.
Fiber paths were seeded in each voxel of initial seed regions of interest located in the temporal stem. The clustering was then performed (A, B) to create 2 groups of paths, corresponding to the inferior occipitofrontal fasciculus and the uncinate fasciculus.
Corpus Callosum
The corpus callosum is the largest fiber tract of the human brain. Its divisions, however, are not well defined in terms of anatomic connectivity. We used our method to investigate anatomic divisions of the corpus callosum. Fiber tracking was initiated from seed points placed within the midsagittal cross-section of the entire corpus callosum.
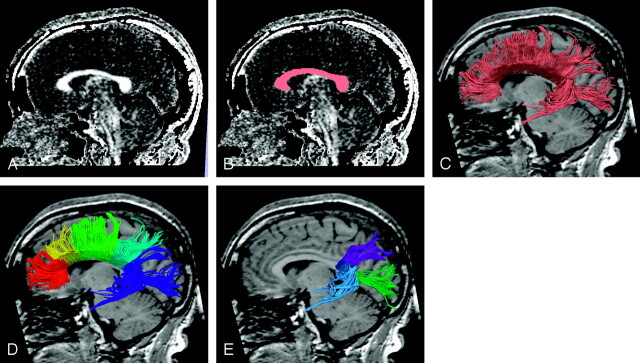
The desired results of performing clustering of the corpus callosum are its division into anatomic regions according to the fiber projections—for example orbitofrontal, dorsolateral frontal, parietal, occipital, and temporal regions. However, because of the overall similarity of fiber path shapes, (Fig 4C) clustering of the whole corpus callosum at once does not give satisfactory results. This drawback is because the clustering is based only on shape and position and thus cannot capture divisions between these anatomic regions unless the tract shapes vary. In the genu and the body of the corpus callosum, the tract shape is so similar from one path to its neighbors that the algorithm cannot differentiate on the basis of shape and is forced to divide the corpus into approximately even-sized pieces (Fig 4D). Consequently, we concentrated on performing clustering in the splenium of the corpus callosum, where a shape difference can be noted between fibers projecting to the temporal and occipital lobes (Fig 4E).
Fig 4.
Fiber tract clustering in the corpus callosum. Using a fractional anisotropy map (A), we drew a region of interest on the corpus callosum (B).Because fiber paths have similar shapes (C), clustering produces an inadequate result (D). If the user isolates a region of the corpus callosum containing fiber paths of different shapes, clustering is successful (E).
Discussion
We demonstrate that the method of fiber clustering can differentiate fiber bundles that would otherwise be difficult to define and separate from the neighboring structures. The extraction of fiber bundles is becoming one of the most important tasks in clinical neuroscience research in which specific hypotheses about connectivity between distant brain areas are being tested. The fiber bundles are more powerful for quantitative analysis than regions of interest defined on individual sections because they allow definition of 3D regions of interest and they permit quantification of tract-shape properties as well as measurement of scalar indices from the tensor field. Imaging studies in neuropsychiatric disorders, such as schizophrenia, bipolar disorder, schizotypal personality disorder, and so forth, could benefit from the increased sensitivity and specificity of whole fiber tract diffusion anisotropy estimation because the 2D region-of-interest–based studies carried out so far show inconsistent results.2,15 Automatic definition of fiber bundles may also aid in surgical planning by providing improved 3D visualization of fiber tracts that may closely border a tumor.
In comparison with the commonly used multiple-region-of-interest tract-selection method, our method is more automatic and depends only on the shape and location of the fiber tracts, rather than on user placement of selected regions of interest. Although an advantage of the multiple-region-of-interest method is that it displays only the fiber tract of interest to the user, its major limitation is that because of low DTI resolution, it is usually difficult to define more than 1 region of interest for a single bundle. Also, because definition of the regions of interest of fiber tracts displaced or interrupted by a lesion can be much more difficult, clustering on the basis of shape similarities can be used in these cases. In addition, the multiple-region-of-interest method excludes shorter fibers that though they run in the same direction, do not touch 2 regions of interest.
The methods described in this article avoid these problems; however, there are several limitations worth noting. Even though no a priori anatomic knowledge about the entire trajectory of the fiber tract is required, we still have to define, a priori, the number of clusters that we expect to find. It would be of interest to determine this number automatically; however, the automatic determination of the number of clusters inherent in data is still a research problem in the field of spectral clustering. Various methods have been proposed including an iterative method, which measures cluster validity16 and a method that rotates the affinity matrix.17 However, the approach we have taken is straightforward and simple, because it allows the user to interactively control the number of clusters expected/required, which is based on anatomic a priori knowledge and/or on a priori hypotheses. Because no methods currently make possible the automatic identification of white matter tracts in the brain, deferring to expert knowledge to determine the number of clusters is the best standard we have at this time.
Second, the example of the corpus callosum demonstrated that the method cannot subdivide structures with very consistent shapes, though it is effective in separating shapes that differ. This shortcoming suggests that more anatomic information is necessary to subdivide the anterior corpus callosum. This information could be provided via shape relations to other neighboring tracts or through additional user input about the anatomy.
Finally, the quality of the clustering results depends on the quality of the input paths, which in turn is determined by the data quality and the tractography algorithm. Improvements in data quality, such as a higher number of diffusion directions, could produce an improvement in the clustering output. The performance of the fiber tractography depends on many factors, including data resolution, noise, image distortions, and partial volume effects caused by multiple tracts in a voxel. At current image resolutions, this method does not detect water behavior within the individual axons but instead describes the estimated local diffusion properties in the tensor field; thus, tractography should be regarded as a visualization of features in this field. It is nonetheless remarkable that several studies describe the similarity of fiber tracts obtained with DTI tractography to anatomically defined white matter fiber bundles.18,19
Conclusion
We have tested the method on several brain fiber bundles, including the fornix, the temporal stem, and the corpus callosum, and we have demonstrated its utility, advantages, and shortcomings. Our method can find applications in surgical planning, clinical neuropsychiatry, and anatomy. Higher spatial resolution of diffusion images, as well as combination of clustering and multiple-region-of-interest methods, should further increase the accuracy and specificity of the proposed method.
Footnotes
This work was supported by HST Neuroimaging Training Grant (L.J.O.); the National Alliance for Research on Schizophrenia and Depression (M.K.); Wodecroft Foundation (M.K.); National Institutes of Health (grant R03 MH 068464–02 to M.K. and grants K02 MH 01110 and R01 MH 50747 to M.E.S.); the Department of Veteran Affairs REAP Award (M.E.S.), grant NIHP41-RR13218 (C.F.W.), grant NIH NINDS 1-R01-NS051826–01 (W.E.L.G.); and National Alliance for Medical Image Computing (NAMIC), http://www.na-mic.org, funded by the National Institutes of Health through the NIH Roadmap for Medical Research, Grant U54 EB005149 (W.E.L.G., L.J.O., M.E.S., M.K.). Information on the National Centers for Biomedical Computing can be obtained from http://nihroadmap.nih.gov/bioinformatics.
References
- 1.Basser PJ, Mattiello J, LeBihan D. MR diffusion tensor spectroscopy and imaging. Biophys J 1994;66:259–67 [DOI] [PMC free article] [PubMed] [Google Scholar]
- 2.Kubicki M, Westin CF, Maier SE, et al. Diffusion tensor imaging and its application to neuropsychiatric disorders. Harv Rev Psychiatry 2002;10:324–36 [DOI] [PMC free article] [PubMed] [Google Scholar]
- 3.Lim KO, Helpern JA. Neuropsychiatric applications of DTI: a review. NMR Biomed 2002;15:587–93 [DOI] [PubMed] [Google Scholar]
- 4.Basser PJ, Pajevic S. In vivo fiber tractography using DT-MRI data. Magn Reson Med 2000;44:625–32 [DOI] [PubMed] [Google Scholar]
- 5.Brun A, Knutsson H, Park HJ, et al. Clustering Fiber Traces Using Normalized Cuts: Proceedings of the 7th International Conference on Medical Image Computing and Computer-Assisted Intervention (MICCAI), 2004;368–75. [DOI] [PMC free article] [PubMed]
- 6.Fowlkes C, Belongie S, Chung F, et al. Spectral grouping using the Nystrom method. IEEE Trans Pattern Anal Mach Intell 2004;26:214–25 [DOI] [PubMed] [Google Scholar]
- 7.Ng AY, Jordan MI, Weiss Y. On spectral clustering: analysis and an algorithm. In: Dietterich TG, Becker S, Ghahramani S, eds., Advances in Neural Information Processing Systems 14. Cambridge, Mass: MIT Press;2002;849–56
- 8.Shi J, Malik J. Normalized cuts and image segmentation. IEEE Trans Pattern Anal Mach Intell 2000;22:888–905 [Google Scholar]
- 9.Brun A, Park HJ, Knutsson H, et al. Coloring of DTMRI fiber traces using Laplacian eigenmaps. Proceedings of the 9th International Conference on Computer Aided Systems Theory (EUROCAST), Las Palmas de Gran Canaria, Spain, February2003;564–72
- 10.Corouge I, Gouttard S, Gerig G. Towards a Shape Model of White Matter Fiber Bundles Using Diffusion Tensor MRI: Proceedings of the International Symposium of Biomedical Imaging (ISBI), Arlington, Va, April2004;344–47
- 11.Gerig G, Gouttard S, Corouge I. Analysis of Brain White Matter via Fiber Tract Modeling: Proceedings of the 26th Annual International Conference of the IEEE EMBS, San Francisco, Calif, 1–5 September2004;426. [DOI] [PubMed]
- 12.Huttenlocher D, Klanderman D, Rucklige A. Comparing images using the Hausdorff distance. IEEE Trans Pattern Anal Mach Intell 1993;15:850–63 [Google Scholar]
- 13.O’Donnell L, Westin CF. White matter tract clustering and correspondence in populations. Proceedings of the 8th International Conference on Medical Image Computing and Computer-Assisted Intervention (MICCAI), Palm Springs, Calif, October2005;140–47 [PubMed]
- 14.Gudbjartsson H, Maier SE, Mulkern RV, et al. Line scan diffusion imaging. Magn Reson Med 1996;36:509–19 [DOI] [PubMed] [Google Scholar]
- 15.Kubicki M, Park H, Westin CF, et al. DTI and MTR abnormalities in schizophrenia: analysis of white matter integrity. Neuroimage 2005;26:1109–18 [DOI] [PMC free article] [PubMed] [Google Scholar]
- 16.Porikli F. Ambiguity Detection by Fusion and Conformity: A Spectral Clustering Approach. Presented at the IEEE International Conference Integration of Knowledge Intensive Multi-Agent Systems (KIMAS); Waltham, Mass, May2005;366–72
- 17.Zelnik-Manor L, Perona P. Self-Tuning Spectral Clustering. Presented at the Annual Meeting of the National Information Processing Systems; December 5–7,2005; Vancouver, B.C., Canada
- 18.Conturo TE, Lori NF, Cull TS, et al. Tracking neuronal fiber pathways in the living human brain. Proc Natl Acad Sci USA 1999;96:10422–27 [DOI] [PMC free article] [PubMed] [Google Scholar]
- 19.Stieltjes B, Kaufmann WE, van Zijl PC, et al. Diffusion tensor imaging and axonal tracking in the human brainstem. Neuroimage 2001;14:723–35 [DOI] [PubMed] [Google Scholar]


