

Abstract
Chemotherapy-induced diarrhoea is a major oncological problem, caused by the cytotoxic effects of cancer chemotherapy. Irinotecan is linked with severe mucositis and diarrhoea, the mechanisms of which remain poorly understood. Bacterial β-glucuronidase is thought to be involved in the metabolism of irinotecan, implicating the intestinal flora. Intestinal mucins may also be implicated in the development of chemotherapy-induced diarrhoea. Rats were treated with 200 mg/kg of irinotecan and killed at 96, 120 and 144 h. The rats were monitored for diarrhoea. Pathology and immunohistochemical staining was performed. The samples were cultured and faecal DNA was analysed using real-time polymerase chain reaction. Severe diarrhoea was observed from 72 to 96 h. A decrease in body mass was also observed after treatment. Significant changes in goblet cell numbers (both complete and cavitated cells) were observed in the small and large intestines. Changes in MUC gene expression were observed in the small intestine only. Modifications were observed to the intestinal flora profile, especially Escherichia coli, and an increase in the expression of β-glucuronidase was detected. In conclusion, irinotecan-induced diarrhoea may be caused by an increase in some β-glucuronidase-producing bacteria, especially E. coli, exacerbating the toxicity of active metabolites. Accelerated mucous secretion and mucin release may also contribute to the delayed onset of diarrhoea.
Keywords: bacteria, chemotherapy, diarrhoea, intestinal mucosa, mucositis
Irinotecan is effective in treating a wide variety of solid tumours, through the inhibition of DNA topoisomerase I. However, it is linked with severe mucositis and diarrhoea (Armand et al. 1995; Ikuno et al. 1995; Takasuna et al. 1996; Gibson et al. 2003; Brandi et al. 2006; Stringer et al. 2007). Cholinergic, secretory diarrhoea occurs early, although this can be managed by blocking neurons containing acetyl choline (ACh) in the enteric nervous system with atropine. Delayed severe diarrhoea also occurs; this is one of the main dose-limiting side-effects of irinotecan treatment (Gibson et al. 2003). The metabolism of irinotecan has been described previously (Smith et al. 2006). Briefly, irinotecan and SN-38 bind to the topoisomerase I–DNA complex, leading to double-stranded (ds) breakage and cell death. Previous research has shown that bacterial β-glucuronidase plays a crucial role in the intestinal toxicity of irinotecan (Takasuna et al. 1996, 2006). Bacterial β-glucuronidase is produced primarily by Enterobacteriaceae (Escherichia coli, Salmonella spp., Shigella spp., Yersinia spp., Citrobacter spp., Hafnia spp. and Edwardia spp.), and has been reported to be produced by Flavobacterium spp., Bacteroides spp., Staphylococcus spp., Streptococcus spp., Corynebacterium spp. and Clostridium spp. (Tryland & Fiksdal 1998).
Irinotecan has previously been shown to alter the intestinal microflora up to 72 h after treatment, both qualitatively (Stringer et al. 2007) and quantitatively (Stringer et al. 2008), in particular, bacteria known to produce β-glucuronidase (including E. coli). We have also shown that irinotecan treatment decreases goblet cells in the large intestine at time points up to 72 h (Stringer, Gibson, Logan, Bowen, Yeoh, Laurence and Keefe, unpublished data). However, mucous secretion is increased at this time, which may contribute to the development of late-onset irinotecan-induced diarrhoea (Stringer, Gibson, Logan, Bowen, Yeoh, Laurence and Keefe, unpublished data). The exact mechanisms of late-onset diarrhoea are still unclear.
The aim of this study was to determine if the early changes seen in the luminal environment, specifically changes in gastrointestinal flora (especially those genera that are known to produce β-glucuronidase and may interfere with the processing of irinotecan) and intestinal mucins, were also observed during irinotecan-induced late-onset diarrhoea in rats treated with irinotecan.
Materials and methods
Animals
Animals used in this study were female Dark Agouti (DA) rats, weighing between 150 and 170 g. Rats were housed in Perspex cages at a temperature of 22 ± 1 °C and subject to a 14 h light/10 h dark cycle. Approval for the use of animals was granted by the Animal Ethics Committees of the Institute of Medical and Veterinary Science (IMVS), and The University of Adelaide, and complied with the National Health and Medical Research Council (Australia) Code of Practice for Animal Care in Research and Teaching (2004). Because of the nature of the diarrhoea induced by irinotecan, animals were monitored four times daily and if any animal showed certain criteria (as defined by the Animal Ethics Committees) they were euthanized. These criteria included a dull ruffled coat with accompanying dull and sunken eyes, cold to touch with no spontaneous movement and a hunched appearance.
Experimental plan
Twenty-seven rats were randomly assigned to groups. For each time point, there was one group of six rats receiving irinotecan and one group of three control rats receiving no treatment. Rats receiving irinotecan received 0.01 mg/kg of subcutaneous atropine (to reduce the cholinergic reaction) immediately prior to administration of 200 mg/kg of intraperitoneal irinotecan. This dose has been previously shown to induce diarrhoea (Logan et al. 2007a;Stringer et al. 2007). Irinotecan (kindly supplied by Pfizer, Kalamazoo, Michigan, USA) was administered in a sorbitol/lactic acid buffer (45 mg/ml sorbitol/0.9 mg/ml lactic acid, pH 3.4), required for activation of the drug, at time designated 0 h. Groups of rats were killed using 3% halothane in 100% O2 anaesthesia and cervical dislocation at times 96, 120 and 144 h postirinotecan treatment. Immediately prior to anaesthesia, faecal samples were aseptically collected by directly collecting the excreted faeces immediately as it left the rat in sterile containers in an area cleaned with 70% ethanol. Samples were frozen in N2(l) and stored at –70 °C. The gastrointestinal tract (GIT; from the pyloric sphincter to the rectum) was dissected out and separated into the small intestine (pyloric sphincter to ileocaecal sphincter) and colon (ascending colon to rectum). The small intestine was flushed with chilled, sterile distilled water, and 1 cm samples taken at approximately 50% of the length, were collected for histological and microbiological procedures. The colon was also flushed with chilled sterile, distilled water. Samples (1 cm) of colon, taken at approximately 50% of the length were also collected for histology and microbiology. The stomach was dissected and the contents were emptied and discarded. Small pieces (1 cm × 0.5 cm) of the stomach were collected for histology and microbiology. All the samples for histological examination were fixed in 10% neutral buffered formalin, processed and embedded in paraffin. All samples for microbiology were stored at −70 °C until required.
Diarrhoea assessment and bodyweight
Diarrhoea was assessed as described previously (Gibson et al. 2003, 2005, 2007; Bowen et al. 2007; Logan et al. 2007a; Stringer et al. 2007). Briefly, all animals were checked four times daily and diarrhoea was graded accordingly as 0 (no diarrhoea), 1 (mild diarrhoea), 2 (moderate diarrhoea) and 3 (severe diarrhoea).
Electrolyte analysis
Blood samples were centrifuged (Hereus, Helsinki, Finland) at 3000 rpm for 5 min. The serum was collected into a fresh tube and analysed by the Department of Clinical Pathology, IMVS, Adelaide, South Australia. Sodium, potassium, bicarbonate, chloride, anion gap and osmolality were measured.
Histological examination
Samples were paraffin-embedded and stained as previously described (Stringer et al. 2007). Stained sections were reported by a specialist veterinary pathologist (Dr John Finnie, Institute of Medical and Veterinary Science).
Alcian Blue-Periodic Acid Schiffs (PAS) stain
Sections were stained with Alcian Blue-PAS as described previously (Bowen et al. 2007). Briefly, the sections were stained in Alcian Blue [1% Alcian Blue 8GX (CI 74240) in 3% glacial acetic acid] for 5 min, then oxidized in 1% periodic acid before being treated for 15 min in Schiff’s reagent. To determine the effect of irinotecan on mucous secretion, goblet cells were counted as previously described (Barcelo et al. 2000). Briefly, decreased goblet cells indicated release of mucins from the mucosal surface, and cavitation of mucous cells is a sign of accelerated mucous secretion by compound exocytosis (Barcelo et al. 2000). Therefore, both the number of goblet cells and percentage of cavitated cells were analysed. A cavitated cell is recognized by apical indentation into the intracellular store of mucous granules. Goblet cells and cavitated cells in crypts and villi that were deemed to be greater than 80% complete were counted, with a total of at least 15 villi/crypts per section analysed.
Immunohistochemistry
Sections were cut from paraffin blocks at 4 μm and mounted onto silane-coated glass slides. Sections were dewaxed in xylene and brought to water via a graded series of alcohols. Antigen retrieval was carried out using 10 mmol/l of citrate buffer (pH 6.0) and heat, with sections subjected to microwave (mw) irradiation in a domestic microwave with a carousel, microwaved on HIGH (930 W) until boiling, followed by LOW (650 W) for 10 min. Endogenous peroxidases were blocked with 3% H2O2 in methanol. Non-specific antibody binding was blocked with either 20% normal goat serum (NGS) or normal horse serum (NHS; Sigma, Sydney, Australia) in phosphate buffer saline applied at room temperature for 30 min.
Sections were incubated with primary antibody diluted in the corresponding serum (5%) (Table 1). The sections were incubated sequentially with secondary antibody (Vector Laboratories, Burlingame, CA, USA) and 5 μl/ml of Vectastain ABC kit solution (Vector Laboratories). For visualization of the bound antibodies, the sections were incubated with 3′3-diaminobenzidine (DAB; Zymed, Sanfrancisco, CA) for up to 5 min, or until a brown precipitate appeared on positive control sections. Nuclei were counterstained with haematoxylin. The sections were examined using light microscopy. Negative controls were obtained by incubating with 5% serum instead of the primary antibody solution.
Table 1.
Details of primary antibodies used
| Primary antibody | Blocking serum | Secondary antibody | Incubation conditions | Antibody concentration | Manufacturer |
|---|---|---|---|---|---|
| Anti-MUC 1 | NHS | Horse anti-goat | 4 °C overnight | 2.0 μg/ml | Santa Cruz Biotechnology |
| Anti-MUC 2 | NGS | Goat anti-rabbit | 22 °C 1 h | 0.3 μg/ml | Santa Cruz Biotechnology |
| Anti-MUC 3 | NGS | Goat anti-rabbit | 4 °C overnight | 0.01 μg/ml | Previous study (unpublished data) |
| Anti-MUC 4 | NGS | Goat anti-mouse | 4 °C overnight | 5.0 μg/ml | Zymed Laboratories |
| Anti-KLF 4 | NHS | Horse anti-goat | 4 °C overnight | 2.0 μg/ml | R&D Systems |
| Anti-β-glucuronidase | NGS | Goat anti-Escherichia coli | 4 °C overnight | 6.7 μg/ml | Molecular Probes |
NGS, normal goat serum; NHS, normal horse serum.
Culture of samples
To determine the flora of the DA rat treated with irinotecan, a variety of selective and non-selective media (Oxoid, Adelaide, Australia) was used in an attempt to identify as many bacteria as possible from the GIT. For detailed methodology, please refer to http://www.ncbi.nlm.nih.gov/entrez/query.fcgi?cmd=Retrieve&db=PubMed&dopt=Citation&list_uids=17202590. The level of growth of each bacterium was graded using a qualitative assessment technique using the following criteria: 0, no growth; 1, very light growth (less than 10 cfu); 2, light growth (growth in the original inoculation zone only); 3, moderate growth (growth in the first streak line); and 4, heavy growth (growth in the second streak line or greater). All gradings were conducted in a blinded fashion AndreaM Stringer (AMS). This grading system had previously been validated in our laboratory using quality control organisms and sample organisms to ensure consistent results (Stringer et al. 2007).
Bacterial quantification
DNA was extracted from standard bacterial samples (Table 2) using a DNeasy Tissue Mini Kit (Qiagen, Doncaster UK). Briefly, bacteria were grown to log phase in nutrient broth. Cells were harvested by centrifugation for 10 min at 5000g. Gram-positive bacteria were lysed in enzymatic lysis buffer (20 mM of Tris-Cl, pH 8.0, 2 mM of sodium EDTA, 1.2% of Triton® X-100 and 20 mg/ml of lysozyme) at 37 °C, followed by proteinase K at 70 °C. Gram-negative bacteria were lysed in the provided buffer and proteinase K at 55 °C, followed by further lysis in the buffer at 70 °C. For both gram-positive and gram-negative bacteria, DNA was bound to the membrane in the provided spin column. The membrane was washed with two buffer solutions before DNA was eluted from the membrane into a centrifuge tube. DNA concentration was determined using a spectrophotometer (Eppendorf, North Ryde, NSW, Australia) and diluted to a final working concentration of 10 ng/μl.
Table 2.
Cross-reactivity and cycling details of primers used in this study
| Primer | Sequence | Other reactive organisms | Annealing temperature | Extension | Cycles | Product (bp) |
|---|---|---|---|---|---|---|
| Bacteroides (Layton et al. 2006) | F: 5′-GAGAGGAAGGTCCCCCAC-3′ R: 5′-CGCTACTTGGCTGGTTCAG-3′ | B. fragilis, all Bacteroides genus | 55 °C 15 s | 20 s | 50 | 106 |
| Bifidobacterium (Rinttila et al. 2004) | F: 5′-TCGCGTC(C/T)GGTGTGAAAG-3′ R: 5′-CCACATCCAGC(A/G)TCCAC-3′ | B. breve, B. bifidum, B. adolescentis, B. longum, B. minimum, B. angulatum, B. catenulatum, B. pseudocatenulatum, B. dentium, B. ruminatum, B. thermophilum, B. subtile, B. boum, B. animalis, B. choerinum, B. gallicum, B. pseudolongum, B. magnum, B. infantis, B. indicum, B. gullinarum, B. pullorum, B. saeculare, B. suis | 60 °C 50 s | 30 s | 45 | 243 |
| Clostridium (Rinttila et al. 2004) | F: 5′-ATGCAAGTCGAGCGA(G/T)G-3′ R: 5′-TATGCGGTATTAATCT(C/T)CCTTT-3′ | C. botulinum, C. perfringens, C. homoproprionicam, C. cadaveris, C. intestinalis, C. putrificum, C. novyi, C. sporogenes, C. tyrobutyricum, C. kluyveri, C. ljungdahlii, C. scatologenes, C. acetireducens, C. subterminale, C. esterheticum, C. argentinense, C. chauvoei, C. sardiniensis, C. paraputrificum, C. longisporum, C. septicum, C. cellulovorans, C. barati, C. absonum, C. carnis, C. butyricum, Eubacterium cudayi, Eubacterium nitritogens, Eubacterium moniliforme, Eubacterium multiforme | 50 °C 20 s | 30 s | 45 | 120 |
| Escherichia coli (Penders et al. 2005) | F: 5′-CATGCCGCGTGTATGAAGAA-3′ R: 5′-CGGGTAACGTCAATGAGCAAA-3′ | E. coli | 57 °C 15 s | 20 s | 45 | 95 |
| Lactobacillus (Rinttila et al. 2004) | F: 5′-AGCAGTAGGGAATCTTCCA-3′ R: 5′-CACCGCTACACATGGAG-3′ | L. acidophilus, L. amylovorus, L. delbruecki, L. amylolyticus, L acetotolerans, L. crispatus, L. amylophilus, L. johnsonii, L. gasseri, L. fermentum, L. pontis, L. reuteri, L. mucosae, L. vaginalis, L. panis, L. oris, L. pentosus, L. plantarum, L. collinoides, L. alimentarius, L. farciminis, L. brevis, L. buchneri, L. kefiri, L. fructivorans, L. mali, L. animalis, L. murinus, L. ruminis, L. agilis, L. salivarius, L. aviaruis, L. sharpeae, L. manihotivorans, L. rhamnosus, L. casei, L. zeae, L. sakei, Pediococcus pentosaceus, Pediococcus parvulus, Pediococcus acidilactici, Pediococcus dextrinicus, Weissella halotolerans, Weissella confusus, Weissella paramesenteroides, Weissella hellenica, Weissella viridescens, Weissella kandleri, Weissella minor, Leuconostoc lactis | 50 °C 20 s | 30 s | 45 | 341 |
| Staphylococcus [Sakai et al. 2004; ] | F: 5′-CAATGCCACAAACTCG-3′ R: 5′-GCTTCAGCGTAGTCTA-3′ | S. epidermidis, S. aureus, S. saprophyticus, S. cohnii, S. haemolyticus, S. hominis, S. lugdenensis, S. xylosus, S. wareni | 46 °C 8 s | 20 s | 68 | 462 |
Bold italics types denote the control organisms.
DNA was extracted from rat faecal samples using the QIAamp® DNA Stool Mini Kit (Qiagen, Doncaster, Australia). Briefly, a pellet of rat faeces was homogenized in lysis buffer and heated at 70 °C. The samples were centrifuged and the supernatant was collected in a centrifuge tube. Inhibitors were adsorbed to InhibitEX tablets before the samples were centrifuged again and the supernatant was collected. Proteins were digested with proteinase K and buffer. DNA was then bound to the membrane in the provided spin column. The membrane was washed with two wash buffers before DNA was eluted into a centrifuge tube. DNA concentration was determined using a spectrophotometer, and diluted to a final working concentration of 5 ng/μl.
Real-time polymerase chain reaction (PCR) was carried out on a Corbett Rotorgene 3000 rotary cycler (Corbett Research, Sfran California, USA). Primers used in this study have been used previously (Table 2). PCR mixtures consisted of 1× Quantitect® SYBR Green Mastermix (Qiagen), 2.5 ng/μl of each primer and 10 ng of DNA in a volume of 10 μl. The cycling parameters consisted of enzyme activation at 95 °C followed by cycles of melting at 95 °C for 15 s; annealing for the specified times and temperatures; and extension at 72 °C for a specified time (see Table 1 for all primer details). The SYBR green fluorescent signals were acquired at 72 °C. Standard curves were constructed from PCR reactions using 10-fold serial dilutions of known bacterial DNA. Data was analysed using the Rotor-Gene 6 software (Corbett Research).
Statistical analysis
Results were statistically analysed using a Mann–Whitney U-test. For multiplicity adjustments, the significance levels of the P-values were determined according to Bonferroni correction.
Results
Clinical signs
Diarrhoea occurred after irinotecan treatment as expected (Figure 1). Mild diarrhoea was seen in 23% of the rats from 0 to 24 h (early, cholinergic). This reduced to 6% at 48 h, before increasing at 72 h, with 28% of the rats experiencing mild diarrhoea, 5% with moderate diarrhoea and 6% with severe diarrhoea. There was a further increase at 96 h with 33% of the rats experiencing mild diarrhoea, 11% with moderate diarrhoea and 6% with severe diarrhoea. All diarrhoea was resolved by 120 h after irinotecan administration.
Figure 1.
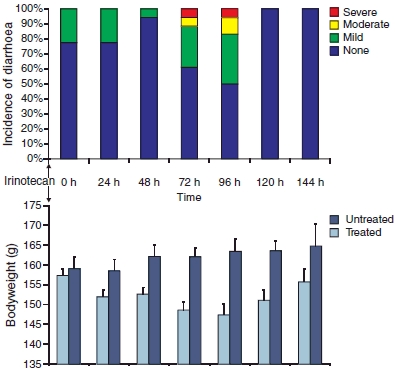
Clinical signs of mucositis. (a) Incidence of diarrhoea. An increased incidence of diarrhoea is evident from 72 to 96 h after irinotecan treatment. (b) Bodyweight. Mean bodyweight of treated rats is lower than that of untreated rats, with greatest difference between groups at 72–96 h after irinotecan treatment.
Untreated control rats gained weight gradually and consistently over the experimental period. Rats treated with irinotecan decreased in weight until 96 h, with significant differences between the control and treated rats at 48 h (P < 0.007), 72 h (P < 0.0007), 96 h (P < 0.002) and 120 h (P < 0.007). From 120 h, chemotherapy-treated rats gained weight (Figure 1).
Electrolytes
Rats treated with irinotecan exhibited altered electrolytes profiles compared with the control rats (Figure 2). Sodium and bicarbonate levels were decreased in treated rats 96 h after treatment. Potassium levels were higher in treated rats at all time points, and anion gap was raised 96 h after treatment. Osmolality levels were lower in treated rats at all time points investigated.
Figure 2.

Serum electrolyte analysis. Sodium and bicarbonate levels were decreased in treated rats 96 h after treatment. Potassium levels were higher in the treated rats at all time points, and anion gap was raised 96 h after treatment. Osmolality levels were lower in treated rats at all time points investigated.
Histology
Pathological changes were seen following irinotecan treatment in the jejunum and colon (Figure 3). The jejunum showed increased mitotic activity at 96 h, and occasional apoptotic bodies from 96 to 144 h. The colon showed considerable damage from 96 to 120 h, with patchy crypt degeneration, dilated crypts with attenuated epithelium and a few desquamated epithelial polymorphonuclear cells in the lumina. There was also evidence of increased hyperplasia and mitotic figures.
Figure 3.
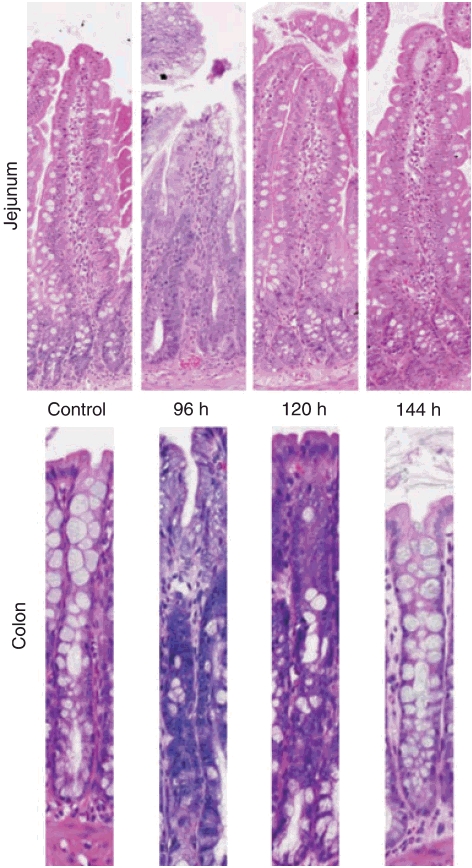
Histopathological changes seen in the jejunum and colon following treatment with irinotecan. The jejunum showed increased mitotic activity at 96 h, and occasional apoptotic bodies from 96 to 144 h. The colon showed considerable damage from 96 to 120 h, with patchy crypt degeneration, dilated crypts with attenuated epithelium and a few desquamated epithelial polymorphonuclear cells in the lumina. There was also evidence of increased hyperplasia and mitotic figures.
Goblet cells
Jejunum
The total number of goblet cells increased over time after irinotecan treatment, with a significant difference at 120 h (P < 0.004) and 144 h (P < 0.0125). The number of intact goblet cells did not alter significantly after treatment. However, the number of cavitated goblet cells increased over time, reaching significance at 96 h (P < 0.007) and 144 h (P < 0.0125), see Figure 4.
Figure 4.
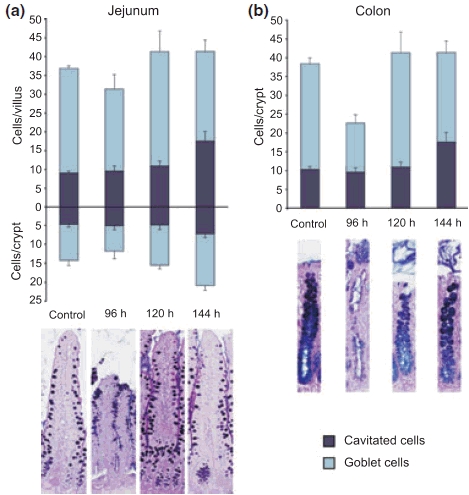
Alcian Blue-PAS staining and goblet cell counts in the (a) jejunum and (b) colon. Counts expressed as mean ± SD. The total number of goblet cells increased over time in the jejunum after irinotecan treatment. The total number of goblet cells in the colon decreased at 96 h.
Colon
The total number of goblet cells decreased significantly at 96 h (P < 0.0125). However, the numbers returned to control levels by 144 h. The number of intact goblet cells was significantly decreased at 96 h also (P < 0.007). The number of cavitated cells did not alter significantly, although the percentage of cavitated cells increased significantly at 96 h (P < 0.011).
MUC gene expression
MUC 1 expression did not alter significantly in the jejunum. There was a decrease in the number of MUC 1-positive cells in the crypts at 96 h; however, this number did not achieve significance. Like the jejunum, MUC 1 expression did not alter significantly in the colon. The expression of MUC 2 did not alter significantly in the jejunum or colon at any time point investigated. No significant changes to MUC 3 expression were detected in the jejunum at any time point investigated. MUC 3 was not expressed in the colon. MUC 4 expression was significantly decreased at 96 h in the jejunum villi (P < 0.004; Figure 5). However, expression in the jejunum crypts and colon was not significantly altered at any time point investigated. KLF 4-expressing cells were significantly reduced in the jejunum villi at 96 h (P < 0.0004) and 144 h (P < 0.0002). There were no changes in the jejunum crypts or colon.
Figure 5.
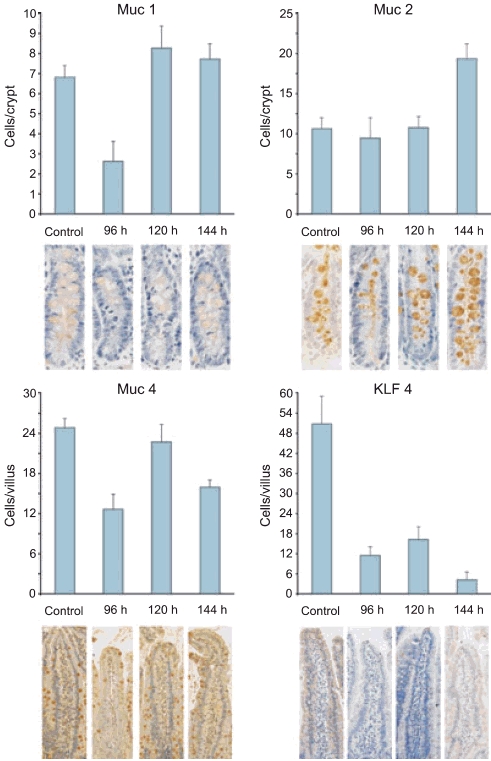
MUC gene immunostaining in the jejunum. (a) MUC 1 expression in the crypts. MUC 1 expression did not alter significantly in the jejunum. (b) MUC 2 expression in the crypts. The expression of MUC 2 did not alter significantly in the jejunum or colon at any time point investigated. (c) MUC 4 expression in the villi. MUC 4 expression was significantly decreased at 96 h in the jejunum villi. (d) KLF 4 expression in the villi. KLF 4-expressing cells were significantly reduced in the jejunum villi at 96 and 144 h.
Culture
Changes were seen in the bacteria of jejunum and colon of rats that received irinotecan. The majority of these changes were seen from 96 to 120 h after treatment. In the jejunum, there were increases in Escherichia spp. with a peak at 96 h, Clostridium spp. from 96 to 144 h and Staphylococcus spp. with a peak at 144 h. Changes were also seen in the colon with increases in Escherichia spp. from 96 to 144 h, Clostridium spp. with a small peak at 96 h, Enterococcus spp. from 120 to 144 h, Serratia spp. with a peak at 120 h and Staphylococcus spp. from 120 to 144 h (Figure 6).
Figure 6.

Qualitative microbiology results for the jejunum and colon. The majority of changes were seen from 96 to 120 h after treatment. In the jejunum, there were increases in Escherichia spp., Clostridium spp. and Staphylococcus spp. Changes were also seen in the colon with increases in Escherichia spp., Clostridium spp., Enterococcus spp., Serratia spp. and Staphylococcus spp.
Quantification of faecal flora
No significant changes were seen in the faecal flora of rats. However, E. coli (produces β-glucuronidase) peaked at 96 h, and Bifidobacterium spp. (beneficial intestinal function) decreased after treatment at all time points (Figure 7).
Figure 7.
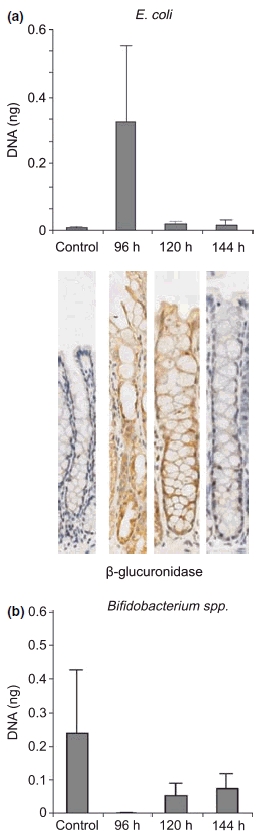
Quantitative real-time polymerase chain reaction results showing an increase in Escherichia coli and decrease in Bifidobacterium spp. after treatment. β-glucuronidase expression in the colon is also increased after treatment.
β-glucuronidase expression
Expression of β-glucuronidase was increased in the colon from 96 to 120 h after treatment, with sections demonstrating a clear increase in staining intensity (Figure 7). This increase was correlated with the incidence of severe diarrhoea and a peak in E. coli.
Discussion
Irinotecan-induced mucositis manifesting as diarrhoea is a severe dose-limiting side effect, with large cost to health services, and is often life-threatening (Elting et al. 2007). Several mechanisms have been proposed for the development of irinotecan-induced diarrhoea, ranging from changes in the architecture and absorption rates of the large intestine (Araki et al. 1993; Ikuno et al. 1995), to increases in intestinal β-glucuronidase levels caused by changes in the intestinal bacteria (Takasuna et al. 1996, 2006). The present study was unique in that it investigated a variety of changes, including gastrointestinal architecture, gastrointestinal microflora, intestinal mucins and serum electrolytes for the duration of delayed-onset mucositis and diarrhoea.
We have previously shown that there are significant differences in the levels of bacteria in rats receiving chemotherapy vs. chemotherapy-naïve rats in faecal samples at early time points (up to 72 h; Stringer et al. 2007; unpublished data). This study extends this work and demonstrates that E. coli increased in the gastrointestinal tract at late time points (up to 144 h) after treatment with irinotecan. Extensive histological changes were observed in the colon from 96 to 120 h, which correlates with the time of onset for delayed severe diarrhoea. The luminal environment in the colon is usually of a reduced nature, allowing the domination of anaerobes (Evaldson et al. 1982). An increase in oxygen levels allows the proliferation of aerobic bacteria, especially E. coli, which is a known producer of β-glucuronidase (Takasuna et al. 1996).
Increased β-glucuronidase expression was seen in the colon, with a considerable increase observed 96–120 h after treatment, again, correlating with moderate–severe late-onset diarrhoea. An increase in E. coli (which is known to produce β-glucuronidase) was observed 96 h following treatment. These findings are highly significant as they confirm for the first time that intestinal bacteria and β-glucuronidase expression are increased following irinotecan treatment, resulting in augmented toxicity from β-glucuronidase activity.
It is known that changes to the luminal environment of the GIT result in altered absorption and other functions (Geibel 2005). Changes to absorption are likely to alter the composition of the faecal excrement, including the composition of microflora present. The information from this study supports current theories (Takasuna et al. 1996), which suggests that the intestinal microflora play a fundamental role in the devlopment of chemotherapy-induced mucositis. In particular, the intestinal microflora that express β-glucuronidase activity play a key role in the characteristic late-onset diarrhoea observed following irinotecan (Stringer et al. 2008). Qualitative changes to the microflora after irinotecan treatment have been demonstrated previously, indicating changes to a variety of bacteria composing the intestinal microflora (Stringer et al. 2007). Changes to the luminal environment, and subsequent changes to absorption are likely to cause altered electrolyte levels after chemotherapy treatment (Stringer et al. 2007).
Previous studies using irinotecan in rats have looked at goblet cells and noted an increased presence of mucous at the apical surface of the intestine (Gibson et al. 2003; Bowen et al. 2007). This study has characterized goblet cell changes after irinotecan treatment, and also extends previous studies by showing increased goblet cells in the jejunum after treatment (with increased cavitated cells, indicating an accelerated increase in mucin secretion). There is a decrease in the number of goblet cells after treatment in the colon. Decreased goblet cells indicate release of mucins from the mucosal surface, and cavitation of mucous cells is a sign of accelerated mucous secretion by compound exocytosis (Barcelo et al. 2000). Both the increase in cavitated cells in the jejunum and decrease in normal goblet cells in the colon correlate with the incidence of diarrhoea, indicating accelerated mucous secretion in the jejunum, and mucin release in the colon may be contributing to the diarrhoea. Cells expressing MUC 4 were decreased significantly in the jejunum at 96 h, corresponding with the increased cavitated cells, suggesting that mucous secreted may consist of MUC 4 mucins.
These results now provide a target for further research into therapeutic developments for treatment and/or prevention of chemotherapy-induced diarrhea (CID). Takasuna et al. (2006) have already explored the relationship between antibiotics and the β-glucuronidase inhibitor, baicalin, with mixed results. Probiotics are known to exert beneficial effects to the host when ingested, and therefore could be useful in controlling the intestinal microflora during chemotherapy (Quigley 2007). We have previously shown that VSL#3 is able to reduce the severity and duration of CID in rats (Bowen et al. 2007). Further research into the role that probiotics could play in ameliorating CID should also be explored. The role of anti-secretory agents may also prove to be of use in averting excessive mucous secretion. The aim now is to determine if the same effects on the microflora and mucins are seen in the clinical setting, in patients with CID following irinotecan treatment, allowing translation from animal studies to the oncology clinic.
In conclusion, irinotecan-induced diarrhoea may be caused by an increase in some β-glucuronidase-producing bacteria, especially E. coli, exacerbating the toxicity of active metabolites. Accelerated mucous secretion and mucin release may also contribute to delayed-onset diarrhoea.
Acknowledgments
The authors gratefully acknowledge Dr J. Finnie for expert histopathological advice. This project was supported by a research grant awarded by the Cancer Council SA. Dr Rachel Gibson was supported by a Cancer Council South Australia Research Fellowship; Ms. Andrea Stringer and Ms. Ann Yeoh were supported by NHMRC postgraduate scholarships. Prof. Dorothy Keefe is the Cancer Council SA Professor of Cancer Medicine.
References
- Araki E, Ishikawa M, Iigo M, Koide T, Itabashi M, Hoshi A. Relationship between development of diarrhea and the concentration of SN-38, an active metabolite of CPT-11, in the intestine and the blood plasma of athymic mice following intraperitoneal administration of CPT-11. Jpn. J. Cancer Res. 1993;84:697–702. doi: 10.1111/j.1349-7006.1993.tb02031.x. [DOI] [PMC free article] [PubMed] [Google Scholar]
- Armand JP, Ducreux M, Mahjoubi M, et al. CPT-11 (irinotecan) in the treatment of colorectal cancer. Eur. J. Cancer. 1995;31A:1283–1287. doi: 10.1016/0959-8049(95)00212-2. [DOI] [PubMed] [Google Scholar]
- Barcelo A, Claustre J, Moro F, Chayvialle JA, Cuber JC, Plaisancie P. Mucin secretion is modulated by luminal factors in the isolated vascularly perfused rat colon. Gut. 2000;46:218–224. doi: 10.1136/gut.46.2.218. [DOI] [PMC free article] [PubMed] [Google Scholar]
- Bowen JM, Stringer AM, Gibson RJ, Yeoh AS, Hannam S, Keefe DM. VSL#3 probiotic treatment reduces chemotherapy-induced diarrhea and weight loss. Cancer Biol. Ther. 2007;6:1449–1454. doi: 10.4161/cbt.6.9.4622. [DOI] [PubMed] [Google Scholar]
- Brandi G, Dabard J, Raibaud P, et al. Intestinal microflora and digestive toxicity of irinotecan in mice. Clin. Cancer Res. 2006;12:1299–1307. doi: 10.1158/1078-0432.CCR-05-0750. [DOI] [PubMed] [Google Scholar]
- Elting LS, Cooksley CD, Chambers MS, Garden AS. Risk, outcomes, and costs of radiation-induced oral mucositis among patients with head-and-neck malignancies. Int. J. Radiat. Oncol. Biol. Phys. 2007;68:1110–1120. doi: 10.1016/j.ijrobp.2007.01.053. [DOI] [PubMed] [Google Scholar]
- Evaldson G, Heimdahl A, Kager L, Nord CE. The normal human anaerobic microflora. Scand. J. Infect. Dis. Suppl. 1982;35:9–15. [PubMed] [Google Scholar]
- Geibel JP. Secretion and absorption by colonic crypts. Annu. Rev. Physiol. 2005;67:471–490. doi: 10.1146/annurev.physiol.67.031103.153530. [DOI] [PubMed] [Google Scholar]
- Gibson RJ, Bowen JM, Inglis MR, Cummins AG, Keefe DM. Irinotecan causes severe small intestinal damage, as well as colonic damage, in the rat with implanted breast cancer. J. Gastroenterol. Hepatol. 2003;18:1095–1100. doi: 10.1046/j.1440-1746.2003.03136.x. [DOI] [PubMed] [Google Scholar]
- Gibson RJ, Bowen JM, Keefe DM. Palifermin reduces diarrhea and increases survival following irinotecan treatment in tumor-bearing DA rats. Int. J. Cancer. 2005;116:464–470. doi: 10.1002/ijc.21082. [DOI] [PubMed] [Google Scholar]
- Gibson RJ, Stringer AM, Bowen JM, et al. Velafermin improves gastrointestinal mucositis following irinotecan treatment in tumor-bearing DA rats. Cancer Biol. Ther. 2007;6:541–547. doi: 10.4161/cbt.6.4.3848. [DOI] [PubMed] [Google Scholar]
- Ikuno N, Soda H, Watanabe M, Oka M. Irinotecan (CPT-11) and characteristic mucosal changes in the mouse ileum and cecum. J. Natl. Cancer Inst. 1995;87:1876–1883. doi: 10.1093/jnci/87.24.1876. [DOI] [PubMed] [Google Scholar]
- Layton A, McKay L, Williams D, Garrett V, Gentry R, Sayler G. Development of Bacteroides 16S rRNA gene TaqMan-based real-time PCR assays for estimation of total, human, and bovine fecal pollution in water. Appl. Environ. Microbiol. 2006;72:4214–4224. doi: 10.1128/AEM.01036-05. [DOI] [PMC free article] [PubMed] [Google Scholar]
- Logan RM, Gibson RJ, Bowen JM, Stringer AM, Sonis ST, Keefe DM. Characterisation of mucosal changes in the alimentary tract following administration of irinotecan: implications for the pathobiology of mucositis. Cancer Chemother. Pharmacol. 2007a;62:33–41. doi: 10.1007/s00280-007-0570-0. [DOI] [PubMed] [Google Scholar]
- Logan RM, Stringer AM, Bowen JM, et al. The role of pro-inflammatory cytokines in cancer treatment-induced alimentary tract mucositis: pathobiology, animal models and cytotoxic drugs. Cancer Treat. Rev. 2007b;33:448–460. doi: 10.1016/j.ctrv.2007.03.001. [DOI] [PubMed] [Google Scholar]
- Penders J, Vink C, Driessen C, London N, Thijs C, Stobberingh EE. Quantification of Bifidobacterium spp., Escherichia coli and Clostridium difficile in faecal samples of breast-fed and formula-fed infants by real-time PCR. FEMS Microbiol. Lett. 2005;243:141–147. doi: 10.1016/j.femsle.2004.11.052. [DOI] [PubMed] [Google Scholar]
- Quigley EM. Probiotics in the management of colonic disorders. Curr. Gastroenterol. Rep. 2007;9:434–440. doi: 10.1007/s11894-007-0055-7. [DOI] [PubMed] [Google Scholar]
- Rinttila T, Kassinen A, Malinen E, Krogius L, Palva A. Development of an extensive set of 16S rDNA-targeted primers for quantification of pathogenic and indigenous bacteria in faecal samples by real-time PCR. J. Appl. Microbiol. 2004;97:1166–1177. doi: 10.1111/j.1365-2672.2004.02409.x. [DOI] [PubMed] [Google Scholar]
- Sakai H, Procop GW, Kobayashi N, et al. Simultaneous detection of Staphylococcus aureus and coagulase-negative staphylococci in positive blood cultures by real-time PCR with two fluorescence resonance energy transfer probe sets. J. Clin. Microbiol. 2004;42:5739–5744. doi: 10.1128/JCM.42.12.5739-5744.2004. [DOI] [PMC free article] [PubMed] [Google Scholar]
- Smith NF, Figg WD, Sparreboom A. Pharmacogenetics of irinotecan metabolism and transport: an update. Toxicol In Vitro. 2006;20:163–175. doi: 10.1016/j.tiv.2005.06.045. [DOI] [PubMed] [Google Scholar]
- Stringer AM, Gibson RJ, Logan RM, et al. Chemotherapy-induced diarrhea is associated with changes in the luminal environment in the DA rat. Exp. Biol. Med. (Maywood) 2007;232:96–106. [PubMed] [Google Scholar]
- Stringer A, Gibson R, Logan R, Bowen J, Yeoh A, Keefe D. Faecal microflora and β-glucuronidase expression are altered in an irinotecan-induced diarrhoea model in rats. Cancer Biol. Ther. 2008;7:1919–1925. doi: 10.4161/cbt.7.12.6940. [DOI] [PubMed] [Google Scholar]
- Takasuna K, Hagiwara T, Hirohashi M, et al. Involvement of beta-glucuronidase in intestinal microflora in the intestinal toxicity of the antitumor camptothecin derivative irinotecan hydrochloride (CPT-11) in rats. Cancer Res. 1996;56:3752–3757. [PubMed] [Google Scholar]
- Takasuna K, Hagiwara T, Watanabe K, et al. Optimal antidiarrhea treatment for antitumor agent irinotecan hydrochloride (CPT-11)-induced delayed diarrhea. Cancer Chemother. Pharmacol. 2006;42:1–10. doi: 10.1007/s00280-006-0187-8. [DOI] [PubMed] [Google Scholar]
- Tryland I, Fiksdal L. Enzyme characteristics of beta-d-galactosidase- and beta-d-glucuronidase-positive bacteria and their interference in rapid methods for detection of waterborne coliforms and Escherichia coli. Appl. Environ. Microbiol. 1998;64:1018–1023. doi: 10.1128/aem.64.3.1018-1023.1998. [DOI] [PMC free article] [PubMed] [Google Scholar]