

Abstract
The relationship between the bone mass loss and bone marrow haematopoiesis in osteoporosis remains obscure. We selected 3-month-old female Sprague–Dawley rats and randomly divided them into six groups. Three groups were ovariectomized (OVX), while the other three groups were sham operated (Sham). Four, 8 and 12 weeks after the surgical procedure, the rats were euthanized and sampled. The left femur was used for measurement of bone mineral density (BMD). The right femur distal metaphysic cancellous bone was processed for morphological evaluation. Our results showed that the femur BMD in the 4-week OVX group was not significantly decreased compared with that of the 4-week Sham group, but that the volume of adipose tissue in the bone marrow was markedly increased. The femur BMD in the 8-week OVX group was decreased significantly compared with that of the 8-week Sham group (P < 0.05). Meanwhile, the volume of haematopoietic tissue decreased and the volume of adipose tissue increased. The number of megakaryocytes was decreased (P < 0.05). Interestingly, the osteoclasts and mast cells were increased in number in the 8-week OVX group (P < 0.05). These changes became obvious in the 12-week OVX rats, in contrast to the Sham groups. The volume of trabecular bone and the number of osteoblasts in the 12-week OVX group decreased significantly. Increased reticulin fibres were observed only in the 12-week OVX group. Our studies demonstrated a reciprocal correlation between bone-forming osteoblasts and marrow adipose tissue and suggest that OVX rats may be valuable as an animal model to study hypohaemopoiesis.
Keywords: bone marrow pathology, bone mineral density, haematopoiesis, osteoporosis, ovariectomized rats
Osteoporosis is a skeletal disorder characterized by compromised bone strength that increases the risk of fracture (NIH consensus development panel 2001). The incidence of osteoporosis is higher among postmenopausal women, whose oestrogen levels are naturally lowered. Recently, the relationship between osteoporosis and anaemia was investigated, and a hypothesis was formulated that the development of osteoporosis in postmenopausal women was not due to the reduction of oestrogen levels, as, in men, who have never been protected by high levels of oestrogen, osteoporosis in senescence is significantly less frequent than in the females. Blood loss intensifies proliferation of haematopoietic progenitor cells and increases the number of haematopoietic cells, including osteoclasts, thus intensifying resorption of bone tissue and extension of haematopoietic territories. Haematological diseases accompanied by chronic anaemia, such as beta thalassaemia major, sickle cell anaemia, chronic haemolytic anaemia, pernicious anaemia, etc., are also characterized by the concomitant development of osteoporosis (Gurevitch & Stavin 2006). A recent study on BMD and erythropoiesis in 46 Thai children and adolescents with thalassaemia syndromes revealed that BMD levels were negatively correlated with sTfR levels, but positively correlated with haemoglobin levels (Mahachoklertwattana et al. 2006). Studies by other researches have also suggested that a decrease in bone marrow volume associated with osteoporosis and age-related osteopenia is accompanied by an increase in marrow adipose tissue (Meunier et al.1971; Martin & Zissimos 1991; Nuttall & Gimble 2000). Thus far, the relationship between the changes in BMD and bone marrow haematopoietic tissue remains unclear. In this study, we used the OVX rat as an animal model to examine the bone marrow pathology and to explore the relationship between the changes in BMD and the bone marrow haematopoiesis during the development of osteoporosis. Our results revealed that during the development of osteoporosis, the number of normal osteoblasts is reduced in conjunction with decreased haematopoietic cells and increased adipocytes.
Materials and methods
All procedures were approved by the Institutional Animal Care and Use Committee of Zhe Jiang Chinese Medical University and complied with the National Institutes of Health Guide for the Care and Use of Laboratory Animal.
Animals and groups
Thirty 3-month-old female Sprague–Dawley rats (Shanghai Experimental Animal Center of Chinese Academy of Sciences, Shanghai, China, Certificate: SCXK (shanghai) 2007-0005), weighing 253–299 g, were randomly assigned to six groups: (i) 4-week Sham (n= 5), (ii) 8-week Sham (n= 5), (iii) 12-week Sham (n= 5), (iv) 4-week OVX (n= 5), (v) 8-week OVX (n= 5) and (vi) 12-week OVX (n= 5) at the beginning of the study. On the day of surgery, all rats were anesthetized with an intraperitoneal injection of 3% pentobarbital sodium (1.5 ml/kg body weight). For ovariectomy, bilateral dorsal incisions were made on the back of the rat under sterile conditions after anaesthesia. Both of the ovaries were identified, the blood vessels were clamped and tied off, and the ovaries were removed. The sham operation was performed following the steps described earlier with the visualization of the ovaries but without clamping or removing of the tissue. After surgery, the rats were housed, one per cage, in a room with a 12 h–12 h light–dark cycle. The rats were fed 15 g/day of a rodent diet containing 0.3% calcium, as recommended by Sims et al. 1996, to prevent weight gain in OVX rats. The Sham and OVX rats were killed with an anaesthetic overdose by intraperitoneal injection of 3% pentobarbital sodium at 4, 8 and 12 weeks post operation.
Tissue slice preparation
The right femur distal metaphysic cancellous bone was obtained and fixed in 10% formalin and decalcified for 14 days in 10% buffered EDTA (pH 7.0). The samples were then dehydrated and embedded in paraffin. Slices (4-μm thick) were then obtained from the paraffin section and stained with haematoxylin–eosin (H–E) for bone marrow pathological examination. Toluidine Blue stain (pH 3.8) and Gomorin stain were used for identification of mast cells and reticulin fibres respectively.
Femur BMD measurement
The left femur from each rat was harvested with a trace amount of surrounding soft tissues and immersed in 0.9% saline solution. BMD levels of the femora were measured with a dual-energy X-ray absorptiometer (DEXA; LUNAR Radiation, Madison, WI, USA) using the small-animal programme.
Indices observed in bone marrow sections
The cellularity of the bone marrow sections was determined by using eye-piece graticules and observing under a high-power (10 × 40) light microscope. Sixteen fields were selected at random, and 100 hit targets were recorded on each of the fields. For example, haematopoietic tissue, adipose tissue or trabecular bone was counted and expressed as a percentage of the total number of possible hits. The boundary tissue was counted in a 50/50 ratio until 1600 hits had been made to obtain an accurate estimate of the true amount of total tissue. The volume of haematopoietic tissue was then calculated as (Revell 1983):
We defined a normal cellularity as ≥55%, whereas values of 54–35% indicated a decreased cellularity. Cases with a cellularity <35% were considered to have a markedly decreased cellularity. For megakaryocytes, we counted the total number of megakaryocytes in the whole section, using the object micrometre (0.01 mm × 100) to correct the eye-piece graticules’ area, and obtained that per area is 0.125 mm × 0.125 mm = 0.156 mm2. Then we measured the area of the sample using the eye-piece graticules, and calculated the number of megakaryocytes per square millimetre (Pu & Yang 2002). To estimate the number of osteoblasts and osteoclasts, we randomly selected six fields (10 × 40) to count the number of osteoblasts and osteoclasts (Li et al. 2005). Toluidine Blue stain was used for evaluating the mast cells. The total number of mast cells was estimated in the whole section, the sample area was measured using eye-piece graticules and the number of mast cells per square millimeter was calculated. The reticulin content was determined based on the Manoharan meliorate method (Pu & Yang 2002). These observations and determinations were independently performed by two pathologists.
Statistical analysis
Statistics analysis was performed using spss 11.5. The results are expressed as the mean ± standard deviation (SD). One way analysis of variance (anova) was used to compare mean values among the groups and Student’s t-test was used for the comparison of the two groups. Correlation analysis was performed between the BMD and the haematopoietic tissue volume or adipose tissue volume, and between the haematopoietic tissue volume and the numbers of osteoblasts or osteoclasts. P-values <0.05 were considered to be statistically significant.
Results
Changes in femur BMD levels
There was a significant decrease in femur BMD in 8-week OVX rats compared with that of the 8-week Sham rats (t = 2.705, P< 0.05, Table 1), which supported that the osteoporosis model has been established.
Table 1.
The changes in BMD and bone marrow pathology haematopoietic indices
| BMD(g/mm2) |
Volume of haematopoietic tissue (%) |
Volume of adipose tissue (%) |
Volume of trabecular bone (%) |
Megakaryocyte number (/mm2) |
||||||||
|---|---|---|---|---|---|---|---|---|---|---|---|---|
| Group | n | Mean ± SD | P | Mean ± SD | P | Mean ± SD | P | Mean ± SD | P | Mean ± SD | P | |
| 1 | Sham4w | 5 | 0.199 ± 0.013 | 0.750 | 60.30 ± 4.22 | 0.116 | 14.30 ± 2.64 | 0.008 | 25.10 ± 1.85 | 0.224 | 36.50 ± 2.15 | 0.091 |
| 2 | OVX4w | 5 | 0.196 ± 0.024 | 53.60 ± 7.38** | 24.20 ± 5.69** | 23.20 ± 2.64 | 32.90 ± 3.59 | |||||
| 3 | Sham8w | 5 | 0.198 ± 0.017 | 0.034 | 61.20 ± 6.17 | 0.006 | 14.50 ± 4.90 | 0.001 | 24.30 ± 3.55 | 0.964 | 40.00 ± 5.29 | 0.014 |
| 4 | OVX8w | 5 | 0.156 ± 0.031*** | 43.20 ± 8.74** | 32.30 ± 6.72** | 24.40 ± 3.29 | 30.60 ± 4.11 | |||||
| 5 | Sham12w | 5 | 0.203 ± 0.014 | 0.002 | 58.70 ± 1.40 | 0.000 | 14.40 ± 2.68 | 0.000 | 26.90 ± 2.51 | 0.001 | 40.80 ± 4.22 | 0.001 |
| 6 | OVX12w | 5 | 0.159 ± 0.017*** | 33.00 ± 3.39** | 46.00 ± 3.08** | 21.00 ± 1.22*,*** | 28.30 ± 3.55 | |||||
vs. group 4, P < 0.05;
compared with each other, P < 0.01;
vs. group 2, P < 0.05.
Changes in bone marrow cellularity
The volume of adipose tissue was increased in the 4-week OVX group and more obviously in the 8-week OVX group. In contrast, the volume of haematopoietic tissue was significantly decreased in the 8-week OVX group, compared with that observed in the Sham group. Changes in adipose tissue and haematopoietic tissue were more significant in the 12-week OVX group (Table 1, Figure 1). In the 8-week and 12-week OVX groups, the megakaryocytes were significantly decreased compared with that in the corresponding Sham groups (t= 3.136, 5.069, P < 0.05, Table 1).
Figure 1.
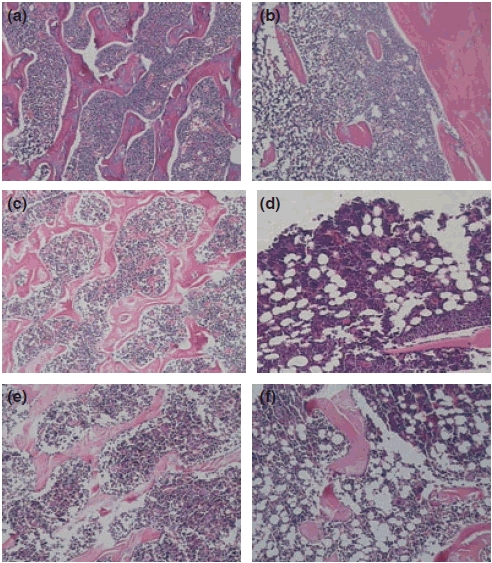
Changes in haematopoietic tissue in OVX rats (H–E stain, 10 × 10). (a), (c) and (e) correspond to bone marrow sections of Sham rats at 4, 8 and 12 weeks and show the hypercellularity and sporadic scattered adipose tissue; (b), (d) and (e) correspond to the bone marrow of OVX rats at 4, 8 and 12 weeks and show the hypocellularity and the increase in adipose tissue. (e) The trabecular bone was arranged regularly with a dense network in Sham rats at 12 weeks; f, volume of decreased trabecular bone and increased free trabecular ends.
Changes in quality and morphology of trabecular bone
The trabecular bone from rats in the Sham groups exhibited a normal arrangement pattern with a thick and dense network with minimal spaces. In the OVX groups, the trabecular bone was thinner and the network structure was severely disrupted and fragmented. Some of the interspaces between the trabecular bones were expanded in size. There was a decrease in the number of trabeculae and an increase in the number of free ends in OVX rats (Table 1, Figure 1e,f).
Correlation between the BMD and the volumes of haematopoietic or adipose tissues
There was a positive correlation between the volume of the haematopoietic tissue and the BMD (r = 0.627, P < 0.01) and a negative correlation between the volume of adipose tissue and the BMD (r = −0.606, P < 0.01).
Morphological changes in bone marrow interstitial substance
In the 8-week OVX rats, some morphological changes in bone marrow interstitial substance, such as reduction of marrow sinusoids, and bleeding, metamorphic of adipose cells and reticular fibres were frequently seen (Figure 2b). Such changes were not observed in the corresponding Sham rats (Figure 2a).
Figure 2.
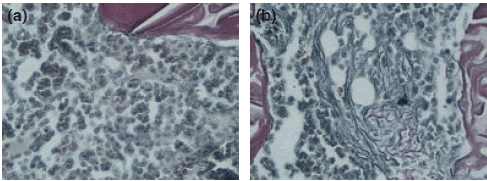
Changes in the reticulin fibres in the 12-week Sham and OVX rats (Gomori stain, 10 × 40). (a) The reticulin fibres were not increased in bone marrow in 12-week Sham group; (b) an increase of reticulin fibres in local bone marrow volumes in 12-week OVX group of rats.
Changes in the number of osteoclasts, osteoblasts and mast cells
A significant increase in the number of osteoclasts in 8-week OVX rats was observed compared with that in 8-week Sham rats (t = −2.746, P < 0.05, Table 2). The number of mast cells, which were commonly distributed in areas adjacent to the trabeculae and lymph follicle, was also increased when compared with that of the Sham rats (t = −2.910, P < 0.05, Table 2, Figure 4). In 12-week OVX rats, the number of osteoblasts was significantly decreased compared with that of the Sham group (t = 4.227, P < 0.05, Table 2, Figure 3). Apparently, ovariectomy correlated with a increase in bone marrow mast cells in the 8- and 12-week OVX groups (P < 0.05, Table 2, Figure 4).
Table 2.
The changes in the number of osteoblasts, osteoclasts and mast cells
| Osteoblast number |
Osteoclast number |
Mast cells number (/mm2) |
||||||
|---|---|---|---|---|---|---|---|---|
| Group | n | Mean ± SD | P | Mean ± SD | P | Mean ± SD | P | |
| 1 | Sham4w | 5 | 6.60 ± 1.19 | 0.686 | 1.40 ± 0.55 | 0.074 | 11.10 ± 2.88 | 0.317 |
| 2 | OVX4w | 5 | 7.10 ± 2.38* | 2.00 ± 0.35 | 13.20 ± 3.33* | |||
| 3 | Sham8w | 5 | 8.00 ± 1.58 | 0.379 | 1.50 ± 0.35 | 0.027 | 14.00 ± 1.54 | 0.020 |
| 4 | OVX8w | 5 | 7.10 ± 1.47* | 2.20 ± 0.45 | 18.10 ± 2.75* | |||
| 5 | Shaw12w | 5 | 7.20 ± 0.76 | 0.002 | 1.00 ± 0.79 | 0.002 | 13.60 ± 2.70 | 0.022 |
| 6 | OVX12w | 5 | 5.10 ± 0.74* | 2.90 ± 0.55 | 19.20 ± 3.47* | |||
Compared with each other, P < 0.05.
Figure 4.
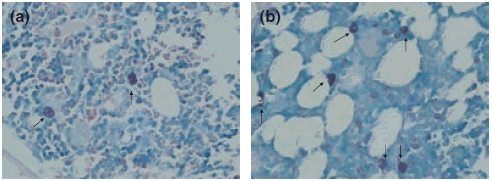
Changes in the mast cells in the 8-week Sham and OVX rats (Toluidine Blue stain, 10 × 40). (a) Few mast cells (arrowheads) were observed in the bone marrow in Sham rats, and those observed were scattered in the marrow; (b) the mast cells (arrowheads) were increased in number as well as in granularity in the OVX rat marrow.
Figure 3.
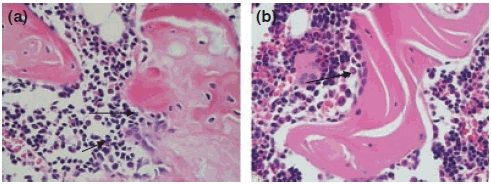
Changes in the osteoclasts and osteoblasts in the 12-week Sham and OVX rats (H–E stain, 10 × 10). (a) The number of osteoclasts (arrowheads) was increased in the bone marrow in OVX rats; (b) the osteoblasts (arrowheads) were easily observed in the bone marrow of Sham rats.
Correlation between the volume of haematopoietic tissue and the numbers of osteoblasts or osteoclasts
There was a positive correlation between the volume of haematopoietic tissue and osteoblasts (r = 0.506, P < 0.01) and a negative correlation between the volume of haematopoietic tissue and osteoclasts (r = −0.649, P < 0.01).
Discussion
The ovariectomized rat is a widely used animal model for osteoporosis research in the medical field. In rats, the genital gland and endocrine system reach maturity at the age of 3 months, at which time the body’s muscles and skeleton are well formed. From ages 3 to 6 months, the growth of the skeleton slows down and the bones gradually become susceptible to osteoporosis (Kalu et al.1989; Fujimoto et al.1998). To unveil the relationship between changes in BMD and bone marrow haematopoiesis in adult animals suffering from osteoporosis, we chose 3-month-old rats as experimental models. Several previous studies showed that in rats, oestrogen levels decreased precipitously accompanied by bone mass loss following ovariectomy. There was a remarkable decrease in bone mass in 4-week OVX rats, and a typical osteoporosis profile could be identified in 8-week OVX rats (Jin et al.2003; Xie et al.2006). The BMD measurement, performed using a dual-energy X-ray absorptiometer, is a generally accepted method for the diagnosis of osteoporosis (Kanis et al.1994). We defined a BMD index to evaluate the degree of osteoporosis and combined this observation with the bone marrow pathological examination to observe the bone marrow haematopoiesis. Our results from this study demonstrated that OVX rats developed imaging feature of osteoporosis 8 weeks after ovariectomy. The femur BMD and the number of osteoblasts were significantly decreased, and the number of osteoclasts increased noticeably in the 12-week OVX group compared with that of the Sham group. These changes supported that the osteoporosis model was established successfully. Although results from a previous study implied that in rats, adipogenesis ability increases as age increases (Chen et al. 2003), no significant changes were observed in BMD levels in the femur or bone marrow in the 3-month-old rats (Sham group) during our studies.
To clarify haematopoiesis in OVX rats, we investigated the bone marrow pathological changes at different time points after ovariectomy. We found that before the BMD significantly decreased, there was a significant increase in adipose tissue in the 4-week OVX group, in contrast to a significant increase in adipose tissue and decrease in haematopoietic tissue/megakaryocytes in the 8-week OVX group. These changes became even more evident in the 12-week OVX group. In addition, there was a positive correlation between the BMD changes and the volume of haematopoietic tissue, as well as a negative correlation between the BMD changes and the volume of adipose tissue. These results were consistent with our notion that there was an inter-relationship between osteoporosis and haematopoiesis. In 12-week OVX rats, we also found the trabecular bones were very thin and the network structure had undergone severe damage, with some of the interspaces widened, which was in agreement with the observations reported previously by Ju et al. (2007) and Shen et al. (2006). In addition, some changes in the interstitial substance in OVX rats were observed, which included reduction of marrow sinusoids and a mild increase in the reticular fibres, which was commonly seen in patients with aplastic anaemia.
What causes the increase in the volume of adipose tissue and the decrease in haematopoietic tissue in the bone marrow of OVX rats suffering from osteoporosis? Are these observations related to the decrease in the number of osteoblasts and the increase in the number of osteoclasts? Oestrogens play a critical role in bone metabolism. Decreased oestrogens enhance bone turnover and accompany a shift in the adipocyte to osteoblast ratio, which favours fat tissue production in the bone marrow (Gambacciani et al. 1997; Justesen et al. 2001). Many studies have reported that marrow adipocytes share a common mesenchymal stem cell (MSC) with bone-forming osteoblasts and that MSCs have the ability to give rise to a variety of differentiated cell types, such as osteoblasts, chondrocytes, adipocytes, myocytes, etc. (Pittenger et al.1999; Owen 2003). A balanced MSC differentiation into adipocytic and osteogenic cells maintains the balance of marrow adipocytes and osteoblasts (Beresford et al.1992). Two in vitro studies in mouse bone marrow stromal ST2 cell lines (Okazaki et al. 2002) and hMSCs (Heim et al. 2004) reported reciprocal regulation of osteoblastic and adipocytic differentiation from a common progenitor cell population by oestrogen. Our study showed that after ovariectomy, adipogenesis ability was increased, resulting in a decrease in the number of osteoblasts. With the time after ovariectomy increased, these changes became more obvious. These findings indicated that loss of oestrogen would promote differentiation of MSCs into adipocytes and inhibit osteoblasts differentiation. Reduced osteoblasts number might be expected after ovariectomy as a consequence of ageing, as shown in the SAMP6 murine model of accelerated senescence where it was accompanied also by a reduced osteoclastogenesis (Jilka et al. 1996). In the 3–6 months old OVX rats, loss of oestrogen usually accelerates bone remodelling with a predominance of bone resorption over bone formation, and higher resorption and formation activities were observed in the OVX group compared with the Sham group (Jilka et al. 1998; Bonnet et al. 2008). Different results were obtained on the number of osteoblasts in OVX rats. Wronski et al. reported that bone loss was associated with elevated histomorphometric indices of bone resorption and formation. Ovariectomy increased osteoclast surface and numbers as well as osteoblast surface and numbers at 5 weeks postovariectomy (Wronski et al. 1985). Wang’s findings were in line with ours, showing a decreased number of osteoblasts in the marrow of OVX rats (Wang et al. 2006). The precise reason for the discrepancy is not clear; it may be attributable to differences in experimental models or observation sites. Recent publications have highlighted that osteoblastic cells represent a regulatory component of the bone marrow microenvironment and that the number of osteoblastic cells directly correlates with the number of haematopoietic stem cell (Calvi et al. 2003; Zhang et al. 2003). The decrease in the number of osteoblasts may also affect the haematopoietic microenvironment and result in compromised haematopoietic function. Visnjic et al. provided the evidence that the elimination of osteoblasts profoundly affects adult haemtopoiesis in vivo experimental system. They found that osteoblast ablation leads to a termination of haematopoietic stem cells differentiation in the bone marrow in conjunction with the establishment of an active process of extramedullary haematopoiesis, and the absence of osteoblasts progressively affected the progenitor pool by blocking the progression of bone marrow haematopoiesis (Visnjic et al. 2004). In this study, we found that there was a positive correlation between the volume of haematopoietic tissue and the number of osteoblasts, which suggested that the reduced number of osteoblasts would affect the bone marrow haematopoiesis. It is well documented that osteoclasts are regulated by osteoblasts during development and during bone remodelling processes (Udagawa et al. 1999; Wagner & Karsenty 2001) and oestrogen deficiency is associated with an increased number of osteoclast precursor cells in the murine models’ marrow (Jilka et al. 1992). In our studies, we found that during the development of osteoporosis, a significant increase in the number of osteoclasts was accompanied by a decrease in the volume of haematopoietic tissue, and there was a negative correlation between the volume of haematopoietic tissue and the number of osteoclasts, which was contrary to that reported by Gurevich & Stavin (Gurevitch & Stavin 2006). Maybe it was due to the different causes of development of osteoporosis.
In this study, we made an interesting observation that ovariectomy led to a dramatic increase in the number of bone marrow mast cells (P < 0.05), which might be involved in the pathogenesis of OVX-induced bone loss. Mast cells appear to be relevant in the pathogenesis of bone turnover. Their deficiency has been associated with low remodelling states, while their excess is associated with accelerated bone loss (Chiappetta & Gruber 2006). Lesclous and Saffar (1999) reported that mast cells accumulated concomitantly with osteoclast generation in oestrogen-deficient rats. Oestrogen deletion directly impacts mast cells, resulting in their activation and subsequent release of biological mediators, such as cytokines (GM-CSF, IL-1, IL-3, IL-6, TNF-α, TGF-β), histamine and heparin (Theoharides 1996; Metcalfe et al. 1997). Histamine and heparin increased bone resorption by inhibiting osteoprotegerin activity (Lesclous et al. 2006; Irie et al. 2007). Moreover, TGF-β also increased bone resorption (Lerner 1996). In fact, the secretion of cytokines, such as IL-1, IL-6 and TNF-α, was increased in the bone marrow of menopausal women (Pfeilschifter et al. 2002). However, the relationship between the function of mast cells and the haematopoietic process remains unknown.
In conclusion, our results revealed a series of complex events that occurred after ovariectomy: a progressive loss of BMD accompanied by a decrease in the volume of haematopoietic tissue and an increase in volume of adipose tissue. Certain morphological features in the bone marrow sections reflected those seen in the aplastic anaemia. We speculate that the decrease in osteoblasts and the increase in adipocytes are the key to the decrease in haematopoiesis. If this is the case, proper control of the pathway of MSC differentiation into adipocytes is beneficial for maintaining a functional bone marrow environment and remains an interesting topic for future therapeutic development.
Acknowledgments
We are grateful to Dr Wang Jianwei and Wang Haijun for their excellent technical assistance.
References
- Beresford JN, Bennett JH, Devlin C, et al. Evidence for an inverse relationship between the differentiation of adipocytic and osteogenic cells in rat marrow stromal cell cultures. J. Cell Sci. 1992;102:341–351. doi: 10.1242/jcs.102.2.341. [DOI] [PubMed] [Google Scholar]
- Bonnet N, Benhamou CL, Malaval L, et al. Low dose beta-blocker prevents ovariectomy-induced bone loss in rats without affecting heart function. J. Cell. Physiol. 2008;217:819–827. doi: 10.1002/jcp.21564. [DOI] [PubMed] [Google Scholar]
- Calvi LM, Adams GB, Weibrecht KW, et al. Osteoblastic cells regulate the haematopoietic stem cell niche. Nature. 2003;425:841–846. doi: 10.1038/nature02040. [DOI] [PubMed] [Google Scholar]
- Chen HQ, Yao R, Han J, et al. Effect of aging on the ability of growth and differentiation of rat bone marrow stromal cells. Acta Academiae Medicinae Sinicae. 2003;25:244–249. [PubMed] [Google Scholar]
- Chiappetta N, Gruber B. The role of mast cells in osteoporosis. Semin. Arthritis Rheum. 2006;36:32–36. doi: 10.1016/j.semarthrit.2006.03.004. [DOI] [PubMed] [Google Scholar]
- Fujimoto T, Niimi A, Sawai T, et al. Effects of steroid-induced osteoporosis on osseointegration of titanium implants. Int. J. Oral Maxillofac. Implants. 1998;13:183–189. [PubMed] [Google Scholar]
- Gambacciani M, Ciaponi M, Cappagli B, et al. Body weight, body fat distribution, and hormonal replacement therapy in early post menopausal women. J. Clin. Endocrinol. Metab. 1997;82:414–417. doi: 10.1210/jcem.82.2.3735. [DOI] [PubMed] [Google Scholar]
- Gurevitch O, Stavin S. The hematological etiology of osteoporosis. Med Hypotheses. 2006;67:729–735. doi: 10.1016/j.mehy.2006.03.051. [DOI] [PubMed] [Google Scholar]
- Heim M, Frank O, Kampmann G, et al. The phytoestrogen genisteim enhances osteogenesis and represses adipogenic differentiation of human primary bone marrow stromal cells. Endocrinology. 2004;145:848–859. doi: 10.1210/en.2003-1014. [DOI] [PubMed] [Google Scholar]
- Irie A, Takami M, Kubo H, et al. Heparin enhance osteoclastic bone resorption by inhibiting osteoprotegerin activity. Bone. 2007;41:165–174. doi: 10.1016/j.bone.2007.04.190. [DOI] [PubMed] [Google Scholar]
- Jilka RL, Hangoc G, Girasole G, et al. Increased osteoclast development after estrogen loss: mediation by interleukin-6. Science. 1992;257:88–91. doi: 10.1126/science.1621100. [DOI] [PubMed] [Google Scholar]
- Jilka RL, Weinstein RS, Takahashi K, et al. Linkage of decreased bone mass with impaired osteoblastogenesis in a murine model of accelerated senescence. J. Clin. Invest. 1996;97:1732–1740. doi: 10.1172/JCI118600. [DOI] [PMC free article] [PubMed] [Google Scholar]
- Jilka RL, Takahashi K, Munshi M, et al. Loss of estrogen upregulates osteoblastogenesis in the murine bone marrow. Evidence for autonomy from factors released during bone resorption. J. Clin. Invest. 1998;101:1942–1950. doi: 10.1172/JCI1039. [DOI] [PMC free article] [PubMed] [Google Scholar]
- Jin XJ, Li JN, Zhong H, et al. Changes of bone metabolism in rats of 4 and 12 week after ovariectomized. Lab. Anim. Sci. Manage. 2003;20:20–23. [Google Scholar]
- Ju CG, Ma QJ, Dang GD, et al. Electro-microscopic observation of trabecular bone remodeling in ovariectomized rats. J. Clin. Rehabil. Tissue Eng. Res. 2007;11:6509–6512. [Google Scholar]
- Justesen J, Stenderup K, Ebbesen EN, et al. Adipocyte tissue volume in bone marrow is increased with aging and in patients with osteoporosis. Biogerontology. 2001;2:165–171. doi: 10.1023/a:1011513223894. [DOI] [PubMed] [Google Scholar]
- Kalu DN, Liu CC, Hardin RR, et al. The aged rat model of ovarian hormone deficiency bone loss. Endocrinology. 1989;124:7–16. doi: 10.1210/endo-124-1-7. [DOI] [PubMed] [Google Scholar]
- Kanis JA, Melton LJ, Christiansen C, et al. The diagnosis of osteoporosis. J. Bone Miner. Res. 1994;9:1137–1141. doi: 10.1002/jbmr.5650090802. [DOI] [PubMed] [Google Scholar]
- Lerner UH. Transforming growth factor-beta stimulates bone resorption in neonatal mouse calvariae by a prostaglandin-unrelated but cell proliferation-dependent pathway. J. Bone Miner. Res. 1996;11:1628–1639. doi: 10.1002/jbmr.5650111106. [DOI] [PubMed] [Google Scholar]
- Lesclous P, Saffar JL. Mast cells accumulate in rat bone marrow after ovariectomy. Cells Tissues Organs. 1999;164:23–29. doi: 10.1159/000016639. [DOI] [PubMed] [Google Scholar]
- Lesclous P, Schramm F, Gallina S, et al. Histamine mediates osteoclastic resorption only during the acute phase of bone loss in ovariectomized rats. Exp. Physiol. 2006;91:561–570. doi: 10.1113/expphysiol.2006.033217. [DOI] [PubMed] [Google Scholar]
- Li LH, Bai DQ, Wang Y, et al. Assessment on the balance between osteoblasts and osteoclasts in ovariectomized rat models. Chin. J. Comp. Med. 2005;15:213–217. [Google Scholar]
- Mahachoklertwattana P, Pootrakul P, Chuansumrit A, et al. Association between bone mineral density and erythropoiesis in Thai children and adolescents with thalassemia syndromes. J. Bone Miner. Metab. 2006;24:146–152. doi: 10.1007/s00774-005-0661-0. [DOI] [PubMed] [Google Scholar]
- Martin RB, Zissimos SL. Relationships between marrow fat and bone turnover in ovariectomized and intact rats. Bone. 1991;12:123–131. doi: 10.1016/8756-3282(91)90011-7. [DOI] [PubMed] [Google Scholar]
- Metcalfe DD, Baram D, Mekori YA. Mast cells. Physiol. Rev. 1997;77:1033–1079. doi: 10.1152/physrev.1997.77.4.1033. [DOI] [PubMed] [Google Scholar]
- Meunier P, Aaron J, Edouard C, Vignon G. Osteoporosis and the replacement of cell populations of the marrow by adipose tissue. A quantitative study of 84 iliac bone biopsies. Clin. Orthop. Relat. Res. 1971;80:147–154. doi: 10.1097/00003086-197110000-00021. [DOI] [PubMed] [Google Scholar]
- NIH consensus development panel NIH consensus development panel on osteoporosis prevention, diagnosis, and therapy, March 7-29, 2000: highlights of the conference. JAMA. 2001;285:785–795. [PubMed] [Google Scholar]
- Nuttall ME, Gimble JM. Is there a therapeutic opportunity to either prevent or treat osteopenic disorders by inhibiting marrow adipogenesis? Bone. 2000;27:177–184. doi: 10.1016/s8756-3282(00)00317-3. [DOI] [PubMed] [Google Scholar]
- Okazaki R, Inoue D, Shibata M, et al. Estrogen promotes early osteoblast differentiation and inhibits adipocyte differentiation in mouse bone marrow estromal cell lines that express estrogen receptor (ER) αorβ. Endocrinology. 2002;143:2349–2356. doi: 10.1210/endo.143.6.8854. [DOI] [PubMed] [Google Scholar]
- Owen A. What is early intervention? Br. J. Psychiatry. 2003;183:562. [PubMed] [Google Scholar]
- Pfeilschifter J, KÖditz R, Pfohl M, et al. Changes in proinflammatory cytokine activity after menopause. Endocr. Rev. 2002;23:90–119. doi: 10.1210/edrv.23.1.0456. [DOI] [PubMed] [Google Scholar]
- Pittenger MF, Mackay AM, Beck SC, et al. Multilineage potential of adult human mesenchymal stem cells. Science. 1999;284:143–147. doi: 10.1126/science.284.5411.143. [DOI] [PubMed] [Google Scholar]
- Pu Q, Yang MR. Diagnostic Pathology of the Bone Marrow in Hematology. Beijing: Science Press; 2002. pp. 23–24. [Google Scholar]
- Revell Pa. Histomorphometry of bone. J. Clin. Pathol. 1983;36:1323–1331. doi: 10.1136/jcp.36.12.1323. [DOI] [PMC free article] [PubMed] [Google Scholar]
- Shen W, Sui L, Su LH. Establishment of experimental animal model of osteoporosis with mice. J. Shenyang Med. Coll. 2006;8:245–246. [Google Scholar]
- Sims NA, Morris HA, Moore RJ, et al. Increased bone resorption precedes increased bone formation in the ovariectomized rat. Calcif. Tissue Int. 1996;59:121–127. doi: 10.1007/s002239900098. [DOI] [PubMed] [Google Scholar]
- Theoharides TC. The mast cell: a neuroimmunoendocrine master player. Int. J. Tissue React. 1996;18:1–21. [PubMed] [Google Scholar]
- Udagawa N, Takahashi N, Jimi E, et al. Osteoblasts/stromal cells stimulate osteoclast activation through expression of osteoclast differentiation factor/RANKL but not macrophage colony-stimulating factor: receptor activator of NF-kappa B ligand. Bone. 1999;25:517–523. doi: 10.1016/s8756-3282(99)00210-0. [DOI] [PubMed] [Google Scholar]
- Visnjic D, Kalajzic Z, Rowe DW, et al. Hematopoiesis is severely altered in mice with an induced osteoblast deficiency. Blood. 2004;103:3258–3264. doi: 10.1182/blood-2003-11-4011. [DOI] [PubMed] [Google Scholar]
- Wagner EF, Karsenty G. Genetic control of skeletal development. Curr. Opin. Genet. Dev. 2001;11:527–532. doi: 10.1016/s0959-437x(00)00228-8. [DOI] [PubMed] [Google Scholar]
- Wang J, Yao XS, Tang TS, et al. Effects of pravastatin on BMP-2 expression and osteoblast proliferation in ovariectomized rats. SuZhou Univ. J. Med. Sci. 2006;26:14–16. [Google Scholar]
- Wronski TJ, Lowry PL, Walsh CC, et al. Skeletal alterations in ovariectomized rats. Calcif. Tissue Int. 1985;37:324–328. doi: 10.1007/BF02554882. [DOI] [PubMed] [Google Scholar]
- Xie Z, Li QH, Meng P, et al. Characteristics of osteoporosis models in ovariectomized rats. Chin. J. Clin. Rehabil. 2006;10:79–81. [Google Scholar]
- Zhang J, Niu C, Ye L, et al. Identification of the haematopoietic stem cell niche and control of the niche size. Nature. 2003;425:836–841. doi: 10.1038/nature02041. [DOI] [PubMed] [Google Scholar]