

Abstract
K-ras mutations are found in 40–50% of human colorectal adenomas and carcinomas, but their functional contribution remains incompletely understood. Here, we show that a conditional mutant K-ras mouse model (K-rasAsp12/Cre), with transient intestinal Cre activation by β-Naphthoflavone (β-NF) treatment, displayed transgene recombination and K-rasAsp12 expression in the murine intestines, but developed few intestinal adenomas over 2 years. However, when crossed with ApcMin/+ mice, the K-rasAsp12/Cre/ApcMin/+ offspring showed acceleration of intestinal tumourigenesis with significantly changed average lifespan (P < 0.05) decreased to 18.4 ± 5.4 weeks from 20.9 ± 4.7 weeks (control ApcMin/+ mice). The numbers of adenomas in the small intestine and large intestine were significantly (P < 0.01) increased by 1.5-fold and 5.7-fold, respectively, in K-rasAsp12/Cre/ApcMin/+ mice compared with ApcMin/+ mice, with the more marked increase in adenoma prevalence in the large intestine. To explore possible mechanisms for K-rasAsp12 and ApcMin co-operation, the Mitogen-activated protein kinase (Mapk), Akt and Wnt signalling pathways, including selected target gene expression levels, were evaluated in normal large intestine and large intestinal tumours. K-rasAsp12 increased activation of Mapk and Akt signalling pathway targets phospho-extracellular signal-regulated kinase (pErk) and pAkt, and increased relative expression levels of Wnt pathway targets vascular endothelial growth factor (VEGF), gastrin, cyclo-oxygenase 2 (Cox2) and T-cell lymphoma invasion and metastasis 1 (Tiam1) in K-rasAsp12/Cre/ApcMin/+ adenomas compared with that of ApcMin/+ adenomas, although other Wnt signalling pathway target genes such as Peroxisome proliferator-activated receptor delta (PPARd), matrix metalloproteinase 7 (MMP7), protein phosphatase 1 alpha (PP1A) and c-myc remained unchanged. In conclusion, intestinal expression of K-rasAsp12 promotes mutant Apc-initiated intestinal adenoma formation in vivo more in the large intestine than the small intestine, with evidence of synergistic co-operation between mutant K-ras and Apc involving increased expression of some Wnt-pathway target genes.
Keywords: adenoma, adenomatous polyposis coli, Cre/LoxP, intestine, K-ras, Min
Colorectal cancers arise following accumulation of mutations or other alterations to several genes, including Apc (adenomatous polyposis coli), β-catenin, K-ras, Smad 2 & 4, PI3k, Msh2, Mlh1, p53 and others, along with large-scale genomic changes and epigenetic alterations (Fearon & Vogelstein 1990; Powell et al. 1992; Al-Aynati et al. 2004; Arends & Frayling 2005; Sjöblom et al. 2006; Wood et al. 2007). K-ras is mutated in 40–50% of both colorectal adenomas and carcinomas, with codon 12 aspartate as one of the common mutations (Bos et al. 1987; Jervoise et al. 1998; Andreyev et al. 2001). K-ras mutations may be found at all stages of colorectal neoplasm development, including dysplastic aberrant crypt foci (ACF) (Shivapurkar et al. 1997), hyperplastic polyps (Otori et al. 1997), adenomas and carcinomas (Ohnishi et al. 1997). K-ras mutations are associated with increased size and dysplasia in adenomas, suggesting that they may be permissive for growth disorder early in tumourigenesis (Ohnishi et al. 1997). Mutation of the K-ras gene reduces or abolishes the protein’s intrinsic GTPase activity, locking it in a guanosine triphosphate (GTP) bound conformation that is constitutively active and generates signals to downstream effectors (Barbacid 1987). This activation of ras has several effects on rodent fibroblasts cultured in vitro, including the establishment of the transformed phenotype, anchorage independent growth, focus formation and tumourigenic potential when injected into animals (Spandidos & Wilkie 1984; Arends et al. 1993, 1994), but its roles in colorectal tumour initiation and progression are still incompletely understood.
The Apc gene, frequently called the ‘gatekeeper’ of colorectal cancer, is mutated in 60–80% of sporadic colorectal adenomas and cancers. Inherited Apc defects give rise to the syndrome of familial adenomatous polyposis coli (FAP) manifested by the formation of hundreds or thousands of adenomas (Rustgi 1994). Familial adenomatous polyposis coli (FAP) is modelled by the multiple intestinal neoplasia (ApcMin/+) mouse, which has one wild-type allele and one Apc allele mutated at codon 850, and displays Apc-driven tumourigenesis in the intestines (Su et al. 1992). Investigation of adenomas from both FAP patients and Min mice (each with one inherited Apc gene mutation) has shown either mutation or loss of the wild-type Apc allele in most adenomas (Ichii et al. 1993; Levy et al. 1994). Thus, mutation or loss of both Apc alleles represents the most important pathway of adenoma initiation.
K-ras and Apc mutations both occur during the early stages of colorectal adenoma formation, including dysplastic aberrant crypt foci, early monocryptal adenomas, oligocryptal adenomas as well as established adenomas, and it has been hypothesized that these two mutant genes may co-operate during tumourigenesis. Previously, we showed that induction of intestinal expression of a similar conditional knock-in K-rasVal12 transgene can accelerate intestinal tumour formation on a Msh2-null background (Luo et al. 2007a); however, the precise contributions of mutated K-ras to mutant Apc-driven intestinal tumourigenesis are insufficiently well characterized. In vitro studies have shown synergy between mutant ras and Apc, as together they promote transformation of colonic epithelial cell lines (D’Abaco et al. 1996), but the results of in vivo experiments have been contradictory (Johnson et al. 2001; Janssen et al. 2002, 2005, 2006; Guerra et al. 2003; Tuveson et al. 2004; Sansom et al. 2006; Calcagno et al. 2008; Haigis et al. 2008). Oncogenic K-ras has been shown to co-operate with mutant Apc during tumourigenesis affecting the intestines (Janssen et al. 2006; Sansom et al. 2006; Haigis et al. 2008), but the mechanisms are incompletely understood and the site of maximal co-operation within the small or large intestines is uncertain.
Here, we describe a strain of mice with a conditional mutated K-rasAsp12 transgene that when crossed with Ah-Cre mice, allows inducible expression of K-rasAsp12 in the intestinal epithelial stem cell compartment of the crypts. This model was used to test the effect of mutant K-rasAsp12 on intestinal tumourigenesis in vivo. In mice carrying a mutant K-rasAsp12 transgene and Ah-Cre, following induction of recombination and expression of mutated K-rasAsp12 in the intestines, only a few small adenomas were found in the small intestine, showing that mutant K-ras alone does not significantly initiate tumour formation in the intestine, confirming our previous findings (Luo et al. 2007a). The mutant K-rasAsp12/Ah-Cre transgenic mice were crossed with ApcMin/+ mice and the progeny harbouring mutated K-rasAsp12, Ah-Cre and ApcMin/+ alleles showed acceleration of intestinal tumourigenesis, with greater effects on the large than the small intestines, and the adenomas showed evidence of synergism between mutant K-ras and Apc involving increased expression of some Wnt-pathway target genes.
Materials and methods
Transgene construction
The K-rasAsp12 transgene expression construct was generated as follows: the oncogenic ras gene was a previously made chimeric human N/K-ras gene (Maher et al. 1995), which contained the cDNA sequence encoding amino acids 1–83 from the human N-ras, including a mutation in codon 12 coding for an aspartic acid residue (Asp) instead of the wild-type glycine, fused with the cDNA sequence encoding amino acids 84–188 from the human K-ras gene that includes exon 4B in continuity with exon 3 (excluding exon 4A). The entire chimaeric ras gene encodes the correct primary amino acid sequence for the human K-RasAsp12 4B protein, because K-Ras and N-Ras proteins share the same amino acid sequence for the first 83 residues. This chimaeric K-rasAsp12 transgene cDNA fragment was inserted into the Promega vector PCIneo that featured a floxed-‘STOP’ cassette, constructed as described elsewhere (Brooks et al. 2001; James et al. 2003; Luo et al. 2007a) using the synthetic linker NotI – LoxP – HindIII–XhoI – LoxP – NotI (5′-GGC CGC ATA ACT TCG TAT AGC ATA CAT TAT ACG AAG TTA TAA GCT TAT TTG AGG CTC GAG AAA TAA CTT CGT ATA GCA TAC AT T ATA CGA AGT TAT AGC TGG C-3′) and the neomycin resistance gene containing ‘STOP’ sequence inserted into the HindIII and XhoI sites. Upstream of this lox-STOP-lox sequence was placed the cytomegalovirus (CMV) promoter and downstream was the K-rasAsp12 transgene followed by an encephalomyocarditis virus internal ribosome entry site (IRES)–enhanced green fluorescent protein (EGFP) sequence (Figure 1). This construct was linearized by BamHI, purified by agarose gel electrophoresis with electroelution and injected into fertilized FVB/N mouse oocytes to generate founder mice.
Figure 1.

K-rasAsp12 construct, PCR genotyping and construct copy number assay. (a) Structure of the K-rasAsp12 transgene: cytomegalovirus (CMV) immediate early promoter; neomycin (NEO), resistance gene; 1, 2, 3 and 4B, K-ras exons 1, 2, 3 and 4B; encephalomyocarditis virus internal ribosome entry site (IRES); enhanced green fluorescent protein (EGFP); pA, polyadenylation signal; ▸, 34 bp LoxP sites; the positions and orientations of the PCR primers used for genotyping analyses are depicted by arrows (→). (b) Typical results of genotyping PCR assays from offspring of transgenic mice and control (B6) mice. Polymerase chain reaction (PCR) amplification of an Apc gene fragment was used as the control for the quality of genomic DNA samples. + represents mouse tail DNA from mice positive for the K-rasAsp12 transgene; − represents mouse tail DNA from control B6 mice negative for the transgene constructs. (c) Genotyping Min mice by allele-specific primers binding either the wild-type or the mutant Apc gene sequence. Upper two panels: use of Apc1a/Apc1b (wild-type Apc primer pair) and Apc1a/Apc2b (mutant Apc primer pair) to amplify wild-type B6 genomic DNA, shows that at 66 °C and 67 °C annealing temperatures, wild-type Apc can be distinguished from mutant Apc. Middle two panels: use of Apc1c/Apc1d (wild-type Apc primer pair) and Apc1c/Apc2d (mutant Apc primer pair) to amplify wild-type B6 genomic DNA, shows that at 72 °C annealing temperature wild-type Apc can be distinguished from mutant Apc. Lower two panels: an example of the use of both sets of wild-type and mutant Apc primer pairs Apc1a/Apc1b (W) and Apc1a/Apc2b (M) at 66.5 °C (upper) and Apc1c/Apc1d (W) and Apc1c/Apc2d (M) at 72 °C (lower) to amplify genomic tail DNA samples from known negative control B6 (wild-type only) and known Min (M1 to M3, with both wild-type and mutant Apc alleles) mice. (d) Bar chart of relative copy numbers of K-ras exon 3 sequences (human and mouse) by Real-time quantitative DNA PCR (qPCR), showing the mean (error bar = SD) relative copy number of K-ras exon 3 in B6 control mice was 2.00 ± 0.37 (n = 6), and that of K-rasAsp12 was 3.80 ± 0.55 (n = 6), indicating the presence of two endogenous and two transgenic copies of K-ras.
Genotyping the K-rasAsp12 mice
For genotyping, four pairs of primers, located in the sequences for the CMV promoter, neomycin resistance gene, human K-ras exon 4B and EGFP sequences, were designed and developed (Luo et al. 2007a) for PCR assays for rapid screening of the K-rasAsp12 positive mice (Figure 1). Tail tips of offspring were digested overnight at 55 °C in 500 μl DNA lysis buffer (50 mmol/l Tris-HCl, pH 7.5, 0.1 mol/l NaCl, 0.5% SDS, 5 mmol/l ethylene diamine tetra-acetic acid (EDTA), 100 μg/ml proteinase K). Proteins were precipitated with 6 mol/l NaCl. To precipitate DNA, one volume of isopropanol was added and the mixture centrifuged, the DNA pellet was washed in 70% ethanol and dissolved in 30 μl TE buffer. The quality of genomic DNA samples was estimated by amplifying a wild-type Apc gene fragment (Luo et al. 2007a). Polymerase chain reaction conditions were 95.0 °C for 30 s, 60.0 °C for 30 s and 72.0 °C for 45 s for 35 cycles.
Genotyping the ApcMin/+ mice
ApcMin/+ mice have a nonsense mutation at codon 850 in the Apc gene (Su et al. 1992). We designed four pairs of PCR primers to distinguish this point mutation from the wild-type sequence. The first two primer pairs were used under very strict PCR conditions (95.0 °C for 30 s, 66.5 °C for 30 s and 72.0 °C for 45 s for 35 cycles), the primer pair Apc1a–Apc1b amplified wild-type Apc gene fragments, whereas the primer Apc2b (which has just one base difference at the 3′ terminus of the primer) was used in the primer pair Apc1a–Apc2b to amplify the mutant Apc sequence. The second two primer pairs were also used under strict PCR conditions (95.0 °C for 30 s, 72.0 °C for 75 s for 35 cycles), the primer pair Apc1c–Apc1d amplified wild-type Apc sequence, whereas the primer Apc2d (with just one base difference at the 3′ terminus of the primer) was used in the primer pair Apc1c–Apc2d to amplify the mutant Apc gene sequence. The sequences of PCR primers were as follows: Apc1a, 5′ GTT CTC GTT CTG AGA AAG ACA GAA GTT T 3′; Apc2b, 5′ GTT CTC GTT CTG AGA AAG ACA GAA GTT A 3′; Apc1b, 5′ TCG TTT ATA TTC CAC TTT GGC ATA AGG C 3′; Apc1c, 5′ CAA GTC TGC CAT CCC TTC ACG TTA GGA A 3′; Apc1d, 5′ CTG AGG CCA ATA CCT CGC TCT CTC TCC A 3′; Apc2d, 5′ CTG AGG CCA ATA CCT CGC TCT CTC TCC T 3′. The optimal primer annealing temperatures were determined by testing the primer pairs against known wild-type Apc sequences (C57Black6/J or B6 mice) and known ApcMin sequences (known Min mice with multiple adenomas and known mutational status proven by DNA sequencing) at a range of annealing temperatures on a gradient PCR block (Figure 1c).
Real-time quantitative DNA PCR was used to identify the copy number of the K-rasAsp12 transgene
To estimate the number of copies of human K-rasAsp12 transgene integrated into the genome of the K-rasAsp12 transgenic mice, real-time quantitative DNA PCR (qPCR) was used to amplify K-ras sequences from both endogenous murine K-ras proto-oncogene (two copies per cell) and the integrated human K-rasAsp12 transgenes. One pair of primers was designed that bound with identical specificity to both human and mouse K-ras exon three sequences: K-ras mouse/human exon 3 sense primer: 5′ TTA TTG ATG GAG AAA CCT GTC TCT TG 3′, K-ras mouse/human exon 3 antisense primer: 5′ TTA TGG CAA ATA CAC AAA GAA AGC C 3′. Briefly, 100 ng genomic DNA extracted from control B6 mice and from mice containing the K-rasAsp12 transgene was used for qPCR. The qPCR reactions were amplified using the iCycler (BioRad, Hemel Hempstead, UK) starting with denaturation at 95.0 °C for 3 min, then 35 cycles of 95.0 °C for 15 s and 60.0 °C for 1 min. The specificity of the PCR reactions was determined from the dissociation curve analysis and 2% agarose gel electrophoresis of the products. All PCR products were quantitatively analysed in the linear range of the log-plotted exponential phase of PCR amplification. The quantity of the specific K-ras-derived fragments was obtained from standard curves with normalization using the wild-type Apc gene PCR of the same sample. All qPCR reactions were performed in triplicate and the mean (±SD) value of K-ras copy number was calculated.
Analysis of transgene recombination at the LoxP sites by PCR and DNA sequencing
Genomic DNA was prepared from intestinal tumours and non-tumour-bearing tissue samples by overnight proteinase K digestion, followed by purification using a QIAamp Tissue kit (Qiagen, UK). Transgene recombination was detected by PCR using the primers: sense primer RE-CMV, 5′ TCA GAT CAC TAG AAG CTT TAT TGC GG 3′, which was located in the CMV promoter; antisense primer RE-K-rasAsp12, 5′ TAC AAA GTG GTT CTG GAT TAG CTG GA 3′, which was located in exon 3 of the K-rasAsp12 transgene. The PCR primers were used in a PCR assay to detect recombination at the two LoxP sites leading to excision of the ‘STOP’ cassette and joining together of the CMV promoter and the K-rasAsp12 transgene. The same PCR primers were used as DNA sequencing primers to sequence the PCR product from both ends by standard Sanger DNA sequencing methods.
Reverse transcription PCR analysis of expression of K-rasAsp12 transcripts
To induce Cre expression via the Ah promoter of the Ah-Cre transgene, the mice were injected with 160 mg/kg β-naphthoflavone (β-NF) (Sigma, Dorset, UK) dissolved in corn oil for 6 days as described previously elsewhere (Ireland et al. 2004; Luo et al. 2007a), and controls received either no treatment or corn oil only. Human K-rasAsp12 4B expression was determined using the K-ras 4B upstream primer 5′-GTA CCT ATG GTC CTA GTA GGA AAT AAA-3′ located in human K-ras exon 3; and the K-ras 4B downstream primer 5′-CTG ATG TTT CAA TAA AGG AAT TCC A-3′ located in human K-ras exon 4B. The PCR product size was 159 bp. For quantitative RT-PCR, 100 ng of total RNA of different tissue samples was reverse transcribed in 25 ml volume using the iTaq SYBR Green kit RT-PCR kit (BioRad). All RT-qPCR reactions were amplified starting with denaturation at 95.0 °C for 3 min, then 45 cycles of 95.0 °C for 15 s and 60.0 °C for 1 min.
Western blot and immunohistochemical analyses
For Western blot analysis, fresh tissue samples were lysed in protein lysis buffer containing 50 mmol/l Tris–HCl (pH 7.4), 150 mmol/l NaCl, 0.5% NP-40 (Shell Chemical Co., New York, USA) and protease inhibitors. Soluble protein lysates were quantified using the BCA Protein Assay kit (Pierce, Rockford, Illinois, USA). Total proteins were separated by 15% SDS-PAGE, transferred to nitrocellulose membranes (Schleicher and Scheull, UK) and incubated with the corresponding antibodies including anti-K-RasAsp12 (Calbiochem, Merck, Darmstadt, Germany) and anti-Cre rabbit polyclonal antibody (Novagen Inc., Madison, Wisconsin, USA). Blots were hybridized with antibodies in 1:1000 dilutions. Visualization was performed with chemiluminescence. The p-Mapk Family (including phospho-extracellular signal-regulated kinase (pErk) 1&2) Rabbit mAb Sampler Kit and the p-Akt Pathway Sampler Kit (Cell Signalling Co., Beverley, Massachusetts, USA) were used for Mapk and Akt pathway protein analysis by both Western blotting and immunohistochemical analyses. Immunohistochemical analysis of selected proteins involved use of goat anti-gastrin polyclonal antibody, rabbit anti-T-cell lymphoma invasion and metastasis 1 (Tiam1) (C-16) polyclonal antibody (both from Santa Cruz Biotechnology Inc., Santa Cruz, California, USA), rabbit anti-cyclo-oxygenase 2 (Cox2) monoclonal antibody, rabbit anti-β-catenin monoclonal antibody, rabbit anti-phosphoGSK-3beta (Glycogen synthase kinase 3beta) monoclonal antibodies and rabbit anti-Vascular endothelial growth factor (VEGF) polyclonal antibody (all from Novus Biologicals Inc., Littleton, Colorado, USA).
For immunohistochemical analysis, immunoperoxidase detection was performed on 4 μm formalin-fixed, paraffin-embedded tissue sections. Sections were deparaffinized in xylene and rehydrated through graded alcohols to distilled water. Antigen retrieval was performed. The anti-phospho-Erk1/2 primary antibodies, anti-phospho-Akt primary antibodies, anti-phosphoGSK-3beta primary antibodies, anti-gastrin primary antibodies, anti-Tiam1 primary antibodies, anti-Cox2 primary antibodies, anti-β-catenin primary antibodies and anti-VEGF primary antibodies were added to the sections and incubated for 1 h at room temperature, followed by biotinylated antibody (Dako, Denmark) and peroxidase-conjugated ExtroAvidin (Sigma-Aldrich, St Louis, Missouri, USA). Finally, 3, 3′-diaminobenzidine tetrahydrochloride (DAB) was used as chromogen (Kem-En-Tec A/S, Denmark). Sections were counterstained with Mayer’s haematoxylin. No signal was detected in sections when the primary antibody was omitted as a negative control.
Analysis of tumours
Mice were killed and the number of intestinal tumours counted. The whole intestinal tract of each mouse was removed, rinsed gently in PBS using a syringe and opened lengthwise. The opened intestine was spread out flat on filter paper. All tumours were counted under a dissecting microscope at 15× magnification, always by the same investigator. The smallest tumours identified were about 0.5 mm in diameter. Some tumours were bisected and half taken fresh for DNA, RNA and protein analyses. The samples were then fixed in 10% neutral-buffered formalin solution. Tumours of the small and large intestines and other tissues were processed for paraffin embedding. Sections were prepared for H&E staining for confirmation of the diagnosis and immunohistochemistry.
Real-time quantitative RT-PCR evaluation of relative expression levels of target genes
Real-time quantitative reverse transcription PCR (real-time RT-qPCR) was carried out to measure the relative expression levels of a range of selected target genes (Table 1 shows the PCR primer sequences) using the comparative cycle threshold (Ct) method as described elsewhere (Luo et al. 2007a). The values for β-actin were used to normalize the gene expression data. The gene expression levels in intestinal tumours relative to the control intestinal normal tissues were calculated using the following formulas: ΔΔCt = ΔCt test−ΔCt control, fold change = 2−ΔΔCt.
Table 1.
Polymerase chain reaction primers for expression analysis
| Gene | Upstream PCR primer | Downstream PCR primer |
|---|---|---|
| Axin | TCTCCGAGACAGAGACAAAATCAC | TCTTGGTTAGCAGCTCCTTGAACT |
| Apc | TGATACTTCTTCCAAAGCTTTGGCTAT | TCTCGTTCTGAGAAAGACAGAAGCT |
| β-catenin | CCATTGAAAATATCCAAAGAGTAGC | CTCAGACATTCGGAATAGGACAG |
| CD44 | GCGGTCAATAGTAGGAGAAGGTGT | CTCGTCAGCTGTCATACACTGGT |
| CMV | TGACGTCAATGGGTGGAGTA | TGCCAAAACAAACTCCCATT |
| c-myc | AAATCCTGTACCTCGTCCGATTC | ATCAATTTCTTCCTCATCTTCTTGC |
| Cox2 | ACAGACTGTGCCACATACTCAAGC | GATACTGGAACTGCTGGTTGAAAAG |
| Cyclin D1 | TTTCTTTCCAGAGTCATCAAGTGTG | ACCAGCCTCTTCCTCCACTTC |
| Cyclin D2 | GAACTGGTAGTGTTGGGTAAGCTG | GTACATGGCAAACTTGAAGTCG |
| E-cadherin | TACCCGGGACAATGTGTATTACTAT | GAAGTTTCCAATTTCATCAGGATT |
| EGFP | GCAAGGGCGAGGAGCTGTTC | CCATGCCGAGAGTGATCCCG |
| Ephb2 | CCATTGAACAGGACTACAGACTACC | CACCGTGTTAAAGCTGGTGTAG |
| Gastrin | ACCAATGAGGACCTGGAACAG | TGCTAGTCCTACTGGTCTTCCTCA |
| Igfbp4 | CACGAAGACCTCTTCATCATCC | CCTAGTAGGGGGCACTGAGTC |
| K-ras 4B | TCTTAAGGCATACTAGTACAAGTGGT | TTTGTTTCACACCAACATTCA |
| MMP7 | GAGTACTGGACTGATGGTGAGGAC | CATATAACTTCTGAATGCCTGCAA |
| Neo | TGGAGAGGCTATTCGGCTATGACTGGG | TGGATACTTTCTCGGCAGGAGCAAGGTG |
| N/K-ras | AGTGGTTATAGATGGTGAAACCTGTT | TTGTCTTTGCTGATGTTTCAATAAAA |
| PP1A | CTACTGTGTGATCTCCTGTGGTCT | AGAAGAGTGTCACCAACTGTCTCTT |
| P21 | CTGTCTTGCACTCTGGTGTCTG | GGCACTTCAGGGTTTTCTCTT |
| PP2A | GAATGACTACACTCTTCTGCATCAA | TATCAAGAATGGGTCCTATCTTCTG |
| P70S6K | ATCTGAAGAGGATGTGAGTCAGTTT | TGTTCGTGGACTACCAATAAATCTT |
| Pem | GAGTCAAGGAAGACTCGGAAGA | GGCCTTTTCCTCCATTTAATTC |
| PPARd | CAAGTTCGAGTTTGCTGTCAAGTT | GACCTGCAGATGGAATTCTAGAGC |
| TCF-4 | ACCATGTTGATCACAGACACCAA | GCTGCAGGTGCTGGATGTT |
| Tcl-1 | CAAGAGTAATGAAAAATTCCAGGTG | GATATGGTACAGGATCTGCCAATAC |
| Tiam1 | AATTGTCCACGTGAAATCAGAGT | CTTTAAGCGCACACAATCTCTTG |
| Trap1a | AAGAATTGGAGAACCTGATGGA | GGGTCGTGGAAGAAATAAATCA |
| UPA | ATCTTGCACGAATACTACAGGGAAG | CAGTGATCTCACAGTCTGAACCAAA |
| VEGF | GGAGTACCCCGACGAGATAGAGTA | GAAGCTCATCTCTCCTATGTGCTG |
Statistical and clustering analysis
The spss (SPSS, Chicago, Illinois, USA) statistical package was used for all statistical analyses. Student’s t-tests were used to compare adenoma numbers, and the Kaplan–Meier survival curve method with log rank test was used to compare mouse survival data following tumour progression and mouse deaths. Unsupervised hierarchical clustering of cases was performed using the Euclidean similarity measure and Ward linkage (Johnson et al. 2006) and this was carried out using in-house software written in R (R Development Core Team. R: A language and environment for statistical computing. R Foundation for statistical computing: Vienna, Austria) and visualization was carried out using treeview 1.6 software (Eisen et al. 1998).
Results
Generation and genotyping of conditional K-rasAsp12 transgenic mice and analysis of the transgene copy number
The conditional K-rasAsp12 transgene is based on chimaeric cDNA sequences for exons 1, 2, 3 and 4B (but not exon 4A and with no introns), allowing expression of a transcript that is translated into a protein with the correct amino acid sequence for the whole of human K-Ras4B protein with a codon 12 aspartate mutation (Maher et al. 1995). The structure of the construct was confirmed by restriction enzyme digestion and DNA sequencing (data not shown), its expression and correct functioning were tested in vitro in HM1 murine embryonic stem (ES) cells (data not shown and Brooks et al. 2001). The K-rasAsp12 transgene construct was linearized by BamHI, purified and microinjected into fertilized FVB/N mouse oocytes. K-rasAsp12 transgenic founder mice were generated and shown to contain the K-rasAsp12 transgene (Figure 1) and these were subsequently backcrossed with B6 mice for seven to eight generations until the transgene was on a congenic B6 background. The K-rasAsp12 positive offspring mice were identified by PCR assays for the presence of CMV promoter, human K-ras 4B, neomycin-resistance gene and EGFP gene sequences (Figure 1b). The exon 3 DNA sequences of both human and mouse K-ras genes are highly homologous, with a DNA sequence difference of only two base pairs. A pair of PCR primers was designed to bind equally to both human and murine K-ras exon 3 DNA sequences, and real-time quantitative DNA PCR (qPCR) analysis showed that the relative value of K-ras exon 3 mean (±SD) copy number in B6 control mice was 2.00 ± 0.37 (n = 6), whereas that in K-rasAsp12 transgenic mice was 3.80 ± 0.55 (n = 6), indicating that B6 control mice have two endogenous copies of K-ras and K-rasAsp12 transgenic mice have 4 copies, including the two normal endogenous murine K-ras genes and two copies of the K-rasAsp12 transgene (Figure 1d).
Genotyping of ApcMin/+ mice
ApcMin/+ mice have a nonsense point mutation at codon 850 in the murine Apc gene (Su et al. 1992). We designed four pairs of PCR primers to identify this point mutation. Under very strict PCR conditions (with annealing at 66.5 °C), the primer pair Apc1a–Apc1b amplified the wild-type Apc gene sequence, whereas primer Apc2b (with just one base difference at the 3′ terminus of primer) in the primer pair Apc1a–Apc2b amplified the mutant Apc gene sequence. Under another set of strict PCR conditions (with annealing at 72.0 °C), the primer pair Apc1c–Apc1d amplified the wild-type Apc gene sequence, whereas primer Apc2d (with just one base difference at the 3′ terminus of primer) in the primer pair Apc1c–Apc2d amplified the mutant Apc gene sequence (Figure 1c).
Conditional recombination and expression of the K-rasAsp12 transgene in the intestines of K-rasAsp12/Cre transgenic mice
K-rasAsp12 transgene positive mice were crossed with Ah-Cre mice that are capable of transient expression of Cre recombinase protein in the epithelial cells of the intestinal crypts, including the epithelial stem cells, following β-Naphthoflavone (β-NF) intraperitoneal injection (Ireland et al. 2004; Luo et al. 2007a). This generated offspring mice positive for both conditional K-rasAsp12 and Ah-Cre transgenes, confirmed by PCR-based genotyping assays (Figure 1b). A test group of 25 mice positive for K-rasAsp12/Cre transgenes were treated with β-NF (160 mg/Kg per day for 6 days) to induce transient expression of Cre recombinase protein in intestinal epithelium.
A PCR assay was used to detect recombination occurring at the two LoxP sites (flanking the ‘STOP’ cassette), which amplified the DNA fragment between the two primers (one situated in the CMV promoter and the other in K-ras exon 3), to produce an approximately 500 bp fragment (indicating LoxP recombination) amplified from genomic DNA extracted from both small and large intestines and also from stomach, liver and spleen, but not from heart, pancreas or skin (Figure 2). This showed that Cre-mediated recombination at the two LoxP sites had occurred to excise the large approximately 2 Kb ‘STOP’ cassette containing the neomycin-resistance gene, bringing together the CMV promoter sequence and the K-rasAsp12 sequence. This was confirmed by DNA sequencing of this PCR product which showed that the neomycin-resistance gene containing ‘STOP’ cassette had been deleted between the two LoxP sites (with NotI restriction enzyme sites outside of both LoxP sites), leaving only one LoxP site (flanked by 2 NotI sites) between the CMV promoter and adjacent K-ras sequence (Figure 2). The sequencing data also confirmed the presence of DNA sequence encoding aspartate (in K-rasAsp12/Cre transgenic mice) at codon 12 (substituted for the wild-type glycine) (Figure 2c).
Figure 2.

Analysis of conditional K-rasAsp12 transgene recombination. (a) Schematic representations of the K-rasAsp12 construct undergoing recombination (after treatment with β-NF to induce Cre expression) at the two LoxP sites to bring about expression of K-rasAsp12 transcripts. Without Cre recombinase expression, the K-rasAsp12 transgenes remain silent due to the presence of the neomycin (NEO) containing ‘STOP’ cassette. Upon Cre-mediated recombination of the LoxP sites (arrowheads), the K-rasAsp12 transgene is placed directly under the control of the cytomegalovirus (CMV) promoter. Position and orientation of the polymerase chain reaction (PCR) primers used for analysis are depicted by arrows (→). (b) PCR amplification of the DNA fragment between the CMV promoter and K-rasAsp12 exon 3 generated a 500-bp fragment from genomic DNA extracted from the intestines and some other tissues. B6, Black6 wild-type; C, Cre-only genotype; K/C, K-rasAsp12/Cre genotypes; SI, small intestine; LI, large intestine; Sp, spleen; St, stomach; Pan; pancreas; Sk, skin; Liv, liver; H, heart. (c) DNA sequencing traces of the 500-bp amplified products showed that the ‘STOP’ cassette had been deleted and there was only one LoxP site (flanked by two NotI restriction enzyme sites) between the sequences of the CMV promoter and K-ras exon 1, with the appropriate codon 12 mutation for the transgene construct: codon 12 GAT in the K-rasAsp12 mouse intestine.
Reverse transcription polymerase chain reaction (RT-PCR) analysis confirmed the expression of human K-ras 4B transcripts in the small and the large intestine and also in some other tissues (stomach, spleen and liver), but not in heart, in K-rasAsp12/Cre mice (but not in K-rasAsp12 transgenic mice that were negative for Cre or in Cre only mice or control B6 mice) after β-NF treatment (Figure 3a).
Figure 3.

Expression of K-rasAsp12 in intestinal tissues and tumours. (a) Reverse transcription polymerase chain reaction (RT-PCR) analysis of the expression of K-rasAsp12 4B transcripts in different tissues of K-rasAsp12/Cre transgenic mice, 10 days after completion of the β-NF treatment. C, Cre-only genotype, K/C, K-rasAsp12/Cre genotypes; LI, large intestine; SI, small intestine; St, stomach; Sp, spleen; Sk, skin and Liv, liver as described previously. (b) PCR amplification of a 500-bp DNA fragment between the recombined CMV promoter and K-rasAsp12 exon 3 from genomic DNA of large intestinal tumours (LIT) from K-rasAsp12/Cre/ApcMin/+ transgenic mice treated with β-NF (Apc amplification as control). (c) RT-PCR analysis of the expression of K-rasAsp12 4B transcripts in two small intestinal tumours (SIT) and two LIT from K-rasAsp12/Cre/ApcMin/+ (K/C/M) mice after treatment with β-NF (β-actin RNA expression as normalization reference). (d) Western blot analysis of the expression of mutant K-RasAsp12 protein in a large intestinal tumour of a K-rasAsp12/Cre/ApcMin/+ (K/C/M-LIT) mouse after β-NF treatment (β-actin protein expression as control) compared with a Cre-only mouse large intestine (C-LI).
Phenotypic changes in K-rasAsp12/ Cre mice
After treatment with β-NF, the only phenotypic changes detected in the intestines were two adenomas in the small intestine and two adenomas in the large intestine in the group of 25 K-rasAsp12/Cre mice over 2 years, along with one sarcoma and two lymphomas, but these differences were not statistically significant from the control group of B6 mice (n = 16) or Cre-only mice (n = 29) (treated in the same way) over the same 2-year period. Thus, intestinal expression of mutant K-rasAsp12 alone is not sufficient to significantly initiate intestinal adenomagenesis.
Phenotypic changes in K-rasAsp12/Cre/ApcMin/+ mice
ApcMin/+ mice on a B6 background typically develop 30–50 intestinal adenomas/mouse in the first 6 months of life. To assess the effect of mutated K-ras on intestinal tumourigenesis initiated by mutant Apc, we crossed K-rasAsp12/Cre mice with ApcMin/+ mice to generate a cohort of compound K-rasAsp12/Cre/ApcMin/+ mice (n = 25). Four weeks after birth, 160 mg/kg β-NF was injected intraperitoneally for 6 days. A control cohort of ApcMin/+ mice and ApcMin/+/Cre mice (n = 29) were also treated in the same way. Some of the ApcMin/+ mice developed a few colonic adenomatous tumours, but most of the adenomas of the gastrointestinal tract were found in the small intestine as expected. The compound mutant transgenic offspring showed significantly reduced survival (P < 0.05 by log rank test) due to multiple intestinal adenoma formation (Figure 4), with bowel obstruction and/or haemorrhage. The average lifespan was decreased from 20.9 ± 4.7 weeks (mean ± SD in ApcMin/+ mice) to 18.4 ± 5.4 weeks (in K-rasAsp12/Cre/ApcMin/+ mice, P < 0.05), and no sex differences were observed (Figure 4). The number of duodenal tumours increased from 4.5 ± 1.99 (in ApcMin/+ mice) to 7.2 ± 3.04 (in K-rasAsp12/Cre/ApcMin/+ mice, P < 0.01); the number of jejunal tumours increased from 17.9 ± 6.96 (in ApcMin/+ mice) to 27.2 ± 8.05 (in K-rasAsp12/Cre/ApcMin/+ mice, P < 0.01); the number of ileal tumours increased from 9.7 ± 3.51 (in ApcMin/+ mice) to 15.3 ± 3.45 (in K-rasAsp12/Cre/ApcMin/+ mice, P < 0.01). Thus, there was a 1.5-fold increase in total numbers of small intestinal adenomas in the K-rasAsp12/Cre/ApcMin/+ mice. The number of proximal colonic adenomas increased from 0.22 ± 0.48 (in ApcMin/+ mice) to 1.56 ± 0.99 (in K-rasAsp12/Cre/ApcMin/+ mice, P < 0.01); the number of distal colonic adenomatous tumours increased from 0.41 ± 0.68 (in ApcMin/+ mice) to 2.04 ± 1.66 (in K-rasAsp12/Cre/ApcMin/+ mice, P < 0.01). Thus, compared with ApcMin/+ mice, there was a 5.7-fold increase in total numbers of large intestinal adenomas in the K-rasAsp12/Cre/ApcMin/+ mice (Figure 4). Histological examination confirmed the presence of closely similar adenomas with low grade dysplasia in both the test and control cohorts, and no invasive carcinomas were identified. In the control ApcMin/+ group, 22 large intestinal tumours were measured for tumour size: 14 tumours measured 1–2 mm in diameter and eight tumours measured 2–4 mm in diameter (36.4% tumours measured ≥ 2 mm). For the test cohort of K-rasAsp12/Cre/ApcMin/+ mice, 49 large intestinal tumours measured 1–2 mm in diameter and 36 measured 2–4 mm in diameter (42.4% tumours measured ≥ 2 mm, with no significant difference between the two groups). However, two tumours in the K-rasAsp12/Cre/ApcMin/+ group were more than 4 mm in diameter.
Figure 4.
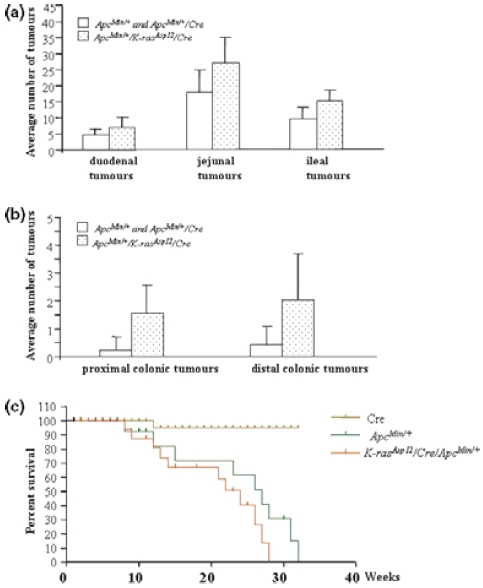
Intestinal tumour prevalence and lifespan in ApcMin/+ mice and K-rasAsp12/Cre/ApcMin/+ mice. (A & B) Average numbers of small intestinal tumours (a) and large intestinal tumours (b) in K-rasAsp12/Cre/ApcMin/+ mice (speckled bars), compared with control ApcMin/+ and ApcMin/+/Cre mice (open bars). (c) Kaplan–Meier survival curves of Cre mice (n = 29), ApcMin/+ (n = 29 in total, including 21 ApcMin/+ and 8 ApcMin/+/Cre mice), and K-rasAsp12/Cre/ApcMin/+ mice (n = 25). Ages of the animals at death (or when killed, if moribund) are given in weeks (X-axis).
Analysis of intestinal adenomas for transgene recombination and expression of K-rasAsp12
To determine the proportion of intestinal adenomatous tumours in which K-rasAsp12 transgene recombination and expression occurred following β-NF treatment of the K-rasAsp12/Cre/ApcMin/+ mice, a sample of large intestinal tumours (LITs) and small intestinal tumours (SITs) were tested for evidence of transgene recombination by PCR (using the same assay as described above) and K-rasAsp12 transcript and protein expression (by RT-PCR analysis as described earlier and by Western blot analysis). Genomic DNA analysis showed that K-rasAsp12 transgene recombination occurred in 23 of 25 (92%) LITs from K-rasAsp12/Cre/ApcMin/+ mice (Figure 3b). Those tumours taken from the K-rasAsp12/Cre ApcMin/+ mice with transgene recombination demonstrated expression of K-rasAsp12 4B transcripts by RT-PCR analysis. Western blot analysis using specific anti-K-RasAsp12 protein antibody confirmed expression of mutant K-Ras protein in these LIT from β-NF treated K-rasAsp12/Cre/ApcMin/+ mice (Figure 3d).
Effects on target gene expression of the K-ras/Mapk/Akt and Wnt signalling pathways
Previous studies have shown that when mutant K-rasVal12 transgene was introduced into either mouse embryonic stem cells or K-rasVal12/Cre/Msh2−/− transgenic mice, the expression of human K-rasVal12 was associated with changes in the expression of a range of gene transcripts and proteins, including stem cell-associated genes, such as Pem, Tcl-1 and Trap, and with increased phosphorylation of Mapk and Akt pathway proteins, such as pErk1&2 and pAkt (Luo et al. 2007a,b;). Here, we used both immunohistochemistry, to show differences in target gene product expression in adenomas (Figure 5), and real-time quantitative reverse transcription PCR assays (Tables 1 and 2), to compare the relative RNA expression levels of a selected panel of genes between non-tumour-bearing normal large intestine (LI) and LITs of β-NF treated Cre mice, K-rasAsp12/Cre mice, K-rasAsp12/Cre/ApcMin/+ mice and ApcMin/+ control mice. Compared with the Ah-Cre control mice LI, target genes of the Mapk signalling pathway, such as VEGF, Cox2, Trap, p70S6K and cyclinD2, showed significant increases in relative expression levels by real-time qRT-PCR in the normal colonic tissues of K-rasAsp12/Cre mice. Normal LI from ApcMin/+ mice showed a significant increase in relative expression levels of Cox2, uPA, Trap and β-Catenin compared with that in the normal LI tissues of Cre mice. In large intestinal tumours from ApcMin/+ mice, there were significant increases in the relative expression levels of CD44, p70S6K and gastrin. Compared with ApcMin/+ mice LITs, the LITs from K-rasAsp12/Cre/ApcMin/+ mice showed significant increases in CD44 (1.6-fold), cyclinD2 (4.8-fold), gastrin (5.7-fold), VEGF (2.8-fold), Pem (10-fold), Tcl-1 (6.8-fold) and Trap (19-fold). Immunohistochemistry confirmed mild increases in protein expression of gastrin and VEGF genes in the LITs from K-rasAsp12/Cre/ApcMin/+ mice compared with those of ApcMin/+ mice, and suggested small increases in expression of Cox2, β-Catenin and Tiam1. Immunohistochemical staining confirmed increased expression of the phosphorylated forms of the downstream phosphoprotein effectors of the Mapk and Akt signalling pathways, including pErk1&2 and pAkt, in the LITs of K-rasAsp12/Cre/ApcMin/+ mice compared with those of ApcMin/+ mice, but little of evidence of changed expression of pGSK-3beta (Figure 5). Hence, there was evidence of activation of both Mapk and Akt signalling pathways in the LITs of K-rasAsp12/Cre/ApcMin/+ mice as well as up-regulation of certain other gene targets of the Wnt/Apc pathway.
Figure 5.

Immunohistochemical analysis of intestinal adenomas. Large intestinal tumours from ApcMin/+ mice (Min-LIT) and from K-rasAsp12/Cre/ApcMin/+ transgenic mice (K-ras-Min-LIT) were analysed immunohistochemically for expression of pAkt, pErk 1, 2, pGSK, gastrin, VEGF, β-catenin, Tiam1 and Cox2.
Table 2.
Relative expression levels for selected genes by real-time quantitative reverse transcription polymerase chain reaction
| Gene | C LI Ave (3) | C LI SD | K/C LI Ave (3) | K/C LI SD | K/C vs. C LI t-test | M LI Ave (3) | M LI SD | M vs. C LI t-test | M LIT Ave (4) | M LIT SD | M-LIT vs. M-LI t-test | K/C/M LIT Ave (5) | K/C/M LIT SD | K/C/M-LIT vs. M-LIT t-test |
|---|---|---|---|---|---|---|---|---|---|---|---|---|---|---|
| CD44 | 1.52 | 0.66 | 3.53 | 1.11 | 0.091 | 1.21 | 0.22 | 0.182 | 2.54 | 0.52 | 0.005 | 4.05 | 1.52 | 0.050 |
| cyclin D2 | 1.06 | 0.59 | 2.65 | 0.18 | 0.024 | 2.75 | 1.50 | 0.124 | 3.39 | 2.65 | 0.364 | 16.42 | 4.51 | 0.001 |
| PP1A | 1.12 | 0.27 | 1.90 | 1.18 | 0.156 | 2.34 | 2.15 | 0.230 | 2.90 | 1.91 | 0.366 | 3.51 | 2.37 | 0.344 |
| PP2A | 0.88 | 0.10 | 2.70 | 1.45 | 0.085 | 1.38 | 0.94 | 0.206 | 3.21 | 1.38 | 0.053 | 3.57 | 1.37 | 0.354 |
| Axin-2 | 1.80 | 0.71 | 1.98 | 0.85 | 0.406 | 2.16 | 0.99 | 0.372 | 2.52 | 0.46 | 0.274 | 4.35 | 2.08 | 0.066 |
| p70S6K | 0.95 | 0.34 | 3.37 | 1.24 | 0.039 | 0.69 | 0.13 | 0.117 | 4.34 | 2.69 | 0.035 | 6.32 | 3.45 | 0.189 |
| E-cadherin | 1.56 | 0.66 | 2.34 | 1.045 | 0.174 | 2.78 | 1.45 | 0.060 | 3.16 | 2.68 | 0.418 | 6.79 | 3.67 | 0.072 |
| p21 | 1.51 | 0.46 | 1.41 | 1.66 | 0.453 | 3.07 | 1.25 | 0.055 | 3.04 | 2.84 | 0.495 | 3.76 | 3.38 | 0.373 |
| Igfbp4 | 1.39 | 0.96 | 2.19 | 1.62 | 0.294 | 3.08 | 2.49 | 0.117 | 2.56 | 1.27 | 0.365 | 10.70 | 12.57 | 0.122 |
| Cox2 | 0.89 | 0.11 | 2.73 | 0.54 | 0.011 | 3.73 | 1.23 | 0.033 | 5.65 | 3.83 | 0.226 | 13.46 | 10.67 | 0.105 |
| TCF-4 | 1.03 | 0.31 | 1.48 | 0.65 | 0.241 | 1.74 | 1.03 | 0.117 | 1.64 | 1.03 | 0.450 | 1.77 | 0.96 | 0.422 |
| uPA | 1.42 | 0.52 | 2.79 | 0.55 | 0.075 | 1.90 | 0.77 | 0.043 | 4.47 | 4.12 | 0.173 | 7.91 | 2.45 | 0.081 |
| gastrin | 0.93 | 0.50 | 0.73 | 0.29 | 0.301 | 0.96 | 0.19 | 0.471 | 1.58 | 0.40 | 0.030 | 8.41 | 6.81 | 0.044 |
| VEGF | 0.98 | 0.05 | 2.02 | 0.43 | 0.032 | 1.50 | 0.47 | 0.091 | 1.68 | 0.26 | 0.269 | 4.65 | 1.42 | 0.002 |
| Tiam1 | 1.18 | 0.92 | 1.16 | 0.15 | 0.484 | 1.34 | 1.12 | 0.256 | 3.74 | 3.40 | 0.151 | 3.74 | 3.87 | 0.500 |
| cyclin D1 | 0.85 | 0.17 | 0.88 | 0.24 | 0.432 | 1.98 | 0.87 | 0.099 | 3.76 | 2.00 | 0.108 | 2.02 | 1.09 | 0.069 |
| MMP7 | 0.60 | 0.41 | 1.86 | 0.97 | 0.090 | 0.67 | 0.46 | 0.074 | 1.24 | 0.77 | 0.157 | 1.28 | 0.72 | 0.468 |
| c-Myc | 1.10 | 0.70 | 1.72 | 0.47 | 0.123 | 1.76 | 1.27 | 0.127 | 3.35 | 2.97 | 0.217 | 3.37 | 2.24 | 0.495 |
| PPARd | 1.46 | 0.97 | 1.21 | 0.24 | 0.375 | 1.72 | 1.36 | 0.211 | 1.13 | 0.56 | 0.227 | 1.73 | 1.13 | 0.183 |
| Eph | 1.12 | 0.57 | 0.79 | 0.17 | 0.231 | 2.06 | 1.63 | 0.152 | 3.79 | 3.16 | 0.216 | 2.35 | 1.42 | 0.194 |
| Pem | 1.31 | 1.08 | 2.11 | 2.12 | 0.335 | 2.12 | 1.51 | 0.171 | 1.87 | 1.44 | 0.417 | 18.95 | 12.66 | 0.017 |
| Tcl 1 | 1.77 | 1.81 | 3.39 | 3.71 | 0.311 | 1.28 | 1.26 | 0.131 | 2.33 | 1.25 | 0.162 | 15.87 | 10.17 | 0.017 |
| Trap | 0.69 | 0.27 | 5.85 | 3.05 | 0.050 | 1.90 | 0.31 | 0.007 | 0.93 | 0.84 | 0.060 | 17.81 | 6.45 | 0.001 |
| β-catenin | 0.93 | 0.08 | 1.12 | 0.29 | 0.228 | 2.65 | 0.85 | 0.031 | 2.67 | 0.43 | 0.479 | 2.51 | 0.58 | 0.328 |
Note abbreviations: C, Cre genotype; K/C, K-rasAsp12/Cre genotype; M, ApcMin/+ genotype; K/C/M, K-rasAsp12/Cre/ApcMin/+ genotype; LI, large intestine; LIT, large intestinal tumour; Ave, average value; (n), number of samples analysed given in brackets; t-test, Student’s t-test; P value; statistically significant Student’s t-test P values highlighted in bold.
Hierarchical cluster analysis of the relative expression level data determined by real-time qRT-PCR for the selected target genes showed that the 24 genes were differentially expressed in the normal LI tissues from Cre mice, K-rasAsp12/Cre mice, ApcMin/+ mice and K-rasAsp12/Cre/ApcMin/+ mice and in the large intestinal tumours (LITs) of ApcMin/+ mice and of K-rasAsp12/Cre/ApcMin/+ mice, and that there was clear evidence of clustering broadly together of expression patterns in LI tissues and LITs from mice of the same genotypes (Figure 6). Taken together with the relative expression levels, these cluster patterns indicate that expression of mutated K-ras within mutant Apc-initiated large intestinal tumours consistently and selectively modulated the expression levels of certain target genes in both the K-ras/MapK/Akt and the Wnt/Apc pathways.
Figure 6.

Hierarchical cluster analysis of the differential expression patterns of 24 genes in normal colon and large intestinal tumours. Normal large intestine (LI) tissues from Cre (C), K-rasAsp12/Cre (K-C) and ApcMin/+ (M) mice and large intestinal tumours (LIT) from ApcMin/+ (M) and K-rasAsp12/Cre/ApcMin/+ (K-C-M) mice were analysed for the relative expression levels of 24 selected genes by real-time quantitative reverse transcription polymerase chain reaction (see Table 2): red represents marked overexpression; dark red/black represents mild over-expression and green represents unchanged or mildly decreased expression levels, with the fold-change shown according to the colour key of the row-Z score. T numbers refer to individual samples. There is a pattern of clustering broadly together of LI tissues and LITs from mice of the same genotypes indicating mostly consistent gene expression changes.
Discussion
Human colorectal neoplasia involves transitions from normal to adenoma to carcinoma associated with accumulation of genetic and epigenetic changes in a multistep process, including activation of K-ras by somatic mutation within one or a small number of stem cells located in the intestinal crypt (Fearon et al. 1987; Wood et al. 2007). K-ras mutations have been found in aberrant crypt foci (ACF), early and established adenomas, as well as in cancer-predisposed morphologically normal colon (Morris et al. 1996; Malumbres & Barbacid 2003). Aberrant crypt foci (ACF) have been shown to contain K-ras mutations, with little or no evidence for mutations in either Apc or its downstream effector β-catenin (Takayama et al. 2001). Several attempts have been made to develop murine models of mutated K-ras to investigate the role of K-ras mutation in the development of intestinal neoplasia, with variable and contradictory results. Transgenic expression of mutant K-rasVal12 in the small intestine in post-mitotic villus enterocytes under the control of the rat liver fatty acid binding protein gene 1 (Fabp1) promoter caused intestinal dysplasia, but the authors did not observe any tumours, with mutant K-ras expressed in cells of the villus which are exfoliated every 2–3 days, thereby quickly eliminating these mutant cells before tumourigenesis can occur (Kim et al. 1993). Johnson et al. (2001) used a transgenic model, in which the recombinational activation of the mutant K-ras was generated at random by recombination occurring within the manipulated allele and these mice were predisposed to a range of tumour types, predominantly early onset lung cancer, but the transgenic mice failed to develop intestinal tumours. According to the authors, this may have been due either to tissue-specific differences in the frequency of recombination events, or to the relative order of ras gene mutations in the course of intestinal tumourigenesis (Johnson et al. 2001). Janssen et al. (2002) constructed mice with a mutated K-ras gene associated with the regulatory region of the murine villin promoter, and these villin-K-rasVal12 mice developed just two tumours over 6 months (Janssen et al. 2002), but the villin promoter is active during murine embryonic development (Robine et al., 1985; Ezzell et al. 1989). Crossing these villin-K-rasVal12 mice (with constitutive expression of human K-rasVal12 4B isoform) with Apc1638N mice on a crossbred background resulted in intestinal adenoma formation with some carcinomas and there was evidence of Erk activation, but not Akt activation in intestinal epithelium (Janssen et al. 2006). Sansom et al. (2006) showed that mice with inducible expression (via Ah-Cre) of endogenous K-rasVal12 4A and 4B isoforms, when crossed with Apcfl580 mice on a crossbred background, developed intestinal adenomas with some carcinomas, with some focal Erk activation. Whereas Haigis et al. (2008) showed that mice with constitutive expression (via Fabpl-Cre) of endogenous K-rasAsp12 4A and 4B isoforms, when crossed with Apc2lox14 mice on a crossbred background, also formed intestinal adenomas with some carcinomas, but with no evidence of Erk activation. However, Calcagno et al. (2008) suggested that K-rasAsp12 may initiate intestinal neoplasia more in the proximal colon, with some evidence of increased Erk signalling.
To address the questions whether activated K-rasAsp12 is able to initiate intestinal tumour formation or rather depends on previous mutations of the ‘gatekeeper’ gene Apc, and whether such oncogenic activity is greater in the small or large intestines, we used a Cre/LoxP-based transgenic system with expression of the Cre recombinase under control of the Ah promoter, which allows activation of Cre expression in the adult intestinal crypt stem cells with precise spatial–temporal control (Ireland et al. 2004). Using K-rasAsp12/Cre mice treated with βNF to trigger Cre-mediated recombination and expression of mutated K-rasAsp12 in small and large intestinal epithelium, we found that only two of 25 mice developed adenomas in the intestines over 2 years and, therefore, the K-rasAsp12 mutation alone did not significantly initiate adenoma formation in the intestines. A very small (and non-significant) number of sarcomas and lymphomas also developed in other tissues. There may have been a very low frequency of sporadic ‘leaky’ activation of the Ah-Cre transgene leading to Cre recombinase expression and LoxP site recombination to trigger mutant K-ras expression as a rare event in connective tissue or lymphoid stem cells. However, the small and large intestines were demonstrated to express mutated K-rasAsp12, but appeared unable to initiate intestinal tumour formation as this may require other (possibly multiple) spontaneous mutations in addition. This is consistent with the hypothesis that a contribution from activated K-ras to intestinal tumour progression may not occur without the requirement of mutations to other tumour suppressor genes, such as Apc (Janssen et al. 2006; Sansom et al. 2006; Haigis et al. 2008).
It is generally accepted that adenomas develop in the intestines of patients with FAP or in Min mice when an appropriate cell acquires a somatic mutation or deletion of the wild-type Apc allele to accompany the pre-existing germ-line Apc mutation. A polyclonal model of adenoma formation has also been suggested. Although the initiating role of Apc mutation is part of most models of colorectal tumourigenesis, it is not clear whether bi-allelic Apc mutations are sufficient for the growth of early lesions to form established colorectal adenomas or whether there is a requirement for mutations at other loci, such as K-ras (Chen et al. 2004). Sansom et al. (2006) and Haigis et al. (2008) have shown synergistic co-operation between mutant K-ras and mutant Apc in kidney tumour formation as well as in intestinal tumourigenesis.
Here, we have shown that when Ah-Cre-mediated activation of expression of mutated K-ras is targeted to the adult intestinal crypt epithelial stem cells, K-rasAsp12 does accelerate intestinal adenoma formation on a background of inherited Apc mutation and the offspring bearing K-rasAsp12/Cre/ApcMin/+ mutations showed decreased survival with significant reductions in the average lifespan and significant increases in the numbers of both small (1.5-fold) and large (5.7-fold) intestinal adenomas, with the higher increase seen in the number of large intestinal tumours, more closely mimicking the human situation. Thus, this evidence shows that mutated K-rasAsp12 drives progression, but not initiation, of intestinal adenoma formation with greater effects on the large intestine.
Expression analysis of the large intestinal tumours from the K-rasAsp12/Cre/ApcMin/+ mice, by both immunohistochemistry and real-time quantitative RT-PCR, showed that mutant K-rasAsp12 modulates the expression of some target genes of the Mapk, Akt and Wnt pathways. There is immunohistochemical evidence of increased expression of the phosphorylated forms of the downstream effectors of the Mapk and Akt signalling pathways, including pErk1&2 and pAkt, in the LITs of K-rasAsp12/Cre/ApcMin/+ mice compared with those of ApcMin/+ mice, confirming activation of both Mapk and Akt signalling pathways in these tumours. Immunohistochemistry also suggested a mild increase in expression of β-catenin protein, with no significant changes in transcript levels, indicating post-translational regulation of protein levels. Mutant K-ras has previously been shown to induce the activity of a T cell factor 4 (Tcf-4) reporter construct in Caco-2 and HeLa cells, leading to stabilization of the levels of nuclear β-catenin and the formation of nuclear β-catenin/Tcf-4 complexes. Mutant K-ras has been shown to stimulate Wnt signalling in colonic cancer through inhibition of GSK-3beta (Li et al. 2005). Mapk/Erk pathway co-operation with Wnt signalling pathway could occur at multiple levels, including via Wnt3a and β-catenin/Tcf-4-dependent gene transcriptional events. Wnt3a stimulated G1/S phase cell cycle progression and this stimulation was reduced by an Erk pathway inhibitor, indicating that Wnt3a promotes proliferation by stimulating the Erk pathway (Yun et al. 2005;Kim et al. 2007).
In intestinal tumours from the K-rasAsp12/Cre/ApcMin/+ mice, mutated K-ras further enhanced expression of VEGF compared with that seen in ApcMin/+ mouse adenomas. Vascular endothelial growth factor (VEGF) is a key regulator of tumour angiogenesis, and angiogenesis is not only restricted to advanced stages of tumour development, but is also observed in benign intestinal adenomas, and VEGF can also modulate cellular proliferation, transformation and tumour growth. Mutant K-ras up-regulated the expression of VEGF in this model and this has been shown previously to occur in a K-ras/Erk-dependent and Wnt-dependent manner (Jung et al.1999;Zhang et al. 2001).
The expression of gastrin, as a tumour growth factor, is significantly increased in some colorectal cancers compared with the low levels found in normal colonic mucosa. Oncogenic ras has been shown to induce gastrin gene expression through activation of the Raf-MEK-ERK signal transduction pathway (Nakata et al. 1998; Koh et al. 2000). The Wnt signalling pathway moderately stimulates the gastrin gene promoter, and Chakladar et al. (2005) found a strong (25- to 40-fold) synergistic stimulation of the gastrin promoter by the combination of oncogenic β-catenin and K-ras overexpression. Deletion analysis localized the response element to an area between −140 and −110 bp upstream of the murine gastrin promoter. Electrophoretic mobility shift assays detected a complex containing β-catenin/Tcf, AP1, and Smad3/4 transcription factors that bound to a DNA element through AP1 and Smad binding sites. Gastrin promoter activation could be further enhanced or suppressed by the co-expression of wild type Smad4 or a dominant negative mutant of Smad4, and thus oncogenic Wnt and Ras signalling pathways can synergistically induce enhanced gastrin expression (Chakladar et al. 2005). ApcMin/+ mice that overexpress one of the alternatively processed forms of gastrin, known as glycine-extended gastrin, show a significant increase in intestinal adenoma number. Conversely, gastrin-deficient ApcMin/+ mice showed a marked decrease in intestinal adenoma number and a significantly decreased adenoma proliferation rate (Koh et al. 2000). Thus, the real-time qRT-PCR and immunohistochemical data from this study showing that mutated K-ras induced enhanced expression of gastrin in the adenomas from K-rasAsp12/Cre/ApcMin/+ mice compared that of ApcMin mice is consistent with these published data.
Cyclo-oxygenase-2 (Cox2) has been shown to play a role in the development of intestinal tumours, and Cox2 levels are elevated in approximately 80–90% of human colorectal carcinomas. Here, we showed increased Cox2 expression in the large intestine of K-rasAsp12/Cre mice and ApcMin/+ mice relative to colon from control Cre mice, with some immunohistochemical evidence of increased Cox2 expression in adenomas from K-rasAsp12/Cre/ApcMin/+ mice. Mutated K-ras is associated with increased levels of Cox2 expression in colorectal carcinomas (Okawa et al. 2004). Cyclo-oxygenase 2 (Cox2) expression is regulated via the ras signalling pathway, and induction of mutated ras rapidly increases Cox2 protein levels in intestinal epithelial cells. Akt (also known as protein kinase B) is an important effector of Ras protein signalling and a critical component of mutant ras-mediated transformation. K-ras-mediated increase in cyclo-oxygenase-2 mRNA stability involves activation of the protein kinase B1 (Sheng et al. 2001). A Tcf-4-binding element (TBE) in the Cox2 promoter has been identified that specifically binds to Tcf-4 protein in an electrophoretic mobility shift assay. Although β-catenin alone did not increase Cox2 protein to detectable levels in HuH7 cells, co-expression of both mutant β-catenin and mutant K-ras increased Cox2 protein expression levels (Araki et al. 2003).
We showed some evidence of increased immunohistochemical expression of Tiam1 (T lymphoma invasion and metastasis 1 gene) in K-rasAsp12/Cre/ApcMin/+ mouse adenomas. T-cell lymphoma invasion and metastasis 1 (Tiam1) has been shown to be an important effector pathway for some of the effects of mutated K-ras. Tiam1−/− mice were shown to be resistant to the development of mutant ras-induced skin tumours following treatment with the carcinogen 7, 12-dimethylbenzanthracene and promoter 12-O-tetra-decanoylphorbol-13-acetate. Moreover, the few tumours produced in Tiam1−/− mice grew more slowly than those in wild-type mice. T-cell lymphoma invasion and metastasis 1 (Tiam1)-deficient primary embryonic fibroblasts were also resistant to rasVal12-induced focus formation. Hence, Tiam1 was shown to be a critical regulator of ras-induced tumour formation (Malliri et al. 2002, 2006; Baines et al. 2005). T-cell lymphoma invasion and metastasis 1 (Tiam1) is also a Wnt-responsive gene expressed in the base of intestinal crypts and up-regulated in Min mouse intestinal adenomas and human colonic adenomas. Moreover, by comparing intestinal tumour development in Apc mutant Min mice expressing or lacking Tiam1, it was found that Tiam1 deficiency significantly reduced the formation and growth of intestinal tumours in vivo (Malliri et al. 2006).
In conclusion, expression of K-rasAsp12 alone in the stem cell compartment of the adult intestinal crypt does not significantly initiate adenoma formation, confirming our previous findings for K-rasVal12 (Luo et al. 2007a) and those of others (Janssen et al. 2006; Sansom et al. 2006). When crossed on to an ApcMin/+ background, the compound mutant K-ras/Cre/ApcMin/+ mice showed acceleration of intestinal tumour formation, similar to that shown by others crossing mutant K-ras and Apc mice (Janssen et al. 2006; Sansom et al. 2006; Calcagno et al. 2008; Haigis et al. 2008). Although others have shown that the formation of large intestinal adenomas can occur after crossing mutant K-ras and Apc mice (Calcagno et al. 2008; Haigis et al. 2008), this study demonstrates the impressive 5.7-fold increase in numbers of adenomas in the large intestine compared with the 1.5-fold increase in the small intestine, more closely mimicking the human situation. However, whereas others have not shown clear evidence of activation of both Mapk/Akt and Wnt/Apc signalling pathways in the intestinal tumours, the tumour expression studies here showed that mutant K-ras increased activation of Mapk and Akt signalling pathway targets pErk and pAkt, increased expression of the cell cycle entry marker cyclinD2 and the stem cell markers Pem, Tcl-1 and Trap, previously shown to be activated by mutant K-ras (Luo et al. 2007a,b;), as well as increasing the relative gene expression levels of certain Wnt pathway targets, such as VEGF, gastrin, Cox2 and Tiam1. Other Wnt pathway target genes such as Peroxisome proliferator-activated receptor delta (PPARd), Matrix Metalloproteinase 7 (MMP7), PP1A and c-myc remained unchanged in compound in mutant K-ras/Cre/ApcMin/+ mouse adenomas compared with ApcMin/+ control mouse tumours. Cluster analysis showed a consistent pattern of changes in gene expression in these tumours from K-rasAsp12/Cre/ApcMin/+ mice, confirming synergistic activity of mutant K-ras and mutant Apc on their signalling pathways, as previously suggested by others in different experimental systems, but demonstrated here in the large intestinal adenomas forming in vivo. Thus, these data showed that intestinal expression of K-rasAsp12 accelerates Apc-initiated intestinal adenomagenesis in vivo with the greater effect on the large intestine and provides an improved mechanistic insight showing that this may be, at least in part, due to synergistic co-operation between the K-ras/Mapk/Akt and Wnt/Apc pathways resulting in the up-regulation of certain genes.
Acknowledgments
We thank Maggie Green, Clive Lebozer and Xinping Gong (Department of Pathology, University of Cambridge) for technical assistance. This work was supported by grants from CR-UK.
References
- Al-Aynati MM, Radulovich N, Riddell RH, Tsao MS. Epithelial-cadherin and beta-catenin expression changes in pancreatic intraepithelial neoplasia. Clin. Cancer Res. 2004;10:1235–1240. doi: 10.1158/1078-0432.ccr-03-0087. [DOI] [PubMed] [Google Scholar]
- Andreyev HJ, Norman AR, Cunningham D, Oates JR, Clarke PA. Kirsten ras mutations in patients with colorectal cancer: the multicenter “RASCAL” study. J. Natl. Cancer Inst. 1998;90:675–684. doi: 10.1093/jnci/90.9.675. [DOI] [PubMed] [Google Scholar]
- Andreyev HJ, Norman AR, Cunningham D, et al. Kirsten ras mutation in patients with colorectal cancer: the “RASCAL II” study. Br. J. Cancer. 2001;85:692–696. doi: 10.1054/bjoc.2001.1964. [DOI] [PMC free article] [PubMed] [Google Scholar]
- Araki Y, Okamura S, Hussain SP, et al. Regulation of cyclooxygenase-2 expression by the Wnt and ras pathways. Cancer Res. 2003;63:728–734. [PubMed] [Google Scholar]
- Arends MJ, Frayling I. Mismatch repair deficiency in hereditary and sporadic colorectal cancer. In: Cunningham D, Topham C, Miles A, editors. The Effective Management of Colorectal Cancer. 4th edn. London: Aesculapius Medical Press; 2005. pp. 25–40. pp Chapter 2. [Google Scholar]
- Arends MJ, McGregor AH, Toft NJ, Brown EJ, Wyllie AH. Susceptibility to apoptosis is differentially regulated by c-myc and mutated Ha-ras oncogenes and is associated with endonuclease availability. Br. J. Cancer. 1993;68:1127–1133. doi: 10.1038/bjc.1993.492. [DOI] [PMC free article] [PubMed] [Google Scholar]
- Arends MJ, McGregor AH, Wyllie AH. Apoptosis is inversely related to necrosis and determines net growth in tumours bearing constitutively expressed myc, ras, and HPV oncogenes. Am. J. Pathol. 1994;144:1045–1057. [PMC free article] [PubMed] [Google Scholar]
- Baines AT, Lim Kh, Shields JM, et al. Use of retrovirus expression of interfering RNA to determine the contribution of activated K-ras and ras effector expression to human tumour cell growth. Methods Enzymol. 2005;407:556–574. doi: 10.1016/S0076-6879(05)07045-X. [DOI] [PubMed] [Google Scholar]
- Barbacid M. Ras genes. Annu. Rev. Biochem. 1987;56:779–827. doi: 10.1146/annurev.bi.56.070187.004023. [DOI] [PubMed] [Google Scholar]
- Bos JL, Fearon ER, Hamilton SR, et al. Prevalence of ras gene mutations in human colorectal cancers. Nature. 1987;327:293–297. doi: 10.1038/327293a0. [DOI] [PubMed] [Google Scholar]
- Brooks DG, James RM, Patek CE, Williamson J, Arends MJ. Mutant K-ras enhances apoptosis in embryonic stem cells in combination with DNA damage and is associated with increased levels of p19 ARF. Oncogene. 2001;20:2144–2152. doi: 10.1038/sj.onc.1204309. [DOI] [PubMed] [Google Scholar]
- Calcagno SR, Li S, Colon M, et al. Oncogenic K-ras promotes early carcinogenesis in the mouse proximal colon. Int. J. Cancer. 2008;122:2462–2470. doi: 10.1002/ijc.23383. [DOI] [PMC free article] [PubMed] [Google Scholar]
- Chakladar A, Dubeykovskiy A, Wojtukiewicz LJ, Pratap J, Lei S, Wang TC. Synergistic activation of the murine gastrin promoter by oncogenic Ras and beta-catenin involves SMAD recruitment. Biochem. Biophys. Res. Commun. 2005;336:190–196. doi: 10.1016/j.bbrc.2005.08.061. [DOI] [PubMed] [Google Scholar]
- Chen LC, Hao CY, Chiu YS, et al. Alteration of gene expression in normal-appearing colon mucosa of APCMin mice and human cancer patients. Cancer Res. 2004;64:3694–3700. doi: 10.1158/0008-5472.CAN-03-3264. [DOI] [PubMed] [Google Scholar]
- D’Abaco GM, Whitehead RH, Burgess AW. Synergy between Apc min and an activated ras mutation is sufficient to induce colon carcinomas. Mol. Cell. Biol. 1996;16:884–891. doi: 10.1128/mcb.16.3.884. [DOI] [PMC free article] [PubMed] [Google Scholar]
- Eisen MB, Spellman PT, Brown PO, Botstein D. Cluster analysis and display of genome-wide expression patterns. Proc. Natl. Acad. Sci. U.S.A. 1998;95:14863–14868. doi: 10.1073/pnas.95.25.14863. [DOI] [PMC free article] [PubMed] [Google Scholar]
- Ezzell RM, Chafel MM, Matsudaira PT. Differential localization of villin and fimbrin during development of the mouse visceral endoderm and intestinal epithelium. Development. 1989;106:407–419. doi: 10.1242/dev.106.2.407. [DOI] [PubMed] [Google Scholar]
- Fearon ER, Vogelstein B. A genetic model for colorectal tumourigenesis. Cell. 1990;61:759–767. doi: 10.1016/0092-8674(90)90186-i. [DOI] [PubMed] [Google Scholar]
- Fearon ER, Hamilton SR, Vogelstein B. Clonal analysis of human colorectal tumours. Science. 1987;238:193–197. doi: 10.1126/science.2889267. [DOI] [PubMed] [Google Scholar]
- Guerra C, Mijimolle N, Dhawahir A, et al. Tumor induction by an endogenous K-ras oncogene is highly dependent on cellular context. Cancer Cell. 2003;4:111–120. doi: 10.1016/s1535-6108(03)00191-0. [DOI] [PubMed] [Google Scholar]
- Haigis KM, Kendall KR, Wang Y, et al. Differential effects of oncogenic K-Ras and N-Ras on proliferation, differentiation and tumor progression in the colon. Nat. Genet. 2008;40:600–608. doi: 10.1038/ngXXXX. [DOI] [PMC free article] [PubMed] [Google Scholar]
- Ichii S, Takeda S, Horii A, et al. Detailed analysis of genetic alterations in colorectal tumours from patients with and without familial adenomatous polyposis (FAP) Oncogene. 1993;8:2399–2405. [PubMed] [Google Scholar]
- Ireland H, Kemp R, Houghton C, et al. Inducible Cre-medated control of gene expression in the murine gastrointestinal tract: effect of loss of β-catenin. Gastroenterology. 2004;126:1236–1246. doi: 10.1053/j.gastro.2004.03.020. [DOI] [PubMed] [Google Scholar]
- James RM, Arends MJ, Plowman S, et al. K-ras proto-oncogene exhibits tumour suppressor activity as its absence promotes tumourigenesis in murine teratomas. Mol. Cancer Res. 2003;1:820–825. [PubMed] [Google Scholar]
- Janssen KP, Marjou FE, Pinto D, et al. Targeted expression of oncogenic K-ras in intestinal epithelium cause spontaneous tumourigenesis in mice. Gastroenterology. 2002;123:492–504. doi: 10.1053/gast.2002.34786. [DOI] [PubMed] [Google Scholar]
- Janssen KP, Abala M, EI Marjou F, Louvard D, Robine S. Mouse models of K-ras-initiated carcinogenesis. Biochim. Biophys. Acta. 2005;1756:145–154. doi: 10.1016/j.bbcan.2005.07.004. [DOI] [PubMed] [Google Scholar]
- Janssen KP, Alberici P, Fsihi H, et al. APC and oncogenic KRAS are synergistic in enhancing Wnt signaling in intestinal tumor formation and progression. Gastroenterology. 2006;131:1096–1109. doi: 10.1053/j.gastro.2006.08.011. [DOI] [PubMed] [Google Scholar]
- Johnson L, Mercer K, Greenbaum D, et al. Somatic activation of the K-ras oncogene causes early onset lung cancer in mice. Nature. 2001;410:1111–1116. doi: 10.1038/35074129. [DOI] [PubMed] [Google Scholar]
- Johnson NA, Hamoudi RA, Ichimura K, et al. Application of array CGH on archival formalin-fixed paraffin-embedded tissues including small numbers of microdissected cells. Lab. Invest. 2006;86:968–978. doi: 10.1038/labinvest.3700441. [DOI] [PMC free article] [PubMed] [Google Scholar]
- Jung YD, Nakano K, Liu W, Gallick G, Ellis L. Extracellular signal-regulated kinase activation is required for up-regulation of vascular endothelial growth factor by serum starvation in human colon carcinoma cells. Cancer Res. 1999;59:4804–4807. [PubMed] [Google Scholar]
- Kim SH, Roth KA, Moser AR, Gordon JI. Transgenic mouse models that explore the multistep hypothesis of intestinal neoplasia. J. Cell Biol. 1993;123:877–893. doi: 10.1083/jcb.123.4.877. [DOI] [PMC free article] [PubMed] [Google Scholar]
- Kim SE, Lee WJ, Choi KY. The PI3 kinase-Akt pathway mediates Wnt3a-induced proliferation. Cell. Signal. 2007;19:511–518. doi: 10.1016/j.cellsig.2006.08.008. [DOI] [PubMed] [Google Scholar]
- Koh T, Bulitta C, Fleming J, Dockray G, Varro A, Wang T. Gastrin is a target of the ß-catenin/TCF-4 growth-signaling pathway in a model of intestinal polyposis. J Clin. Invest. 2000;106:533–539. doi: 10.1172/JCI9476. [DOI] [PMC free article] [PubMed] [Google Scholar]
- Levy DB, Smith KJ, Beazer-Barclay Y, Hamilton SR, Vogelstein B, Kinzler KW. Inactivation of both APC alleles in human and mouse tumours. Cancer Res. 1994;54:5953–5958. [PubMed] [Google Scholar]
- Li J, Mizukami Y, Zhang X, Jo WS, Chung DC. Oncogenic K-ras stimulates Wnt signaling in colon cancer through inhibition of GSK-3 beta. Gastroenterology. 2005;128:1907–1918. doi: 10.1053/j.gastro.2005.02.067. [DOI] [PubMed] [Google Scholar]
- Luo F, Brooks DG, Ye H, et al. Conditional expression of mutated K-ras accelerates intestinal tumourigenesis in Msh2-deficient mice. Oncogene. 2007a;26:4415–4427. doi: 10.1038/sj.onc.1210231. [DOI] [PubMed] [Google Scholar]
- Luo F, Hamoudi R, Brooks DG, Patek CE, Arends MJ. Stem cell gene expression changes induced specifically by mutated K-ras. Gene Expr. 2007b;14:101–115. doi: 10.3727/105221607783417583. [DOI] [PMC free article] [PubMed] [Google Scholar]
- Maher J, Baker DA, Manning M, Dibb NJ, Roberts IAG. Evidence for cell-specific differences in transformation by N-, H- and K-ras. Oncogene. 1995;11:1639–1647. [PubMed] [Google Scholar]
- Malliri A, van der kammen RA, Clark K, van der Valk M, Michiels F, Collard J. Mice deficient in the Rac activator Tiam1 are resistant to Ras-induced skin tumours. Nature. 2002;417:867–871. doi: 10.1038/nature00848. [DOI] [PubMed] [Google Scholar]
- Malliri A, Rygiel TP, van der Kammen RA, et al. The rac activator Tiam1 is a Wnt-responsive gene that modifies intestinal tumor development. J. Biol. Chem. 2006;281:543–548. doi: 10.1074/jbc.M507582200. [DOI] [PubMed] [Google Scholar]
- Malumbres M, Barbacid M. RAS oncogenes: the first 30 years. Nat. Rev. Cancer. 2003;3:459–465. doi: 10.1038/nrc1097. [DOI] [PubMed] [Google Scholar]
- Morris RG, Curtis LJ, Romanowski P, et al. Ki-ras mutations in adenomas: a characteristic of cancer-bearing colorectal mucosa. J. Pathol. 1996;180:357–363. doi: 10.1002/(SICI)1096-9896(199612)180:4<357::AID-PATH710>3.0.CO;2-D. [DOI] [PubMed] [Google Scholar]
- Nakata H, Wang S-L, Chung DC, Westwick JK, Tillotson LG. Oncogenic ras induces gastrin gene expression in colon cancer. Gastroenterology. 1998;115:1144–1153. doi: 10.1016/s0016-5085(98)70085-x. [DOI] [PubMed] [Google Scholar]
- Ohnishi T, Tomita N, Monden T, et al. A detailed analysis of the role of K-ras gene mutation in the progression of colorectal adenoma. Br. J. Cancer. 1997;75:341–347. doi: 10.1038/bjc.1997.56. [DOI] [PMC free article] [PubMed] [Google Scholar]
- Okawa T, Yoshinaga K, Uetake H, et al. Cyclooxygenase-2 overexpression is related to polypoid growth and K-ras gene mutation in T1 colorectal carcinomas. Dis. Colon Rectum. 2004;47:1915–1921. doi: 10.1007/s10350-004-0684-y. [DOI] [PubMed] [Google Scholar]
- Otori K, Oda Y, Sugiyama K, et al. High frequency of K-ras mutations in human colorectal hyperplastic polyps. Gut. 1997;40:660–663. doi: 10.1136/gut.40.5.660. [DOI] [PMC free article] [PubMed] [Google Scholar]
- Powell S, Zilz N, Beazer-Barclay Y, et al. APC mutations occur early during colorectal tumourigenesis. Nature. 1992;359:235–237. doi: 10.1038/359235a0. [DOI] [PubMed] [Google Scholar]
- Robine S, Huet C, Moll R, et al. Can villin be used to identify malignant and undifferentiated normal digestive epithelial cells? Proc. Natl. Acad. Sci. U.S.A. 1985;24:8488–8492. doi: 10.1073/pnas.82.24.8488. [DOI] [PMC free article] [PubMed] [Google Scholar]
- Rustgi AK. Hereditary gastrointestinal polyposis and nonpolyposis syndromes. N. Engl. J. Med. 1994;331:1694–1702. doi: 10.1056/NEJM199412223312507. [DOI] [PubMed] [Google Scholar]
- Sansom OJ, Meniel V, Wilkins JA, et al. Loss of Apc allows phenotypic manifestation of the transforming properties of an endogenous K-ras oncogene in vivo. Proc. Natl. Acad. Sci. U.S.A. 2006;103:14122–14127. doi: 10.1073/pnas.0604130103. [DOI] [PMC free article] [PubMed] [Google Scholar]
- Sheng H, Shao J, Dubois RN. K-Ras-mediated increase in cyclooxygenase 2 mRNA stability involves activation of the protein kinase B1. Cancer Res. 2001;61:2670–2675. [PubMed] [Google Scholar]
- Shivapurkar N, Huang L, Ruggeri B, et al. K-ras and p53 mutations in aberrant crypt foci and colonic tumours from colon cancer patients. Cancer Lett. 1997;115:39–46. doi: 10.1016/s0304-3835(97)04709-5. [DOI] [PubMed] [Google Scholar]
- Sjöblom T, Jones S, Wood LD, et al. The consensus coding sequences of human breast and colorectal cancers. Science. 2006;314:268–274. doi: 10.1126/science.1133427. [DOI] [PubMed] [Google Scholar]
- Spandidos DA, Wilkie NM. Malignant transformation of early passage rodent cells by a single mutated human oncogene. Nature. 1984;310:469–475. doi: 10.1038/310469a0. [DOI] [PubMed] [Google Scholar]
- Su LK, Kinzler KW, Vogelstein B, et al. Multiple intestinal neoplasia caused by a mutation in the murine homolog of the APC gene. Science. 1992;256:668–670. doi: 10.1126/science.1350108. [DOI] [PubMed] [Google Scholar]
- Takayama T, Ohi M, Hayashi T, et al. Analysis of K-ras, APC, and beta-catenin in aberrant crypt foci in sporadic adenoma, cancer, and familial adenomatous polyposis. Gastroenterology. 2001;121:599–611. doi: 10.1053/gast.2001.27203. [DOI] [PubMed] [Google Scholar]
- Tuveson DA, Shaw AT, Willis NA, et al. Endogenous oncogenic K-ras(G12D) stimulates proliferation and widespread neoplastic and developmental defects. Cancer Cell. 2004;5:375–387. doi: 10.1016/s1535-6108(04)00085-6. [DOI] [PubMed] [Google Scholar]
- Wood LD, Parsons DW, Jones S, et al. The genomic landscapes of human breast and colorectal cancers. Science. 2007;318:1108–1113. doi: 10.1126/science.1145720. [DOI] [PubMed] [Google Scholar]
- Yun MS, Kim SE, Jeon SH, Lee JS, Choi KY. Both ERK and Wnt/beta-catenin pathways are involved in Wnt3a-induced proliferation. J. Cell Sci. 2005;118:313–322. doi: 10.1242/jcs.01601. [DOI] [PubMed] [Google Scholar]
- Zhang X, Gaspard JP, Chung DC. Regulation of vascular endothelial growth factor by the Wnt and K-ras pathways in colonic neoplasia. Cancer Res. 2001;61:6050–6054. [PubMed] [Google Scholar]