Abstract
OBJECTIVE
Insulin resistance is a major characteristic of type 2 diabetes and is causally associated with obesity. Inflammation plays an important role in obesity-associated insulin resistance, but the underlying mechanism remains unclear. Interleukin (IL)-10 is an anti-inflammatory cytokine with lower circulating levels in obese subjects, and acute treatment with IL-10 prevents lipid-induced insulin resistance. We examined the role of IL-10 in glucose homeostasis using transgenic mice with muscle-specific overexpression of IL-10 (MCK-IL10).
RESEARCH DESIGN AND METHODS
MCK-IL10 and wild-type mice were fed a high-fat diet (HFD) for 3 weeks, and insulin sensitivity was determined using hyperinsulinemic-euglycemic clamps in conscious mice. Biochemical and molecular analyses were performed in muscle to assess glucose metabolism, insulin signaling, and inflammatory responses.
RESULTS
MCK-IL10 mice developed with no obvious anomaly and showed increased whole-body insulin sensitivity. After 3 weeks of HFD, MCK-IL10 mice developed comparable obesity to wild-type littermates but remained insulin sensitive in skeletal muscle. This was mostly due to significant increases in glucose metabolism, insulin receptor substrate-1, and Akt activity in muscle. HFD increased macrophage-specific CD68 and F4/80 levels in wild-type muscle that was associated with marked increases in tumor necrosis factor-α, IL-6, and C-C motif chemokine receptor-2 levels. In contrast, MCK-IL10 mice were protected from diet-induced inflammatory response in muscle.
CONCLUSIONS
These results demonstrate that IL-10 increases insulin sensitivity and protects skeletal muscle from obesity-associated macrophage infiltration, increases in inflammatory cytokines, and their deleterious effects on insulin signaling and glucose metabolism. Our findings provide novel insights into the role of anti-inflammatory cytokine in the treatment of type 2 diabetes.
Type 2 diabetes is the most common metabolic disease in the world, affecting >250 million people, and is characterized by insulin resistance, dyslipidemia, and hyperglycemia (1–3). Skeletal muscle insulin resistance is a major characteristic of numerous metabolic disorders including diabetes, obesity, and HIV-associated lipodystrophy, and plays a primary role in the development of type 2 diabetes (4). Although the causal relationship between obesity and insulin resistance is widely accepted, the underlying mechanism remains complex and debatable (5). A concept (Randle's glucose–fatty acid cycle) introduced >40 years ago, which has since been modified, proposes that hyperlipidemia and fatty acids cause insulin resistance by downregulating insulin signaling and glucose metabolism in skeletal muscle (6–8). More recently, a new concept emerged stating that insulin resistance is associated with chronic low-grade inflammation (9). In this regard, proinflammatory cytokines, such as tumor necrosis factor (TNF)-α and interleukin (IL)-6, are elevated in obese, diabetic subjects and are shown to cause insulin resistance in humans and animals (10–12). In contrast, plasma levels of anti-inflammatory cytokine, IL-10, are positively related to insulin sensitivity in healthy subjects and are reduced in obese and diabetic subjects (13–15).
IL-10 is a Th2-type cytokine that is produced by a wide range of immunological cell types, including monocytes/macrophages, and it is a potent inhibitor of the proinflammatory cytokines and chemokines (16). Immunosuppressive effects of IL-10 involve both inhibition of cytokine synthesis (e.g., TNF-α, IL-6) and their biological activities on target cells (17). The intracellular signaling event affected by IL-10 involves nuclear translocation of the signal transducer and activator of transcription 3 (STAT3) and transcription of STAT3-responsive genes including SOCS3 (18). Previous studies examining the role of IL-10 in diabetes have been primarily directed toward the pancreatic β-cells and the pathogenesis of type 1 diabetes (19). IL-10 was shown to increase pancreatic β-cell functions in response to glucose in vitro, and IL-10 treatment significantly reduced insulitis and prevented diabetes onset in nonobese diabetic mice (20). In this regard, our recent study (21) was the first to report that IL-10 affects peripheral glucose metabolism and that cotreatment with IL-10 attenuates insulin resistance following acute lipid infusion. This preliminary observation suggests that IL-10 may be a positive regulator of insulin sensitivity, a notion that is consistent with other reports indicating that polymorphisms and haplotypes of the IL-10 promoter are associated with obesity and insulin resistance (22). Interestingly, a recent report from Lumeng et al. (23) demonstrated that adipose tissue macrophages from lean animals express polarization toward an alternatively activated state, and this was associated with increased expression of IL-10. This study further showed that IL-10 increases glucose uptake and protects against TNF-α–mediated insulin resistance in isolated adipocytes (23). However, the metabolic role of IL-10 in skeletal muscle, a major organ of glucose disposal, is unknown. Thus, we have generated transgenic mice with muscle-specific overexpression of IL-10 to investigate the role of IL-10 in glucose homeostasis. In this article, we demonstrate that IL-10–overexpressing mice are more insulin sensitive and are protected from diet-induced muscle insulin resistance partly due to IL-10–mediated attenuation of the macrophage and cytokine response and to increased insulin signaling in skeletal muscle.
RESEARCH DESIGN AND METHODS
Effects of IL-10 treatment on diet-induced obesity.
Male C57BL/6 mice at ∼10 weeks of age were purchased from The Jackson Laboratory and housed under controlled temperature and lighting with free access to food and water. To determine the effects of a 3-day IL-10 treatment on diet-induced insulin resistance, mice were fed a high-fat diet (HFD) (55% fat by calories; Harlan Teklad TD93075, Madison, WI) (supplementary Table in the online appendix [available at http://diabetes.diabetesjournals.org/cgi/content/full/db08-1261/DC1]) or standard diet (Harlan Teklad LM-485) for 3 weeks, and IL-10 (2 μg/day) or saline was administered using Alzet osmotic pumps during the last 3 days of the diet period (n = 5–8). Hyperinsulinemic-euglycemic clamps were performed in conscious mice at the end of feeding and IL-10 treatment. All procedures were approved by the institutional animal care and use committee at the University of Massachusetts Medical School, Pennsylvania State University College of Medicine, and Yale University School of Medicine.
Generation of muscle creatine kinase IL-10 mice.
In this transgenic model, the expression of mouse IL-10 was restricted to skeletal muscle by placing it under the control of a 1.3-kb segment of the mouse muscle creatine kinase (MCK) promoter (−1256MCK-3Emut) (24,25). To restrict the transgene expression to skeletal muscle and avoid any potential consequences of expression in cardiac muscle, we used a modified (3Emut) MCK promoter in which the three conserved E boxes were mutated. To facilitate construction of the transgene, we converted the most downstream in a series of BstEII sites in this promoter into a HindIII site using a PCR-based site-directed mutagenesis method (Stratagene, La Jolla, CA), which then allowed excision of the promoter from the plasmid of origin and subsequent insertion into a transgene expression vector designed by the molecular core of Yale Diabetes and Endocrinology Research Center. In this vector, sequences to be expressed were flanked downstream by a 2.2-kb segment of human growth hormone (hGH) sequences. The addition of the hGH exons and introns provides polyadenylation/termination signals and splice sites and has been shown to increase transgene expression efficiency; these sequences are not translated. A 550-bp cDNA for murine IL-10 (26) was then inserted immediately downstream of the promoter. The completed MCK(mut)-IL10-hGH transgene was excised with XhoI/NotI to exclude vector sequences, gel isolated, and purified using DEAE column elution and microdialysis.
Microinjection of SJL × C57BL/6 F2 oocytes with the purified transgene construct was carried out by the Yale Transgenic Mouse Facility. Founders were identified by PCR screening of tail biopsy lysates with primers specific for a 171-bp segment in the growth hormone sequences at the 3′ end of the transgene. Of 15 transgenic founder mice that were identified, 6 founders with strong expression of the transgene were backcrossed to C57BL/6 mice to generate MCK-IL10 mice and wild-type littermates on the C57 background. IL-10 expression levels were then evaluated in the transgenic F1 mice representing each of the founder lines by real-time quantitative PCR analysis of muscle RNA with primers for the growth hormone tag and primers for mouse glyceraldehyde 3-phosphate dehydrogenase serving as an internal control for signal normalization. Following birth and weaning, the F1 mice (MCK-IL10) showed no obvious anomalies, and they exhibited similar patterns of growth compared with the wild-type littermate controls. Transgenic F1 mice were selected based on high and low levels of IL-10 expression in skeletal muscle and were then backcrossed to C57BL/6 mice to generate the F2 mice. All of the metabolic characterization was performed using F5 and F6 mice from the low expressor lines.
Body composition analysis and metabolic cages.
Whole-body fat and lean mass were noninvasively measured in conscious mice using 1H-MRS (Echo Medical Systems, Houston, TX). A 3-day measurement of food intake, energy expenditure, respiratory exchange ratio, and physical activity were performed using the metabolic cages (TSE Systems, Bad Homburg, Germany).
Hyperinsulinemic-euglycemic clamps.
Following an overnight fast (∼15 h), a 2-h hyperinsulinemic (2.5 mU · kg−1 · min−1 with 150 mU/kg body wt priming)-euglycemic clamp was conducted in conscious mice with [3-3H]glucose and 2-deoxy-d-[1-14C]glucose to assess glucose metabolism in individual organs (21).
Molecular analysis for insulin signaling and inflammatory response in skeletal muscle.
Muscle samples were obtained at the end of clamps or at 15 min following insulin injection to measure in vivo insulin signaling activity using anti–insulin receptor substrate (IRS)-1 (Millipore, Billerica, MA) and Akt antibodies (Cell Signaling, Danvers, MA). For the following measurements, tissue samples were obtained from MCK-IL10 mice at basal state. Tissue-specific STAT3 protein expression and tyrosine phosphorylation were measured using STAT3 (p-Tyr705) antibody (Cell Signaling Technology, Beverly, MA) as previously described (27). For muscle CD68, C-C motif chemokine receptor (CCR)-2, phosphor–c-Jun NH2-terminal protein kinase (JNK) 1, and JNK1 protein levels, muscle tissues (50 mg) were prepared and polyclonal antibodies against CD68, CCR2, phospho-JNK1, and JNK1 (Santa Cruz Biotech, Santa Cruz, CA) were used. Local and serum levels of IL-10, IL-6, and TNF-α were measured using Immunoassay kits (Alpco Diagnostics, Salem, NH).
Immunofluorescence study.
Briefly, muscle samples were taken from the mouse, and their frozen sections were made. Tissue sections were fixed in acetone/methanol (1:3) for 10 min and washed with PBS plus Tween 20 (PBST) (10 mmol/l sodium phosphate, 150 mmol/l sodium chloride, 0.3% Tween 20, pH 7.8) two times. Tissue sections were blocked in PBST containing 5% goat serum for 1 h at room temperature and washed with PBST two times. Anti-F4/80 antibody (Abcam, Cambridge, MA) was used as a specific antibody for macrophage, and anti-IgG fluorescein isothiocyanate (FITC) (Sigma-Aldrich, St. Louis, MO) was used as a secondary antibody. Totals of 70, 80, and 100% ethanol were used for each 1 min for dehydration, and tissue sections were dried by air. Nuclei were stained with 4′,6-diamidino-2-phenylindole (VECTA Lab, Burlingame, CA), and fluorescence was analyzed using a fluorescence microscope.
Mononuclear cell preparation.
Quadriceps and gastrocnemius muscles from both hindlimbs of anesthetized mice were quickly isolated, minced, and transferred to a flask containing Dulbecco's modified Eagle's medium (DMEM) supplemented with 5% fetal bovine serum and 0.2% collagenase (Sigma-Aldrich). Tissues were incubated for 1 h at 37°C with gentle shaking, passed over a 70-μm filter, washed, and run over a 70/40 Percoll gradient to isolate mononuclear cells. Cells were washed, counted, and resuspended in DMEM/5% fetal bovine serum.
Flow cytometric analysis.
Single-cell suspensions were preincubated in 2.4G2 hybridoma supernatant to block FcγR binding for 15 min and then incubated with the following conjugated antibodies for 25 min on ice (B220-FITC, F4/80-PE, CD4-PerCPCy5′5, Gr1-PECy7, CD11b-APC, and CD8α-Pacific Blue). Antibodies used for flow cytometric analysis were purchased from Becton Dickinson (San Jose, CA) and Ebioscience (San Diego, CA). Cells were washed, fixed in 4% paraformaldehyde for 8 min, washed again, and then resuspended in fluorescence-activated cell sorting buffer (1× PBS/1.5% FCS/0.05% NaN3). Samples were analyzed on a Becton Dickinson LSRII flow cytometer. At least 20,000 events were collected for each sample, and data were analyzed using FlowJo software (Treestar, CA).
Statistical analysis.
Data are expressed as means ± SE. The significance of the difference in mean values was evaluated using a two-way ANOVA with Duncan's multiple-range test for post hoc analysis (STATISTICA; StatSoft) and the Student's t test, where applicable. The statistical significance was at the P < 0.05 level.
RESULTS
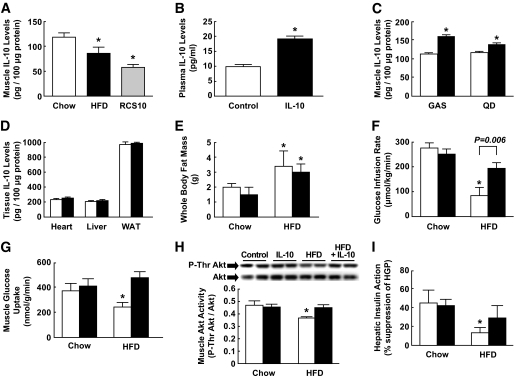
Muscle IL-10 levels were measured using enzyme-linked immunosorbent assay in C57BL/6 mice fed standard diet (control) or HFD and in obese RCS10 mice (28). Similar to the previous observations in humans (14,15), obese animals showed significantly lower IL-10 levels in muscle than lean animals (Fig. 1A).
FIG. 1.
IL-10 treatment protects against diet-induced insulin resistance in C57BL/6 mice. Mice were fed standard diet or HFD for 3 weeks, and IL-10 or saline (control) was treated for the last 3 days of diet period. A: Muscle IL-10 protein levels in standard diet– and HFD-fed C57BL/6 mice and in obese RCS10 mice. B: Plasma IL-10 levels following 3 days of chronic IL-10 delivery using osmotic pumps. C: IL-10 protein expression in gastrocnemius (GAS) and quadriceps (QD) muscle in IL-10–treated and control mice. □, Control; ■, IL-10 treated. D: Local IL-10 protein levels in heart, liver, and white adipose tissue (WAT) in IL-10–treated and control mice. □, Control; ■, IL-10 treated. E: Whole-body fat mass, measured using 1H-MRS, in standard diet– and HFD-fed mice following IL-10 or saline treatment. □, Control; ■, IL-10 treated. F: Glucose infusion rates during hyperinsulinemic-euglycemic clamps. G: Insulin-stimulated glucose uptake in skeletal muscle. H: Insulin-stimulated threonine phosphorylation of Akt and Akt protein levels in muscle. Muscle samples were obtained 15 min after insulin injection. I: Hepatic insulin action expressed as insulin-mediated percent suppression of basal hepatic glucose production (HGP). Values are means ± SE for five to eight mice in each experiment. *P < 0.05 vs. standard diet–fed mice or control mice without IL-10 treatment (A–D); *P < 0.05 vs. respective standard diet–fed mice (E–I). A Student's t test was used in A–D, and a two-way ANOVA was used in E–I for statistical analysis.
IL-10 treatment prevents diet-induced insulin resistance.
We have recently shown that cotreatment with IL-10 prevents muscle insulin resistance following an acute lipid infusion (21). In the current study, we determined the effects of a 3-day IL-10 treatment on diet-induced insulin resistance. IL-10 treatment increased circulating IL-10 levels by almost twofold (Fig. 1B). Local IL-10 levels in gastrocnemius and quadriceps muscle were increased by ∼40% (Fig. 1C). IL-10 treatment caused a modest increase in IL-10 levels in heart, liver, and white adipose tissue that did not reach statistical significance (Fig. 1D). This may be because basal IL-10 levels are generally higher in these organs compared with muscle. A 3-week HFD increased whole-body fat mass by approximately twofold in male C57BL/6 mice, and a 3-day IL-10 treatment did not affect a diet-induced increase in adiposity (Fig. 1E).
A short-term HFD caused insulin resistance in untreated mice, as indicated by a significant reduction in the glucose infusion rate during hyperinsulinemic-euglycemic clamps (Fig. 1F). Insulin-stimulated glucose uptake in skeletal muscle was reduced following HFD (Fig. 1G). Despite gaining similar adiposity following HFD, IL-10–treated mice remained insulin sensitive, as indicated by comparable rates of glucose infusion during insulin clamps (Fig. 1F) and by muscle glucose uptake similar to those of standard diet–fed mice (Fig. 1G). We have previously shown that lipid-mediated insulin resistance involves defects in muscle insulin signaling (29,30). Following 3 weeks of HFD, insulin-stimulated threonine phosphorylation of Akt in muscle was significantly reduced in control mice (Fig. 1H). The protective effects of IL-10 against diet-induced insulin resistance were associated with significant increases in muscle Akt phosphorylation and IRS-1 tyrosine phosphorylation in IL-10–treated HFD mice (Fig. 1H and supplemental Fig. S1A). Muscle IRS-1 activity was not affected by IL-10 treatment in standard diet–fed mice. Total IRS-1 and Akt protein levels were also not affected by the IL-10 treatment. Control mice developed hepatic insulin resistance after HFD, as reflected by a significant reduction in insulin-mediated percent suppression of hepatic glucose production (HGP) (Fig. 1I). Although there was a trend of improved hepatic insulin sensitivity in IL-10–treated HFD mice, this difference did not reach a statistical significance. Insulin-stimulated glucose uptake in white adipose tissue tended to be lower following HFD, and IL-10 treatment did not significantly affect adipose tissue glucose uptake (supplementary Fig. S1B). These results demonstrate that a 3-day IL-10 treatment ameliorates diet-induced insulin resistance by attenuating lipid-mediated defects in muscle insulin signaling and action without affecting diet-induced obesity. Importantly, our findings are consistent with previously observed effects of acute IL-10 treatment in lipid-infused mice (21).
Generation of transgenic mice with muscle-specific overexpression of IL-10.
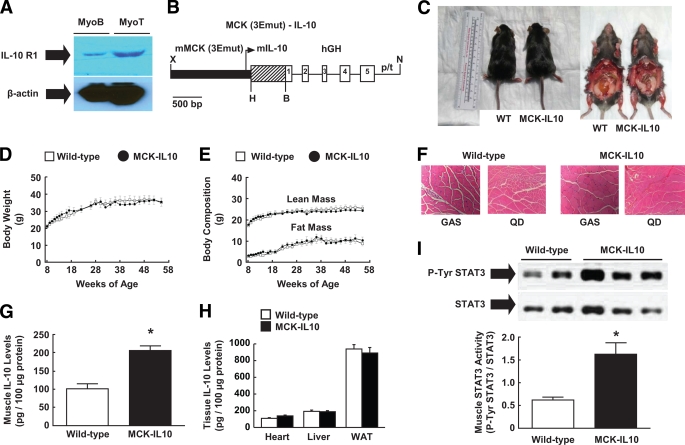
Insulin resistance develops in multiple organs, and IL-10 receptors are expressed in many different cell types (31,32). We measured IL-10 R1 protein expression in C2C12 myoblast and myotube cells and found that IL-10 receptors are expressed in skeletal muscle (Fig. 2A). To investigate the role of IL-10 in muscle insulin action, we generated transgenic mice with muscle-specific overexpression of murine IL-10 (MCK-IL10), driven by a modified mouse MCK gene promoter (−1256MCK-3Emut) that is preferentially active in skeletal muscle (24,25) (Fig. 2B). The potential advantage of using the −1256MCK-3Emut promoter for IL-10 expression is that locally secreted IL-10 might have beneficial effects in skeletal muscle tissue that would only be achieved by much higher systemic levels of IL-10, thereby avoiding potential negative consequences of high systemic IL-10 concentrations. We identified founder lines with high and low expression of IL-10, and these mice were back-crossed to C57BL/6 mice. Initial characterization showed comparable metabolic profile (e.g., glucose, insulin levels) in both high and low expressors (data not shown). The studies reported below concern a single transgenic line of MCK-IL10 mice (low expressors) in which the relative increase in skeletal muscle IL-10 levels above endogenous levels was twice as high as the relative increase in plasma IL-10 levels above endogenous levels.
FIG. 2.
Transgenic mice with muscle-specific overexpression of IL-10 (MCK-IL10). A: IL-10R1 protein expression in C2C12 myoblast and myotube cells. B: Map of MCK-IL10 construct. C: Photographs of MCK-IL10 mice and WT littermates. D: Body weight. E: Whole body lean and fat mass. F: Hematoxylin-eosin staining of gastrocnemius (GAS) and quadriceps (QD) muscle. G: Muscle IL-10 protein levels. H: Plasma and local IL-10 protein levels in heart, liver, and white adipose tissue (WAT). I: STAT3 activity (Tyr705phosphorylation of STAT3) in skeletal muscle. Values are means ± SE for six to eight mice in each group. *P < 0.05 vs. WT mice. A Student's t test was used for statistical analysis. (A high-quality color digital representation of this figure is available in the online issue.)
MCK-IL10 mice showed no notable sign of anomaly (Fig. 2C), and their organ weights (e.g., skeletal muscle, adipose tissue, liver, heart) were comparable with those of nontransgenics (wild type; C57BL/6) (data not shown). MCK-IL10 mice developed normally and displayed a similar pattern of growth compared with wild-type littermates (Fig. 2D and E). MCK-IL10 mice also showed normal morphology and architecture of skeletal muscle, as indicated in hematoxylin-eosin staining of muscle samples (Fig. 2F). The tissue-specific nature of transgene expression at the protein level was determined using enzyme-linked immunosorbent assays in MCK-IL10 and wild-type mice. Local IL-10 protein levels were elevated by approximately twofold in skeletal muscle of MCK-IL10 mice compared with wild-type littermates (Fig. 2G). Plasma IL-10 levels were modestly elevated by ∼30% in MCK-IL10 mice (13.3 ± 1.2 vs. 9.7 ± 0.3 pg/ml in wild-type mice; P < 0.05), suggesting that transgene-driven IL-10 was released from skeletal muscle fibers following its synthesis. IL-10 protein expression was not significantly altered in white adipose tissue, liver, and heart of MCK-IL10 mice (Fig. 2H). To determine whether the increased muscle IL-10 levels in MCK-IL10 mice affect known intracellular IL-10 targets, we performed Western blot analysis to measure tyrosine phosphorylation of STAT3, a major intracellular IL-10 signaling protein (18). Our results indicate that Tyr705 phosphorylation of STAT3 was increased by more than threefold in skeletal muscle of MCK-IL10 mice (Fig. 2I), while total STAT3 protein levels remained unaltered. In contrast, phospho-tyrosine STAT3-to-STAT3 ratio in liver samples was comparable between wild-type and MCK-IL10 mice (0.47 ± 0.14 in wild-type liver vs. 0.33 ± 0.03 in MCK-IL10 liver; P > 0.1). Thus, these results indicate that MCK-IL10 mice have a physiological and selective increase in IL-10 protein expression in muscle without altered expression in other insulin-sensitive organs (e.g., liver, adipose tissue). Additionally, MCK-IL10 mice showed markedly enhanced IL-10 signaling in muscle as reflected by increased STAT3 activity.
MCK-IL10 mice are protected against diet-induced insulin resistance in skeletal muscle.
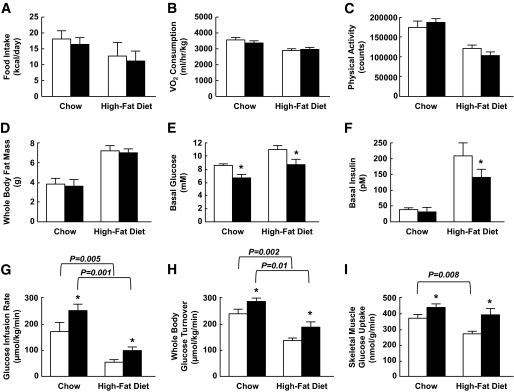
A 3-day analysis of energy balance in MCK-IL10 mice and wild-type littermates fed a standard diet was performed using metabolic cages. Daily food intake, Vo2 consumption (energy expenditure), and physical activity were not significantly altered in MCK-IL10 mice (Fig. 3A–C and supplementary Fig. S2A). This is consistent with normal body size and adiposity in MCK-IL10 mice. To determine the effects of diet-induced obesity on insulin sensitivity, male MCK-IL10 mice and wild-type littermates were fed an HFD or standard diet for 3 weeks. Food intake, Vo2 consumption, and physical activity remained comparable in MCK-IL10 and wild-type mice following HFD (Fig. 3A–C and supplementary Fig. S2B). Muscle overexpression of IL-10 did not affect body composition, and MCK-IL10 mice gained a comparable increase in whole-body fat mass following HFD (Fig. 3D). Despite a similar degree of adiposity, basal plasma glucose levels were lower in MCK-IL10 mice fed a standard or HFD (Fig. 3E). A 3-week HFD markedly raised basal insulin levels in wild-type mice, reflecting a secondary islet response to systemic insulin resistance (Fig. 3F). Although HFD increased basal insulin levels in MCK-IL10 mice, such levels were significantly lower as compared with the HFD-fed wild-type mice, suggesting enhanced insulin sensitivity in MCK-IL10 mice.
FIG. 3.
MCK-IL10 mice are more insulin sensitive and are protected against diet-induced insulin resistance in skeletal muscle. MCK-IL10 and WT mice were fed HFD for 3 weeks, and hyperinsulinemic-euglycemic clamps were performed in conscious mice to measure insulin action. Energy balance was measured for 3 days using metabolic cages. A: Daily food intake in standard diet– and HFD-fed mice. □, WT; ■, MCK-IL10. B: Vo2 consumption. C: Physical activity. D: Whole-body fat mass. E: Basal (overnight-fasted) plasma glucose levels. F: Basal plasma insulin levels. G: Glucose infusion rates during hyperinsulinemic-euglycemic clamps. H: Insulin-stimulated whole-body glucose turnover. I: Insulin-stimulated glucose uptake in skeletal muscle. Values are means ± SE for six to eight mice in each experimental group. *P < 0.05 vs. WT mice fed respective diet. A two-way ANOVA was used for statistical analysis.
A 2-h hyperinsulinemic-euglycemic clamp was performed in conscious male MCK-IL10 mice and wild-type littermates to assess whole-body insulin sensitivity. MCK-IL10 mice fed a standard diet were more insulin sensitive than wild-type mice, as indicated by significant increases in steady-state glucose infusion rates and whole-body glucose turnover during clamps (Fig. 3G and H). These results demonstrate that IL-10 expression in muscle increases whole-body insulin sensitivity in transgenic animals, implicating IL-10 as a positive regulator of insulin sensitivity. Following HFD, MCK-IL10 mice remained more insulin sensitive and showed an ∼40% increase in insulin-stimulated whole-body glucose turnover (Fig. 3H) and more than a twofold increase in whole-body glycogen plus lipid synthesis compared with the HFD-fed wild-type mice (data not shown).
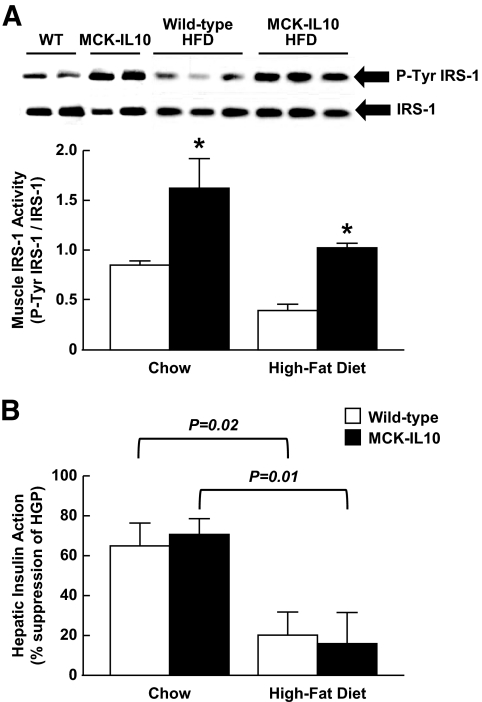
IL-10–mediated protection against diet-induced insulin resistance was mostly due to an ∼50% increases in insulin-stimulated glucose uptake in skeletal muscle of MCK-IL10 mice (Fig. 3I). This was associated with approximately twofold increases in insulin-stimulated tyrosine phosphorylation of IRS-1, a major intracellular insulin-signaling event leading to glucose metabolism (33) in MCK-IL10 mice fed standard diet or HFD (Fig. 4A). Protein kinase C-θ, a serine kinase that negatively regulates muscle insulin signaling (34,35), was reduced in MCK-IL10 mice compared with wild-type mice following HFD (data not shown). HFD reduced hepatic insulin action in both wild-type and MCK-IL10 mice (Fig. 4B), indicating that diet-induced hepatic insulin resistance was not affected by muscle overexpression of IL-10.
FIG. 4.
Muscle insulin signaling and hepatic insulin action in MCK-IL10 and WT mice fed standard or HFD for 3 weeks. A: Insulin-stimulated tyrosine phosphorylation of IRS-1 and IRS-1 protein levels in skeletal muscle (gastrocnemius). B: Hepatic insulin action. Values are means ± SE for four to six mice in each experimental group. *P < 0.05 vs. WT mice fed standard or HFD. A two-way ANOVA was used for statistical analysis.
High-fat diet increases macrophages and cytokines in skeletal muscle.
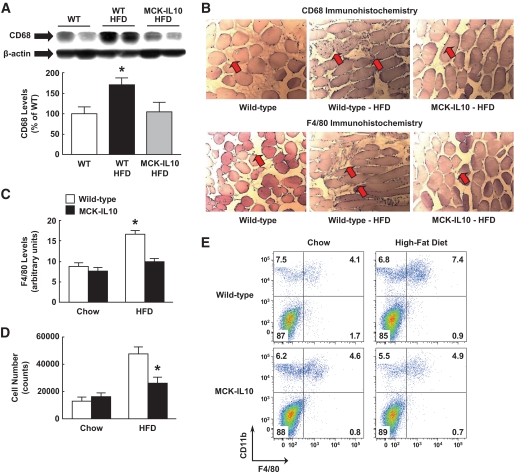
Recent reports (9,23,36) indicate that obesity-associated insulin resistance is partly due to chronic low-grade inflammation and increased macrophage infiltration in adipose tissue. Since skeletal muscle is a major insulin-sensitive organ, we examined the effects of HFD on the inflammatory response in muscle. Remarkably, skeletal muscle levels of CD68 (a macrophage-specific marker) were increased by 70% in wild-type mice following 3 weeks of HFD (Fig. 5A). To our knowledge, this is the first report of elevated macrophage levels in skeletal muscle in normal mice (C57BL/6) following a short-term HFD. Importantly, muscle CD68 protein expression was completely normalized in HFD-fed MCK-IL10 mice (Fig. 5A). In contrast to skeletal muscle, CD68 protein levels in adipose tissue were similarly elevated in HFD-fed wild-type and MCK-IL10 mice (data not shown).
FIG. 5.
HFD increases macrophage levels in WT skeletal muscle, and diet-induced inflammatory response in muscle is attenuated in MCK-IL10 mice. A: Macrophage-specific CD68 levels in skeletal muscle. B: Immunohistochemistry analysis using anti-CD68 and anti-F4/80 (arrows) in skeletal muscle. C: Skeletal muscle F4/80 levels in immunofluorescence staining. *P < 0.05 vs. WT mice fed a standard diet (A–C). D: Average number of macrophages isolated from muscle samples of standard diet– or HFD-fed WT and MCK-IL10 mice. *P < 0.05 vs. HFD-fed WT mice. E: Representative cytometric data showing the frequency of macrophages (CD11b+F4/80+) in each group. Values are means ± SE for five to seven mice in each experimental group. A two-way ANOVA was used for statistical analysis. (A high-quality color digital representation of this figure is available in the online issue.)
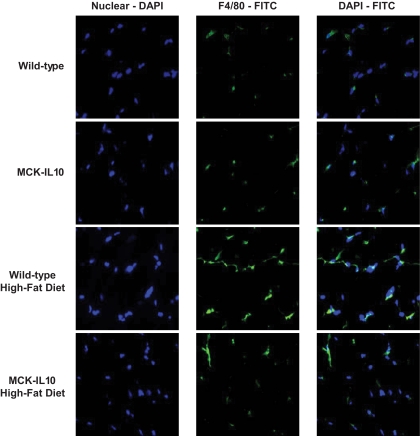
We performed immunohistochemistry and immunofluorescence studies using anti-CD68 and F4/80 and found increased expression of macrophage markers in wild-type muscle following HFD (Fig. 5B and C and Fig. 6). Consistent with the CD68 protein expression data, muscle IL-10 expression attenuated a diet-induced increase in F4/80 levels in skeletal muscle (Fig. 5C and Fig. 6). To further examine diet-induced macrophage infiltration and IL-10–mediated attenuation of inflammatory response in skeletal muscle, we performed flow cytometric analysis using conjugated antibodies against F4/80 and CD11b. An increased number of mononuclear cells including macrophages were recovered from wild-type skeletal muscle following HFD, and this inflammatory response was attenuated in IL-10–overexpressing mice (Fig. 5D and E).
FIG. 6.
Immunofluorescence analysis using anti-F4/80 (green labeling) and nuclei labeling with DAPI (blue labeling) in skeletal muscle in WT and MCK-IL10 mice following standard diet or HFD for 3 weeks. (A high-quality color digital representation of this figure is available in the online issue.)
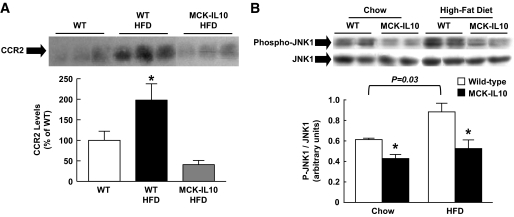
To determine the underlying mechanism of increased macrophages in skeletal muscle following HFD, we measured muscle protein expression of CCR2, which binds the monocyte chemoattractant protein (MCP)-1 and regulates macrophage recruitment (37,38). HFD caused a twofold increase in muscle CCR2 levels in wild-type mice, but muscle IL-10 expression completely prevented a diet-induced increase in muscle CCR2 levels (Fig. 7A). Given our recent study (39) showing activation of the stress kinase, JNK, in inflammation-associated insulin resistance, we measured JNK1 in skeletal muscle. Our findings indicate that HFD caused an ∼45% increase in phospho-JNK1–to–JNK1 ratio in wild-type mice (P = 0.03), and this ratio was markedly lower in MCK-IL10 mice on standard diet and HFD compared with wild-type mice on a respective diet (Fig. 7B).
FIG. 7.
Inflammatory response in WT and MCK-IL10 mice following HFD. A: CCR2 protein expression in skeletal muscle. B: Phospho-JNK1 normalized to JNK1 protein levels in skeletal muscle. *P < 0.05 vs. WT mice fed respective diet. Values are means ± SE for three to five samples in each experimental group. A two-way ANOVA was used for statistical analysis.
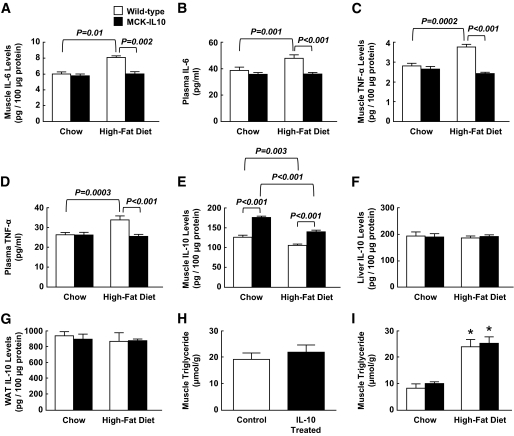
Since inflammatory cytokines play a major role in insulin resistance, we measured serum and local cytokine levels in wild-type and MCK-IL10 mice fed a standard diet or HFD. None of the cytokine levels were altered in MCK-IL10 mice fed a standard diet. In contrast, HFD significantly elevated muscle and plasma levels of IL-6 and TNF-α (Fig. 8A–D). Diet-induced increases in inflammatory cytokines were completely attenuated in MCK-IL10 mice. Local IL-10 protein levels were selectively increased in skeletal muscle of MCK-IL10 mice (Fig. 8E). IL-10 levels in liver and white adipose tissue tended to be lower in wild-type mice following HFD, and these levels were not altered in MCK-IL10 mice (Fig. 8F and G). Intramuscular triglyceride levels were not altered following a 3-day IL-10 treatment and were similarly elevated in wild-type and MCK-IL10 mice following HFD (Fig. 8H and I). These results demonstrate that diet-induced macrophage infiltration in skeletal muscle raises local cytokine (IL-6 and TNF-α) levels and that the associated inflammatory response is attenuated in MCK-IL10 mice.
FIG. 8.
Serum and tissue cytokine levels in WT and MCK-IL10 mice following standard diet or HFD for 3 weeks. A: Muscle IL-6 levels. B: Plasma IL-6 levels. C: Muscle TNF-α levels. D: Plasma TNF-α levels. E: Muscle IL-10 levels. F: Liver IL-10 levels. G: IL-10 levels in white adipose tissue (WAT). H: Intramuscular triglyceride levels in C57BL/6 mice following IL-10 or saline (control) treatment. I: Intramuscular triglyceride levels in MCK-IL10 and WT mice following standard diet or HFD. *P < 0.05 vs. standard diet. Values are means ± SE for four to seven mice in each experimental group. A two-way ANOVA was used for statistical analysis in all figures except H (Student's t test).
DISCUSSION
In this article, we show that transgenic mice with muscle-specific overexpression of IL-10 were protected from diet-induced insulin resistance in skeletal muscle, and this was associated with increased IRS-1 and Akt activities and reduced levels of macrophages and cytokines in skeletal muscle. These results are consistent with our observations that IL-10 treatment in normal mice prevents lipid-mediated insulin resistance in skeletal muscle. Taken together, our findings indicate that IL-10 is a positive regulator of muscle insulin sensitivity and that IL-10 prevents muscle insulin resistance by attenuating an obesity-associated macrophage and cytokine response in muscle.
Increasing evidence indicates the role of chronic low-grade inflammation and macrophage activation in insulin resistance (9,23,36). A cohort of recent studies have demonstrated increases in macrophage infiltration and cytokine expression in adipose tissue and their association with insulin resistance in obese humans and animal models (40–42). Obesity-induced macrophage infiltration is associated with increased adipocyte expression of MCP-1 and macrophage inflammatory protein-1α (37,43–45). Additionally, mice with adipocyte-specific overexpression of MCP-1 (ap2-MCP-1) develop insulin resistance associated with increased macrophage infiltration in adipose tissue (44). CCR2 binds to MCP-1 and regulates macrophage recruitment, and CCR2 knockout mice show increased insulin sensitivity with reduced macrophage level in adipose tissue (38). Although these findings support the role of adipose infiltration of macrophages in insulin resistance, it remains unclear whether macrophage infiltration is a cause or consequence of insulin resistance. In this regard, macrophage infiltration in obese mice (e.g., leptin-deficient ob/ob mice) may be triggered by adipocyte hypertrophy and apoptosis, which result from insulin resistance (46). It is also unclear whether macrophages infiltrate into skeletal muscle in obesity and whether this directly contributes to muscle insulin resistance, an important primary event in the development of type 2 diabetes.
Here, we report for the first time that a short-term (3 weeks) feeding of HFD increased macrophage infiltration in skeletal muscle that was associated with increased muscle expression of CCR2. We also found that macrophage levels in adipose tissue were elevated after 3 weeks of HFD in wild-type mice. Since 3 weeks of HFD is the earliest inducible time point of diet-induced insulin resistance (29), these results support the notion that macrophage infiltration is causally associated with obesity-associated insulin resistance in skeletal muscle. Diet-induced macrophage infiltration in muscle was associated with increased muscle expression of TNF-α and IL-6. TNF-α is a proinflammatory cytokine that is actively secreted by macrophages and adipocytes and shown to cause insulin resistance by downregulating AMP-activated protein kinase (12,47). Furthermore, IL-6 is a proinflammatory cytokine that is elevated in obese, diabetic subjects and shown to cause insulin resistance by activating STAT3-SOCS3 expression and inhibiting the insulin signaling pathway in liver (11,48,49). Thus, our findings indicate that diet-induced insulin resistance is in part due to increases in macrophage infiltration and local levels of TNF-α and IL-6 in skeletal muscle and subsequent deleterious effects of these cytokines on the muscle insulin signaling. Although recent studies have argued the role of IL-6 in insulin resistance, more studies are clearly needed to determine the metabolic role of IL-6 in diabetic skeletal muscle (50,51). We should also point out that these results do not argue against the role of adipose tissue macrophages and inflammation in obesity-induced insulin resistance. Instead, our report implicates that local inflammation in skeletal muscle may be an additional mechanism by which modest obesity affects muscle insulin action.
The protective effects of IL-10 against diet-induced defects in muscle insulin signaling and glucose metabolism were associated with reductions in macrophage levels and local cytokine expressions in skeletal muscle of HFD-fed MCK-IL10 mice. Muscle IL-10 expression also blunted diet-induced increases in CCR2 protein expression in muscle. These results demonstrate that the anti-inflammatory action of IL-10 prevents the obesity-induced CCR2 expression and macrophage infiltration in skeletal muscle, which attenuates the deleterious effects of local cytokines on muscle insulin signaling and glucose metabolism. Taken together, our findings indicate a causative role of macrophage infiltration and local cytokines on obesity-associated insulin resistance, and they support a role of IL-10 in the regulation of glucose homeostasis. However, our findings do not rule out the role of local lipids or lipid metabolites in muscle insulin resistance following chronic high-fat feeding.
The ability of IL-10 secreted in skeletal muscle to attenuate several of the pathogenic insulin-signaling phenotypes associated with type 2 diabetes is interesting with respect to the design of future therapeutic treatments for this disease. While potential problems associated with chronically elevated levels of IL-10 would require further investigation, the relatively low levels of IL-10 (30% in plasma and 100% in skeletal muscle) tested in the present study did not appear deleterious to the mice. Numerous alternative versions of MCK-based regulatory gene cassettes have been designed and tested in mice in conjunction with both systemic and intramuscular delivery with adeno-associated virus vectors (52,53). Since these cassettes are striated muscle-specific and have a range of transcriptional activities, it should, in principle, be feasible to design optimal combinations of MCK-IL10 gene expression constructs, adeno-associated virus titers, and vector delivery routes that would lead to the secretion of sufficient intramuscular or systemic levels of IL-10 to possibly improve insulin sensitivity in type 2 diabetes.
Supplementary Material
Acknowledgments
This study was supported by grants from the U.S. Public Health Service (R01-DK80756 to J.K.K. and RO1-AR18860 to S.D.H.), the American Diabetes Association (1-04-RA-47 and 7-07-RA-80 to J.K.K.), the American Heart Association (0855492D to J.K.K.), and the Pennsylvania State Department of Health (Tobacco Settlement Award to J.K.K.).
No potential conflicts of interest relevant to this article were reported.
Parts of this study were presented in abstract form at the 68th Scientific Sessions of the American Diabetes Association, San Francisco, California, 6–10 June 2008.
We thank Drs. Guadalupe Sabio, Roger J. Davis, Charles H. Lang, and Robert A. Frost for their technical assistance. We also thank Dr. Joon Soo Kang for assistance with flow cytometry experiments.
Footnotes
The costs of publication of this article were defrayed in part by the payment of page charges. This article must therefore be hereby marked “advertisement” in accordance with 18 U.S.C. Section 1734 solely to indicate this fact.
REFERENCES
- 1.Wild S, Roglic G, Green A, Sicree R, King H: Global prevalence of diabetes: estimates for the year 2000 and projections for 2030. Diabetes Care 2004;27:1047–1053 [DOI] [PubMed] [Google Scholar]
- 2.Kahn CR: Insulin action, diabetogenes, and the cause of type II diabetes. Diabetes 1994;43:1066–1084 [DOI] [PubMed] [Google Scholar]
- 3.Goldberg IJ: Diabetic dyslipidemia: causes and consequences. J Clin Endo Metab 2001;86:965–971 [DOI] [PubMed] [Google Scholar]
- 4.Reaven GM: Role of insulin resistance in human disease. Diabetes 1988;37:1595–1607 [DOI] [PubMed] [Google Scholar]
- 5.Boden G: Obesity, free fatty acids, and insulin resistance. Curr Opin Endo Diabetes 2001;8:235–239 [Google Scholar]
- 6.Randle PJ, Garland PB, Hales CN, Newsholme EA: The glucose fatty acid cycle: its role in insulin sensitivity and the metabolic disturbances of diabetes mellitus. Lancet 1963;1:785–789 [DOI] [PubMed] [Google Scholar]
- 7.Boden G: Role of fatty acids in the pathogenesis of insulin resistance and NIDDM. Diabetes 1997;46:3–10 [PubMed] [Google Scholar]
- 8.Shulman GI: Cellular mechanisms of insulin resistance. J Clin Invest 2000;106:171–176 [DOI] [PMC free article] [PubMed] [Google Scholar]
- 9.Wellen KF, Hotamisligil GS: Inflammation, stress, diabetes. J Clin Invest 2005;115:1111–1119 [DOI] [PMC free article] [PubMed] [Google Scholar]
- 10.Pickup JC, Crook MA: Is type II diabetes mellitus a disease of the innate immune system? Diabetologia 1998;41:1241–1248 [DOI] [PubMed] [Google Scholar]
- 11.Kern PA, Ranganathan S, Li C, Wood L, Ranganathan G: Adipose tissue tumor necrosis factor and interleukin-6 expression in human obesity and insulin resistance. Am J Physiol 2001;280:E745–E751 [DOI] [PubMed] [Google Scholar]
- 12.Hotamisligil GS, Shargill NS, Spiegelman BM: Adipose expression of tumor necrosis factor-alpha: direct role in obesity-linked insulin resistance. Science 1993;259:87–91 [DOI] [PubMed] [Google Scholar]
- 13.van Exel E, Gussekloo J, de Craen AJ, Frölich M, Bootsma-Van Der Wiel A, Westendorp RGthe Leiden 85 Plus Study Low production capacity of interleukin-10 associates with the metabolic syndrome and type 2 diabetes: the Leiden 85-Plus Study. Diabetes 2002;51:1088–1092 [DOI] [PubMed] [Google Scholar]
- 14.Esposito K, Pontillo A, Giugliano F, Giugliano G, Marfella R, Nicoletti G, Giugliano D: Association of low interleukin-10 levels with the metabolic syndrome in obese women. J Clin Endocrinol Metab 2003;88:1055–1058 [DOI] [PubMed] [Google Scholar]
- 15.Straczkowski M, Kowalska I, Nikolajuk A, Krukowska A, Gorska M: Plasma interleukin-10 concentration is positively related to insulin sensitivity in young healthy individuals. Diabetes Care 2005;28:2036–2037 [DOI] [PubMed] [Google Scholar]
- 16.Akdis CA, Blaser K: Mechanisms of interleukin-10-mediated immune suppression. Immunology 2001;103:131–136 [DOI] [PMC free article] [PubMed] [Google Scholar]
- 17.Pestka S, Krause CD, Sarkar D, Walter MR, Shi Y, Fisher PB: Interleukin-10 and related cytokines and receptors. Annu Rev Immunol 2004;22:929–979 [DOI] [PubMed] [Google Scholar]
- 18.Yamanaka Y, Nakajima K, Fukada T, Hibi M, Hirano T: Differentiation and growth arrest signals are generated through the cytoplasmic region of gp130 that is essential for Stat3 activation. EMBO J 1996;15:1557–1565 [PMC free article] [PubMed] [Google Scholar]
- 19.Yang Z, Chen M, Wu R, Fialkow LB, Bromberg JS, McDuffie M, Naji A, Nadler JL: Suppression of autoimmune diabetes by viral IL-10 gene transfer. J Immunol 2002;168:6479–6485 [DOI] [PubMed] [Google Scholar]
- 20.Pennline KJ, Roque-Gaffney E, Monahan M: Recombinant human IL-10 prevents the onset of diabetes in the nonobese diabetic mouse. Clin Immunol Immunopathol 1994;71:169–175 [DOI] [PubMed] [Google Scholar]
- 21.Kim HJ, Higashimori T, Park SY, Choi H, Dong J, Kim YJ, Noh HL, Cho YR, Cline G, Kim YB, Kim JK: Differential effects of interleukin-6 and -10 on skeletal muscle and liver insulin action in vivo. Diabetes 2004;53:1060–1067 [DOI] [PubMed] [Google Scholar]
- 22.Scarpelli D, Cardellini M, Andreozzi F, Laratta E, Hribal ML, Marini MA, Tassi V, Lauro R, Perticone F, Sesti G: Variants of the interleukin-10 promoter gene are associated with obesity and insulin resistance but not type 2 diabetes in Caucasian Italian subjects. Diabetes 2006;55:1529–1533 [DOI] [PubMed] [Google Scholar]
- 23.Lumeng CN, Bodzin JL, Saltiel AR: Obesity induces a phenotypic switch in adipose tissue macrophage polarization. J Clin Invest 2007;117:175–184 [DOI] [PMC free article] [PubMed] [Google Scholar]
- 24.Shield MA, Haugen HS, Clegg CH, Hauschka SD: E-box sites and a proximal regulatory region of the muscle creatine kinase gene differentially regulate expression in diverse skeletal muscles and cardiac muscle of transgenic mice. Mol Cell Biol 1996;16:5058–5068 [DOI] [PMC free article] [PubMed] [Google Scholar]
- 25.Nguyen QG, Buskin JN, Himeda CL, Shield MA, Hauschka SD: Differences in the function of three conserved E-boxes of the muscle creatine kinase gene in cultured myocytes and in transgenic mouse skeletal and cardiac muscle. J Biol Chem 2003;278:46494–46505 [DOI] [PubMed] [Google Scholar]
- 26.Lee CG, Homer RJ, Cohn L, Link H, Jung S, Craft JE, Graham BS, Johnson TR, Elias JA: Transgenic overexpression of interleukin (IL)-10 in the lung causes mucus metaplasia, tissue inflammation, and airway remodeling via IL-13-dependent and -independent pathways. J Biol Chem 2002;277:35466–35474 [DOI] [PubMed] [Google Scholar]
- 27.Park SY, Cho YR, Finck BN, Kim HJ, Higashimori T, Hong EG, Lee MK, Danton C, Deshmukh S, Cline GW, Wu JJ, Bennett AM, Rothermel B, Kalinowski A, Russell KS, Kim YB, Kelly DP, Kim JK: Cardiac-specific overexpression of PPARα causes insulin resistance in heart and liver. Diabetes 2005;54:2514–2524 [DOI] [PubMed] [Google Scholar]
- 28.Cho YR, Kim HJ, Park SY, Ko HJ, Hong EG, Higashimori T, Zhang Z, Jung DY, Ola MS, Lanoue KF, Leiter EH, Kim JK: Hyperglycemia, maturity-onset obesity, and insulin resistance in NONcNZO10/LtJ males, a new mouse model of type 2 diabetes. Am J Physiol Endocrinol Metab 2007;293:E327–E336 [DOI] [PubMed] [Google Scholar]
- 29.Park SY, Cho YR, Kim HJ, Higashimori T, Danton C, Lee MK, Dey A, Rothermel B, Kim YB, Kalinowski A, Russell KS, Kim JK: Unraveling the temporal pattern of diet-induced insulin resistance in individual organs and cardiac dysfunction in C57BL/6 mice. Diabetes 2005;54:3530–3540 [DOI] [PubMed] [Google Scholar]
- 30.Kim JK, Fillmore JJ, Chen Y, Yu C, Moore IK, Pypaert M, Lutz EP, Kako Y, Velez-Carrasco W, Goldberg IJ, Breslow JL, Shulman GI: Tissue-specific overexpression of lipoprotein lipase causes tissue-specific insulin resistance. Proc Natl Acad Sci U S A 2001;98:7522–7527 [DOI] [PMC free article] [PubMed] [Google Scholar]
- 31.DeFronzo RA: The triumvirate: β-cell, muscle, liver. A collision responsible for NIDDM. Diabetes 1988;37:667–687 [DOI] [PubMed] [Google Scholar]
- 32.Moore KW, De Waal Malefyt R, Coffman RL, O'Garra A: Interleukin-10 and the interleukin-10 receptor. Annu Rev Immunol 2001;19:683–765 [DOI] [PubMed] [Google Scholar]
- 33.White MF: The IRS-signaling system: a network of docking proteins that mediate insulin action. Mol Cell Biochem 1998;182:3–11 [PubMed] [Google Scholar]
- 34.Kim JK, Fillmore JJ, Sunshine MJ, Albrecht B, Higashimori T, Kim DW, Liu ZX, Soos TJ, Cline GW, O'Brien WR, Littman DR, Shulman GI: PKC-theta knockout mice are protected from fat-induced insulin resistance. J Clin Invest 2004;114:823–827 [DOI] [PMC free article] [PubMed] [Google Scholar]
- 35.Griffin ME, Marcucci MJ, Cline GW, Bell K, Barucci N, Lee D, Goodyear LJ, Kraegen EW, White MF, Shulman GI: Free fatty acid-induced insulin resistance is associated with activation of protein kinase C θ and alterations in the insulin signaling cascade. Diabetes 1999;48:1270–1274 [DOI] [PubMed] [Google Scholar]
- 36.Chen H: Cellular inflammatory responses: novel insights for obesity and insulin resistance. Pharmacological Res 2006;53:469–477 [DOI] [PubMed] [Google Scholar]
- 37.Di Gregorio GB, Yao-Borengasser A, Rasouli N, Varma V, Lu T, Miles LM, Ranganathan G, Peterson CA, McGehee RE, Kern PA: Expression of CD68 and macrophage chemoattractant protein-1 genes in human adipose and muscle tissues. Diabetes 2005;54:2305–2313 [DOI] [PubMed] [Google Scholar]
- 38.Weisberg SP, Hunter D, Huber R, Lemieux J, Slaymaker S, Vaddi K, Charo I, Leibel RL, Ferrante AW, Jr: CCR2 modulates inflammatory and metabolic effects of high-fat feeding. J Clin Invest 2006;116:115–124 [DOI] [PMC free article] [PubMed] [Google Scholar]
- 39.Sabio G, Das M, Mora A, Zhang Z, Jun JY, Ko HJ, Barrett T, Kim JK, Davis RJ: A stress signaling pathway in adipose tissue regulates hepatic insulin resistance. Science 2008;322:1539–1543 [DOI] [PMC free article] [PubMed] [Google Scholar]
- 40.Lumeng CN, Deyoung SM, Saltiel AR: Macrophages block insulin action in adipocytes by altering expression of signaling and glucose transport proteins. Am J Physiol 2007;292:E166–E174 [DOI] [PMC free article] [PubMed] [Google Scholar]
- 41.Xu H, Barnes GT, Yang Q, Tan G, Yang D, Chou CJ, Sole J, Nichols A, Ross JS, Tartaglia LA, Chen H: Chronic inflammation in fat plays a crucial role in the development of obesity-related insulin resistance. J Clin Invest 2003;112:1821–1830 [DOI] [PMC free article] [PubMed] [Google Scholar]
- 42.Permana PA, Menge C, Reaven PD: Macrophage-secreted factors induce adipocyte inflammation and insulin resistance. Biochem Biophys Res Comm 2006;341:507–514 [DOI] [PubMed] [Google Scholar]
- 43.Kamei N, Tobe K, Suzuki R, Ohsugi M, Watanabe T, Kubota N, Ohtsuka-Kowatari N, Kumagai K, Sakamoto K, Kobayashi M, Yamauchi T, Ueki K, Oishi Y, Nishimura S, Manabe I, Hashimoto H, Ohnishi Y, Ogata H, Tokuyama K, Tsunoda M, Ide T, Murakami K, Nagai R, Kadowaki T: Overexpression of monocyte chemoattractant protein-1 in adipose tissues causes macrophage recruitment and insulin resistance. J Biol Chem 2006;281:26602–26614 [DOI] [PubMed] [Google Scholar]
- 44.Kanda H, Tateya S, Tamori Y, Kotani K, Hiasa K, Kitazawa R, Kitazawa S, Miyachi H, Maeda S, Egashira K, Kasuga M: MCP-1 contributes to macropahge infiltration into adipose tissue, insulin resistance, and hepatic steatosis in obesity. J Clin Invest 2006;116:1494–1505 [DOI] [PMC free article] [PubMed] [Google Scholar]
- 45.Takahashi K, Mizuarai S, Araki H, Mashiko S, Ishihara A, Kanatani A, Itadani H, Kotani H: Adiposity elevates plasma MCP-1 levels leading to the increased CD11b-positive monocytes in mice. J Biol Chem 2003;278:46654–46660 [DOI] [PubMed] [Google Scholar]
- 46.Cinti S, Mitchell G, Barbatelli G, Murano I, Ceresi E, Faloia E, Wang S, Fortier M, Greenberg AS, Obin MS: Adipocyte death defines macrophage localization and function in adipose tissue of obese mice and humans. J Lipid Res 2005;46:2347–2355 [DOI] [PubMed] [Google Scholar]
- 47.Steinberg GR, Michell BJ, van Denderen BJ, Watt MJ, Carey AL, Fam BC, Andrikopoulos S, Proietto J, Görgün CZ, Carling D, Hotamisligil GS, Febbraio MA, Kay TW, Kemp BE: Tumor necrosis factor α-induced skeletal muscle insulin resistance involves suppression of AMP-kinase signaling. Cell Metab 2006;4:465–474 [DOI] [PubMed] [Google Scholar]
- 48.Senn JJ, Klover PJ, Nowak IA, Mooney RA: Interleukin-6 induces cellular insulin resistance in hepatocytes. Diabetes 2002;51:3391–3399 [DOI] [PubMed] [Google Scholar]
- 49.Shi H, Tzameli I, Bjorbaek C, Flier JS: Suppressor of cytokine signaling 3 is a physiological regulator of adipocyte insulin signaling. J Biol Chem 2004;279:34733–34740 [DOI] [PubMed] [Google Scholar]
- 50.Carey AL, Steinberg GR, Macaulay SL, Thomas WG, Holmes AG, Ramm G, Prelovsek O, Hohnen-Behrens C, Watt MJ, James DE, Kemp BE, Pedersen BK, Febbraio MA: IL-6 increases insulin stimulated glucose disposal in humans and glucose uptake and fatty acid oxidation in vitro via AMPK. Diabetes 2006;55:2688–2697 [DOI] [PubMed] [Google Scholar]
- 51.Pedersen BK, Febbraio MA, Mooney RA: Interleukin-6 does/does not have a beneficial role in insulin sensitivity and glucose homeostasis. J Appl Physiol 2007;102:814–816 [DOI] [PubMed] [Google Scholar]
- 52.Salva MZ, Himeda CL, Tai PW, Nishiuchi E, Gregorevic P, Allen JM, Finn EE, Nguyen QG, Blankinship MJ, Meuse L, Chamberlain JS, Hauschka SD: Design of novel tissue-specific regulatory cassettes for high-level rAAV-mediated expression is skeletal and cardiac muscle. Mol Ther 2007;15:320–329 [DOI] [PubMed] [Google Scholar]
- 53.Scott JM, Li S, Harper SQ, Welikson R, Bourque D, DelloRusso C, Hauschka SD, Chamberlain JS: Viral vectors for gene transfer of micro-, mini-, or full-length dystrophin. Neruomuscul Disord Suppl 2002;1:S23–S29 [DOI] [PubMed] [Google Scholar]
Associated Data
This section collects any data citations, data availability statements, or supplementary materials included in this article.


