Abstract
OBJECTIVE
To characterize the phenotypic changes of adipose tissue macrophages (ATMs) under different conditions of insulin sensitivity.
RESEARCH DESIGN AND METHODS
The number and the expressions of marker genes for M1 and M2 macrophages from mouse epididymal fat tissue were analyzed using flow cytometry after the mice had been subjected to a high-fat diet (HFD) and pioglitazone treatment.
RESULTS
Most of the CD11c-positive M1 macrophages and the CD206-positive M2 macrophages in the epididymal fat tissue were clearly separated using flow cytometry. The M1 and M2 macrophages exhibited completely different gene expression patterns. Not only the numbers of M1 ATMs and the expression of M1 marker genes, such as tumor necrosis factor-α and monocyte chemoattractant protein-1, but also the M1-to-M2 ratio were increased by an HFD and decreased by subsequent pioglitazone treatment, suggesting the correlation with whole-body insulin sensitivity. We also found that the increased number of M2 ATMs after an HFD was associated with the upregulated expression of interleukin (IL)-10, an anti-inflammatory Th2 cytokine, in the adipocyte fraction as well as in adipose tissue. The systemic overexpression of IL-10 by an adenovirus vector increased the expression of M2 markers in adipose tissue.
CONCLUSIONS
M1 and M2 ATMs constitute different subsets of macrophages. Insulin resistance is associated with both the number of M1 macrophages and the M1-to-M2 ratio. The increased expression of IL-10 after an HFD might be involved in the increased recruitment of M2 macrophages.
Obesity and insulin resistance are closely associated with a state of low-grade inflammation in adipose tissue, where resident macrophages play important roles (1–9). Adipose tissue macrophages (ATMs) consist of at least two different phenotypes (i.e., classically activated M1 macrophages and alternatively activated M2 macrophages). A recent report (10) proposed that M1 or M2 ATMs are distinguished by the presence or the absence of CD11c, an M1 macrophage marker. M1 ATMs produce proinflammatory cytokines, such as tumor necrosis factor (TNF)-α, interleukin (IL)-6, and monocyte chemoattractant protein (MCP)-1, thus contributing to the induction of insulin resistance (11–13). On the other hand, M2 ATMs, which are the major resident macrophages in lean adipose tissue, are reported to have a different gene expression profile, characterized by the relatively high expression of CD206, arginase-1, MglI, and IL-10, which are involved in the repair or remodeling of tissues (10–14).
Recent studies have demonstrated the involvement of M1/M2 ATMs in the regulation of insulin sensitivity. The deletion of M1 marker genes such as TNF-α (15) and C-C motif chemokine receptor (CCR) 2 (8) or the ablation of CD11c-positive cells resulted in the normalization of insulin sensitivity (16). On the other hand, the mice with the macrophage-specific knockout of peroxisome proliferator–activated receptor (PPAR) γ or PPARβ/δ displayed insulin resistance with reduced number and impaired function of M2 macrophages (17–20). The latter studies also indicated that IL-4 or IL-13 from adipocytes or hepatocytes promotes the expression of PPARγ and PPARβ/δ in monocytes, resulting in the differentiation of M2 macrophages. Although it is generally accepted that M1 ATMs induce insulin resistance by secreting a variety of proinflammatory cytokines, how M2 ATMs contribute to the amelioration of insulin resistance is currently unknown.
Recently, Lumeng et al. (10) used CD11c as an M1 marker in a flow cytometry analysis and reported that high-fat diet (HFD)-induced obesity causes a shift in ATMs from an M2 polarized state in lean animals to an M1 proinflammatory state. However, the precise mechanism of how the increased ratio of M1 macrophages is induced in diet-induced obese mice is not fully understood (e.g., are M1 macrophages newly recruited from circulating monocytes, or do M2 macrophages present in lean adipose tissue differentiate into M1 macrophages?)
To evaluate the changes in the number as well as the gene expression of M1 and M2 markers more precisely, we analyzed mouse ATMs by flow cytometry using CD206 as an M2 marker in addition to using CD11c as an M1 marker. Here, we show that the CD11c-positive/CD206-negative M1 ATMs and the CD206-positive/CD11c-negative M2 ATMs constituted distinct populations. The number of M1 macrophages and the M1-to-M2 ratio are related to the development of insulin resistance. Interestingly, the overexpression of IL-10 by adenovirus vector increased the markers of M2 ATMs in adipose tissue, suggesting that enhanced IL-10 expression by an HFD and/or pioglitazone treatment may be involved in a phenotypic switch in ATMs.
RESEARCH DESIGN AND METHODS
Pioglitazone was kindly provided by Takeda (Tokyo, Japan). A rat monoclonal antibody against mouse F4/80, a hamster monoclonal antibody against mouse CD11c, a rat CD206 antibody conjugated with Alexa 647, and a rat MglI antibody conjugated with Alexa 488 were purchased from AbD-Serotec (Oxford, U.K.). A rat F4/80 antibody conjugated with fluorescein isothiocyanate and a hamster CD11c antibody conjugated with phycoerythrin were purchased from eBiosciences (San Diego, CA) and BD Biosciences (San Jose, CA), respectively.
Maintenance of mice.
Six-week-old male C57BL/6J mice were purchased from CLEA Japan (Meguro-Ku, Japan). The mice were maintained under a standard light cycle (12 h light/dark) and were allowed free access to water and food. They were fed a standard diet containing 10% calory from fat (Nosan Corporation, Yokohama, Japan) or an HFD containing 60% fat (Research Diets, New Brunswick, NJ) for 17 weeks. During the last 5 weeks of the diet intervention, half of the mice receiving the HFD were switched to HFD supplemented with pioglitazone (10 mg · kg−1 · day−1). The animal care policies and procedures for the experiments were approved by the animal studies committee at the University of Toyama.
Infection of adenovirus vector.
A cDNA encoding human IL-10 was inserted into an adenovirus vector using the Adenovirus Expression Vector Kit (Ad-hIL-10) (Takara Bio, Shiga, Japan) as described previously (21). Ad-X-DsRed2 (Ad-R2), an adenovirus vector encoding Discosoma sp. red fluorescent protein, was used as a control vector (Clontech, Mountain View, CA). Ad-hIL-10 or Ad-R2 was injected intraperitoneally.
Immunohistochemistry of macrophages in white adipose tissues.
F4/80 staining was performed using an amino acid polymer detection system and Histofine Mouse Stain Kit (Nichirei, Tokyo, Japan). The sections were incubated with anti-F4/80 antibody (dilution, 1:100) overnight at 4°C and were incubated with a secondary antibody of Histofine Simple Stain Max PO (rat) for 30 min. For CD11c staining, the sections were incubated with hamster anti-mouse CD11c antibodies (dilution, 1:20) for 3 h, then with goat anti-hamster IgG antibody (dilution, 1:100) for 1 h, and finally with Histofine Simple Stain Max PO (goat) for 30 min. Negative control studies were also performed without using these first antibodies. All sections were counterstained with hematoxylin. The total number of cells and crown-like structure were counted in 10 different high-power fields from each section.
Isolation of adipocytes and stromal-vascular fractions.
Epididymal adipose tissues from mice were rinsed in saline, minced into fine pieces, and digested with collagenase (Sigma-Aldrich, St. Louis, MO) with Krebs-Henseleit-HEPES buffer, pH 7.4, supplemented with 20 mg/ml of BSA and 2 mmol/l glucose at 37°C using a shaker for 45 min. Then, the samples were passed through a mesh and fractionated by brief centrifugation (1,000 rpm). The pellets or the floating cells were collected as the stromal-vascular fraction (SVF) or as the adipocyte fraction, respectively. Cells in each fraction were used for RNA extraction or flow cytometry analysis.
Flow cytometry analysis.
Cells in the SVF were incubated in Pharm Lyse (BD Biosciences) for 15 min at 4°C and resuspended in Pharmingen stain buffer (BD Biosciences). The cells were incubated with 2.4G2 (BD Biosciences) for 10 min and then with primary antibodies or the matching control isotypes for 30 min at 4°C. Then, the cells were rinsed twice and resuspended in Pharmingen stain buffer. After incubating with 7-amino-actinomycin D (BD Biosciences), the cells were analyzed using a FACSAria cell sorter (BD Biosciences). The data analysis was performed using FlowJo (Tree Star, Ashland, OR). M1 or M2 macrophages were identified as F4/80-positive/CD11c-positive/CD206-negative or F4/80-positive/CD11c-negative/CD206-positive cells, respectively. The numbers of M1 or M2 macrophages were calculated by multiplying the number of trypan blue–negative cells by the ratio of F4/80-positive/CD11c-positive/CD206-negative cells or that of F4/80-positive/CD11c-negative/CD206-positive cells.
Quantitative RT-PCR.
Total RNA was extracted from epididymal fat tissue or sorted cells using the RNeasy kit (Qiagen, Hilden, Germany). cDNA was synthesized with multiscribe reverse transcriptase (Applied Biosystems, Foster City, CA). Quantitative RT-PCR for each gene was performed using the TaqMan method (50°C for 2 min, 95°C for 10 min, and 40 cycles of 95°C for 15 s and 60°C for 1 min) with premade primer sets (Applied Biosystems). The relative abundance of transcripts was normalized according to the expression of 18S mRNA and was analyzed using a standard curve method.
Statistical analysis.
Results were presented as the means ± SE. The data were analyzed using unpaired t tests. Differences were considered statistically significant at P < 0.05.
RESULTS
M1 macrophage markers were increased by high-fat feeding and decreased by pioglitazone treatment, while M2 macrophage markers were not.
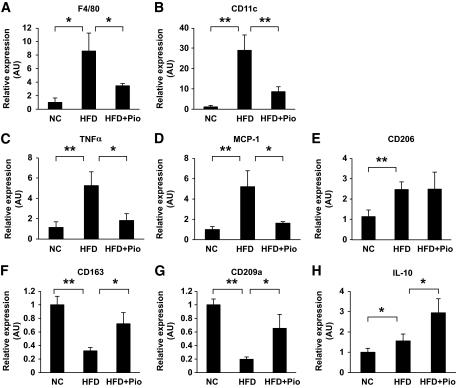
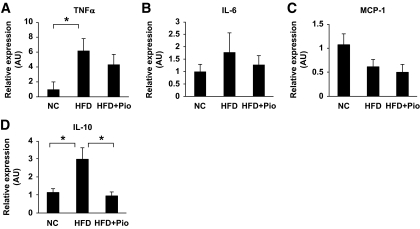
Before testing the effects of high-fat treatment or pioglitazone treatment on ATMs, the effect of these treatments on glucose metabolism and adipose tissues were examined. High-fat treatment for 17 weeks increased glucose levels based on an intraperitoneal insulin tolerance test and a glucose tolerance test in C57BL/6 mice. Pioglitazone treatment for the last 5 weeks of 17-week HFD treatment significantly lowered the glucose profile, suggesting an improvement in insulin sensitivity and glucose metabolism (data not shown). The average adipocyte size in epididymal fat tissue was significantly larger in high-fat–fed mice than in mice fed the standard diet. Pioglitazone treatment decreased the adipocyte size by ∼36% (data not shown). We next examined the changes in the marker genes for macrophages in epididymal fat tissue with or without high-fat treatment and pioglitazone treatment. The expression of F4/80 mRNA was increased by high-fat feeding and was markedly reduced by pioglitazone treatment (Fig. 1A). ATMs were recently reported to consist of at least two subclasses, referred to as M1 and M2 macrophages (12,13). The expressions of all the M1 markers examined were regulated very simply by high-fat feeding and pioglitazone treatment (i.e., the mRNAs of CD11c, TNF-α, and MCP-1), were all upregulated by high-fat feeding, and were downregulated by pioglitazone treatment (Fig. 1B–D). On the other hand, the M2 markers, such as CD206, CD163, CD209a, and IL-10, were not as simply regulated as those for the M1 markers (Fig. 1E–H). Some of the M2 markers were reduced, but others were increased or not altered by high-fat feeding and pioglitazone treatment. Interestingly, the expression of IL-10 was increased by high-fat feeding and was further increased by pioglitazone treatment, although insulin sensitivity was deteriorated by the former and ameliorated by the latter. These changes in the M2 markers may have arisen as a result of the selective induction or suppression of such genes.
FIG. 1.
Effect of HFD and pioglitazone on gene expressions of epididymal fat tissue. Total RNA was isolated from the whole epididymal fat tissue, and real-time RT-PCR for the indicated genes was conducted as described in the research design and methods section. Data were normalized according to 18S mRNA level and presented as a value relative to that for normal diet–fed mice. The results are shown as means ± SE for five to eight animals per group. *P < 0.05; **P < 0.01.
M1 and M2 macrophage fractions were clearly separated by flow cytometry using CD11c and CD206 as M1 and M2 markers, respectively.
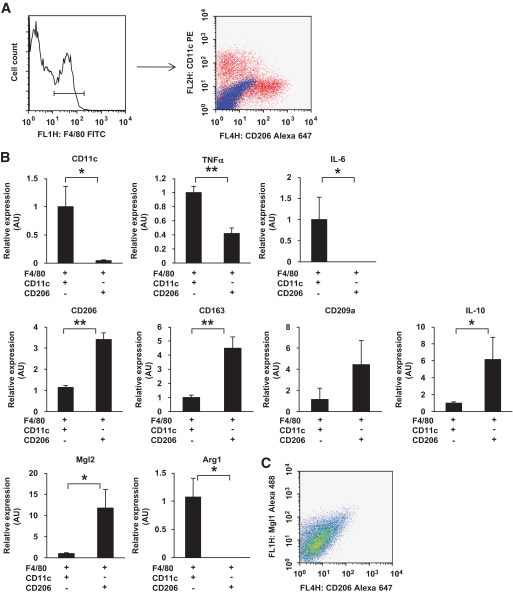
Recently, Lumeng et al. (10) reported that adipose tissue M1 or M2 macrophages are defined by the presence or the absence of CD11c, an M1 marker. In this study, we extended the report of Lumeng et al. and tried to separate M2 ATMs using CD206 as an M2 marker. After the first sorting of the F4/80-positive cells from the SVF of epididymal fat tissue from high-fat–fed mice, the cells were then analyzed by flow cytometry using CD11c and CD206 as markers of M1 and M2 macrophages, respectively. As shown in Fig. 2A, clearly separated cell fractions were observed (i.e., most of the CD11c-positive cells were CD206 negative, whereas most of the CD11c-negative cells were CD206 positive). As expected, the fractions showed very different gene expression profiles. CD11c, TNF-α, and IL-6 were highly expressed in the CD11c-positive/CD206-negative fraction but not in the CD11c-negative/CD206-positive fraction. Conversely, CD206, CD163, CD209a, IL-10, and MglII were highly expressed in the CD11c-negative/CD206-positive fraction but not in the CD11c-positive/CD206-negative fraction (Fig. 2B). Accordingly, we identified the CD11c-positive/CD206-negative fraction as the M1 fraction and the CD11c-negative/CD206-positive fraction as the M2 fraction in this study.
FIG. 2.
Gene profiles of macrophages positive or negative for CD11c and CD206 in epididymal fat tissue. Cells in the SVF of epididymal fat tissue from mice fed a HFD for 12 weeks were analyzed using flow cytometry. F4/80-positive cells were further analyzed with anti-CD11c and anti-CD206 antibodies. A: Representative flow cytometry results. Blue dots show isotype control. Total RNA was isolated from F4/80-positive/CD11c-positive/CD206-negative cells or F4/80-positive/CD11c-negative/CD206-positive cells. B: Real-time RT-PCR for the indicated genes was conducted as described in the research design and methods section. Data were normalized according to the 18S mRNA level. The results are shown as the means ± SE for four to seven animals per group. *P < 0.05; **P < 0.01. The correlation between CD206 expression and MglI expression was examined. C: Representative results.
Recently, Lumeng et al. (14) identified MglI-positive F4/80 macrophages as M2a fraction. Thus, we examined whether the expression of CD206 was correlated with that of MglI. Flow cytometry analysis showed that the expressions of these two markers were well correlated as shown in Fig. 2C. Thus, we believe that CD206 can be as useful a marker as MglI for detecting the M2 fraction.
Numbers of M1 and M2 macrophages were increased by high-fat feeding and decreased by pioglitazone treatment.
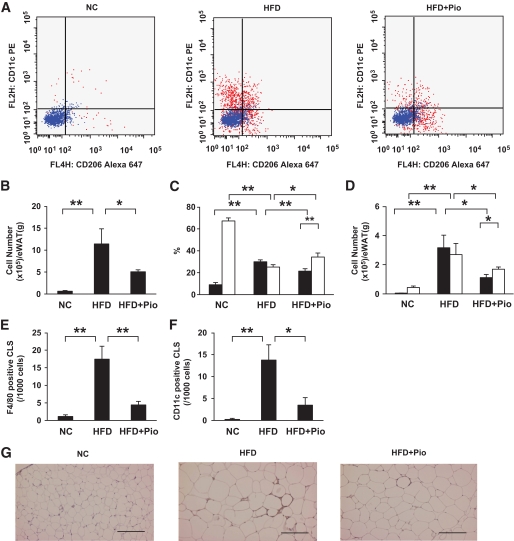
Using this useful cell sorting system, we further examined whether the changes in M1 and M2 markers observed in whole epididymal fat tissue (Fig. 1) could be explained by changes in the number of M1 and M2 macrophages or by changes in the gene expression profiles of each cell. First, the cell numbers in the M1 and M2 fractions were evaluated in samples obtained from mice with or without high-fat treatment or pioglitazone treatment (Fig. 3). The ratio of the M1 fraction in F4/80-positive cells was increased by high-fat feeding and decreased by pioglitazone treatment, while the ratio of the M2 fraction was conversely decreased by high-fat feeding and increased by pioglitazone treatment (Fig. 3C). However, it should be noted that the number of M2 ATMs normalized according to the weight of the epididymal fat tissue was increased by high-fat feeding and decreased by pioglitazone treatment, similar to the changes in M1 ATMs (Fig. 3D), because the total number of ATMs normalized according to the weight of the epididymal fat tissue was remarkably increased by high-fat feeding and decreased by pioglitazone treatment (Fig. 3B). These results suggest that the changes in the M1 markers in the whole epididymal fat tissue shown in Fig. 1 can be explained, at least in part, by the changes in the number of M1 ATMs, while the various changes in the M2 markers cannot be explained simply by the changes in the number of M2 ATMs. The changes in ATMs were also examined by immunostaining. As previously reported (22), F4/80-positive cells formed crown-like structures (CLSs) in the epididymal fat tissue of high-fat–fed mice, which were rarely observed in that of standard diet–fed mice. Pioglitazone treatment significantly decreased the number of CLSs (Fig. 3E). Similar changes of CD11c-positive CLSs by these treatments were also observed, indicating that the number of M1 ATMs was increased by high-fat feeding and decreased by pioglitazone treatment (Fig. 3F and G).
FIG. 3.
Effect of HFD and pioglitazone treatment on the number of M1/M2 macrophages in epididymal fat tissue. Cells in the SVF of epididymal fat tissue were analyzed using flow cytometry as described in Fig. 2. A: Representative results of flow cytometry are shown. B: The cell numbers in the F4/80-positive fraction. C and D: F4/80-positive/CD11c-positive/CD206-negative fraction (■) or F4/80-positive/CD11c-negative/CD206-positive fraction (□) were counted as described in the research design and methods section. C: The cell numbers in the CD11c-positive/CD206-negative and CD11c-negative/CD206-positive fractions are shown according to the percentage of each fraction per total F4/80-positive cells. D: The cell number in each fraction from 1 g of epididymal fat tissue. Epididymal fat tissues were stained with anti-F4/80 (E) or anti-CD11c antibody (F and G). E and F: The number of CLSs was counted as described in the research design and methods section. The results are shown as the means ± SE for five to eight animals per group. *P < 0.05; **P < 0.01. G: Representative images with anti-CD11c antibody. Bar = 200 μm.
Expression of M1 markers in each cell was not altered, but the expression of some M2 markers was upregulated by pioglitazone treatment.
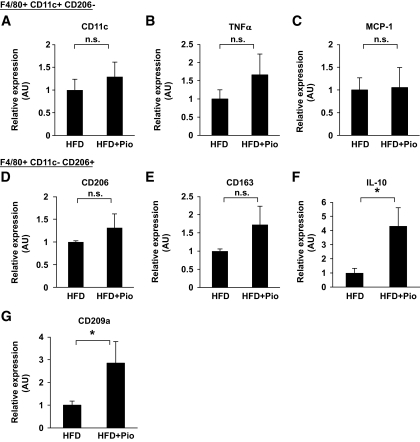
We next evaluated the changes in the gene expression profiles of each cell in the M1 and M2 fractions. After sorting the cells into M1 and M2 fractions, the expressions of several M1 and M2 markers were measured. Because the cell count in the M1 fraction from normal chow-fed mice was very low, the expressions of M1 marker genes could not be measured by our usual methods in these mice. Thus, we compared the expressions of M1 and M2 markers in the M1 and M2 fractions normalized according to the number of macrophages only in high-fat–fed mice. The expressions of the M1 markers in the M1 fraction were not altered by pioglitazone treatment, whereas some M2 markers, such as IL-10 and CD209, were selectively increased in the M2 fraction (Fig. 4A–C). Taken together, these results suggest that the expression of M1 markers in whole epididymal fat tissue is mainly regulated by the number of macrophages, while the expression of M2 markers in whole tissue strongly reflects the gene expressions in each cell.
FIG. 4.
Effect of pioglitazone on gene expressions in CD11c-positive and -negative fractions. Macrophages in the F4/80-positive/CD11c-positive/CD206-negative fraction or the F4/80-positive/CD11c-negative/CD206-positive fraction of epididymal fat tissue were sorted using flow cytometry as described in Fig. 2. Total RNA was isolated, and real-time RT-PCR for the indicated genes was conducted as described in the research design and methods section. Data were normalized according to the 18S mRNA level. The results are shown as the means ± SE for six animals per group. *P < 0.05.
High-fat feeding upregulated IL-10 expression in the adipocyte fraction.
We next investigated the expression of cytokines in the adipocyte fraction, which may regulate the differentiation or recruitment of ATMs. The expression of TNF-α or IL-6 in the adipocyte fraction was significantly increased or tended to be increased by high-fat feeding, but the expression of MCP-1 was not (Fig. 5A–C). These data suggest the involvement of adipocyte-derived TNF-α or IL-6 in the regulation of the profiles of ATMs, but the involvement of MCP-1 was less likely. Kang et al. (19) recently reported that adipocyte-derived IL-4 and IL-13 upregulate myeloid PPARδ to promote the alternative activation of M2 macrophages. In contrast to Kang et al.'s report, we could barely detect the gene expressions of IL-4 or IL-13 in the adipocyte fractions, although they were detected in the spleen (data not shown). On the other hand, the expression of IL-10 was significantly increased by an HFD and decreased by pioglitazone treatment (Fig. 5D).
FIG. 5.
Effect of HFD and pioglitazone on gene expressions of adipocyte fraction in epididymal fat tissue. Total RNA from the adipocyte fraction was isolated, and real-time RT-PCR for the indicated genes was conducted as described in the research design and methods section. Data were normalized according to the 18S mRNA level. The results are shown as the means ± SE for six animals per group. *P < 0.05.
Systemic overexpression of IL-10 by adenovirus vector increased M2 macrophages in epididymal fat tissue.
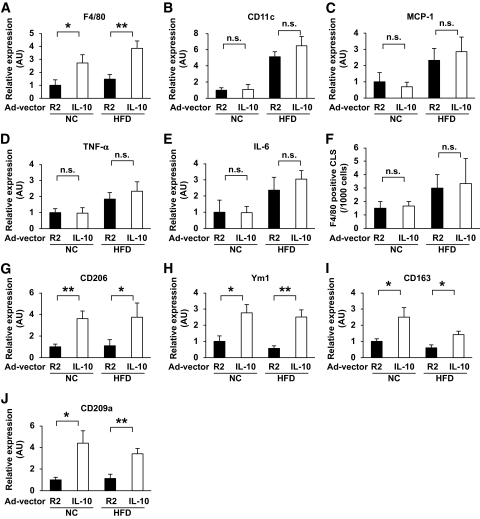
IL-10 has also been reported to promote the differentiation of M2 macrophages (13). To determine the impact of the enhanced expression of IL-10 in adipose tissue by an HFD and/or pioglitazone treatment (Fig. 1H and Fig. 4F), we examined whether IL-10 is involved in M2 macrophage recruitment to adipose tissue. IL-10 was systemically overexpressed in both standard diet–fed and high-fat–fed mice through the intraperitoneal injection of adenovirus vectors. Serum IL-10 levels increased transiently and peaked at a serum level of ∼300 pg/ml 4 days after injection (data not shown). Thus, the effects of IL-10 overexpression on the ATM profiles in epididymal fat tissue were evaluated on day 4. IL-10 overexpression increased the F4/80 mRNA in both standard diet–fed and high-fat–fed mice (Fig. 6A). Unexpectedly, IL-10 overexpression did not suppress the expression of M1 macrophage markers, such as CD11c, MCP-1, TNF-α, and IL-6 (Fig. 6B–E). Consistent with the data of M1 markers, IL-10 overexpression did not affect the number of F4/80-positive CLSs, which are reportedly formed mainly by M1 macrophages (Fig. 6F). Rather, the expression of all the M2 markers (e.g., CD206, Ym1, CD163, and CD 209a) were markedly upregulated by the treatment (Fig. 6G–J). These results suggest that the enhanced expression of IL-10 is involved in the recruitment of M2 macrophages into adipose tissue.
FIG. 6.
Effect of IL-10 overexpression on macrophage genes in epididymal fat tissue. Mice were fed with a normal chow (NC) or a HFD and were subsequently injected with either Ad-hIL-10 (IL-10) or a control vector (R2), then killed 4 days after injection. Purification of the mRNA and real-time RT-PCR for the indicated genes were performed as described in the research design and methods section. F: Epididymal fat tissues were stained with anti-F4/80 antibody. Then the number of CLSs was counted, as described in the research design and methods section. Results are shown as the mean ± SE of at least four mice per group. *P < 0.05; **P < 0.01.
DISCUSSION
Many previous studies (1–3,10) have reported that the number of ATMs is elevated in both the subcutaneous fat and epididymal fat tissues of obese human subjects or rodents. Recently, Lumeng et al. (10) reported that CD11c-positive ATMs express proinflammatory cytokines such as TNF-α and IL-6, while CD11c-negative ATMs express M2 markers such as Ym-1, arginase1, and IL-10. They defined the former as M1 ATMs and the latter as M2 ATMs. We extended their report and analyzed the SVF of adipose tissue using flow cytometry and CD11c and CD206 as M1 and M2 markers, respectively. We found that most of the CD11c-positive ATMs were CD206 negative and that most of the CD206-positive ATMs were CD11c negative, indicating that these two subsets of ATMs constitute distinct populations (Fig. 2A). As previously reported (10), our current data also showed that CD11c-positive cells expressed several proinflammatory cytokines, such as TNF-α and IL-6, and that CD206-positive cells expressed very different gene markers, including CD163, CD209, IL-10, and MglII (Fig. 2). These results demonstrate that M1 and M2 macrophages can be more clearly distinguished using CD206 as an M2 marker in addition to using CD11c as an M1 marker. Recently, Lumeng et al. (14) used MglI as a surface marker for M2 macrophages and identified an M2 macrophage population that expresses IL-10 at high levels. Our flow cytometry analysis showed that the expression of CD206 and MglI were strongly correlated (Fig. 2C). We believe that CD206 is as good a marker as MglI for detecting M2 populations. As for double-negative cells for CD206 and CD11c, these cells expressed lower levels of M1 markers such as TNF-α and IL-6 than CD11c single-positive F4/80-positive cells. In addition, they expressed lower levels of M2 markers such as MglII, IL-10, and CD163 than CD206 single-positive F4/80-positive cells (data not shown). It seems that they are a less mature or less polarized type of macrophages.
Similar to previous reports (10), our present study showed that diet-induced obesity increased the number of CD11c-positive/CD206-negative M1 macrophages by 65-fold, when normalized according to the weight of epididymal fat (Fig. 3D). On the other hand, the number of CD11c-negative/CD206-positive M2 macrophages per weight basis was also increased by sixfold (Fig. 3D), although the ratio of M1-to-M2 macrophages was increased (Fig. 3C). The primary trigger for the recruitment of M1 macrophages is thought to be the secretion of TNF-α from enlarged adipocytes (3). This cytokine is presumed to stimulate preadipocytes and endothelial cells to produce MCP-1, thus recruiting monocytes into the adipose tissue and stimulating M1 ATM differentiation (6,10). In contrast, the molecular signals that trigger the recruitment of M2 macrophages in obese adipose tissues are not fully understood. The activation of PPARγ signaling in macrophages has also been reported to be necessary for the alternative activation of ATMs (17,23). It was recently demonstrated that in response to adipocyte-derived Th2 cytokines, including IL-4 and IL-13, the expression of PPARβ/δ was induced, thus leading to the differentiation or recruitment of the alternative M2 phenotype in Kupffer cells and ATMs in mice (19,20). We found that the gene expression of IL-10 was elevated in both adipose tissue and adipocyte fraction in obese mice (Figs. 1H and 5D). Furthermore, the systemic overexpression of IL-10 increased M2 macrophages in epididymal fat tissue (Fig. 6). Thus, we speculated that the activation of IL-10 signaling as well as IL-4/IL-13 in monocytes may contribute to the increase in M2 ATMs.
Since IL-10 gene expression is increased in both the adipocyte fraction and the macrophage fraction, we speculated that IL-10 might be involved in M2 macrophage recruitment under HFD conditions. Adipocyte enlargement is known to be observed earlier than the accumulation of macrophages in adipose tissue (1,2,6). Thus, the increased expression of IL-10 in larger adipocytes might trigger the recruitment of M2 macrophages at an earlier stage. In contrast, pioglitazone reduced the number of M2 macrophages, while upregulating the expression of IL-10. We presume that factors other than IL-10, which should be reduced by pioglitazone treatment, are responsible for the reduced number of M2 macrophages.
We also compared the expression of the IL-10 gene in the adipocyte fraction and the M2 macrophage fraction. We found that the expression of IL-10 in M2 macrophages was ∼100-fold higher than that in adipocytes (data not shown), suggesting that M2 macrophage–derived IL-10 constitutes a major portion of the IL-10 in adipose tissue. Thus, the pioglitazone-induced increase in the whole adipose tissue can be explained by the increased expression of IL-10 in the M2 macrophages. Meanwhile, the reduced expression of IL-10 in the adipocytes had a minimal affect on the whole adipose tissue after pioglitazone treatment.
Then, what is the role of M2 macrophages in terms of insulin resistance? IL-10 is reported to improve insulin-stimulated glucose uptake in TNF-α–treated 3T3-L1 adipocytes (10). In fact, our preliminary results indicated that IL-10 overexpression using adenovirus vector improves insulin sensitivity in standard diet–fed and high-fat–fed mice. Thus, it may be possible that adipose tissue/M2 ATM–derived IL-10 may contribute not only to anti-inflammatory effects in adipose tissue but also to improving insulin signaling in adipocytes.
Whether the increase in the M1-to-M2 ratio in obese mice is due to the transdifferentiation of M2 macrophages into M1 macrophages or the de novo recruitment of monocytes into the adipose tissue has been a topic of investigation. Because our data showed that the numbers of both M1 and M2 macrophages increased, we presumed that the phenotypic shift of ATMs toward an M1-dominant state cannot be explained simply by the conversion of M2 macrophages to M1 macrophages but rather by the de novo recruitment of circulating monocytes to adipose tissue followed by their differentiation into M1 and M2 macrophages. Consistent with this scenario, a recent report by Lumeng et al. (14) also demonstrated that pulse-labeled ATMs were recruited from spatially distinct regions to the adipose tissue of diet-induced obese mice.
Pioglitazone reduced the number of both M1 and M2 ATMs. We previously hypothesized that the size of adipocytes is inversely related to insulin sensitivity based on the observation that a thiazolidinedione increased the number of smaller adipocytes and decreased the number of larger adipocytes (24,25). Since larger adipocytes produce more reactive oxygen species (ROS), ROS might be one of the triggers that recruit macrophages into adipose tissue (26). Once a thiazolidinedione is administered, the decreased ROS production by smaller adipocytes may result in the reduction in the total number of ATMs. The marked reduction of M1 ATMs may explain, at least in part, the hypothesis that smaller adipocytes are associated with insulin sensitivity. As for M2 ATMs, the increased expression of IL-10 after pioglitazone treatment may explain the observation that the reduction of the M2 number was less than that of the M1 ATM number. Pioglitazone may directly bind to the peroxisome proliferator response element sites in the IL-10 gene promoter and stimulate the IL-10 gene expression within macrophages (23,27). The increased expression of IL-10 by pioglitazone may contribute to the amelioration of insulin resistance (28–30).
In this study, we identified two clearly separate macrophage fractions in flow cytometry analysis using CD206 as a marker for M2 macrophages in addition to CD11c, a well-established M1 marker. These two fractions exhibited completely different gene expression patterns. We found that the number of M1 ATMs and M1-to-M2 ratio were closely associated with insulin resistance in an HFD plus pioglitazone group as well as an HFD group. Furthermore, we also suggested that IL-10 upregulated under HFD conditions might be involved in M2 macrophage recruitment, thus contributing to reducing inflammation and improving insulin signal.
Acknowledgments
This work was supported by a Grant-in-Aid for Scientific Research from the Ministry of Education, Science, Sports, and Culture, Japan (18209033 to K.T.).
No potential conflicts of interest relevant to this article were reported.
We thank Dr. Ichiro Takasaki, Takako Matsushima, Hideki Hatta, Tokimasa Kumada, Tomomi Kubo, Junko Ishiguro, Dr. Hikari Suzuki, Dr. Yu Yamazaki, Dr. Aminuddin, Dr. Manabu Ishiki, Dr. Minoru Iwata, and Dr. Tomomi Ichikawa for their excellent technical assistance. We also thank Dr. Nozomu Kamei (Hiroshima University) and Dr. Masashi Aoyama (Tokyo University) for helpful discussions.
Footnotes
The costs of publication of this article were defrayed in part by the payment of page charges. This article must therefore be hereby marked “advertisement” in accordance with 18 U.S.C. Section 1734 solely to indicate this fact.
REFERENCES
- 1.Weisberg SP, McCann D, Desai M, et al. : Obesity is associated with macrophage accumulation in adipose tissue. J Clin Invest 2003;112:1796–1808 [DOI] [PMC free article] [PubMed] [Google Scholar]
- 2.Xu H, Barnes GT, Yang Q, et al. : Chronic inflammation in fat plays a crucial role in the development of obesity-related insulin resistance. J Clin Invest 2003;112:1821–1830 [DOI] [PMC free article] [PubMed] [Google Scholar]
- 3.Wellen KE, Hotamisligil GS: Obesity-induced inflammatory changes in adipose tissue. J Clin Invest 2003;112:1785–1788 [DOI] [PMC free article] [PubMed] [Google Scholar]
- 4.Arkan MC, Hevener AL, Greten FR, et al. : IKK-beta links inflammation to obesity-induced insulin resistance. Nat Med 2005;11:191–198 [DOI] [PubMed] [Google Scholar]
- 5.Hotamisligil GS: Inflammation and metabolic disorders. Nature 2006;444:860–867 [DOI] [PubMed] [Google Scholar]
- 6.Kamei N, Tobe K, Suzuki R, et al. : Overexpression of monocyte chemoattractant protein-1 in adipose tissues causes macrophage recruitment and insulin resistance. J Biol Chem 2006;281:26602–26614 [DOI] [PubMed] [Google Scholar]
- 7.Kanda H, Tateya S, Tamori Y, et al. : MCP-1 contributes to macrophage infiltration into adipose tissue, insulin resistance, and hepatic steatosis in obesity. J Clin Invest 2006;116:1494–1505 [DOI] [PMC free article] [PubMed] [Google Scholar]
- 8.Weisberg SP, Hunter D, Huber R, et al. : CCR2 modulates inflammatory and metabolic effects of high-fat feeding. J Clin Invest 2006;116:115–124 [DOI] [PMC free article] [PubMed] [Google Scholar]
- 9.Qatanani M, Lazar MA: Mechanisms of obesity-associated insulin resistance: many choices on the menu. Genes Dev 2007;21:1443–1455 [DOI] [PubMed] [Google Scholar]
- 10.Lumeng CN, Bodzin JL, Saltiel AR: Obesity induces a phenotypic switch in adipose tissue macrophage polarization. J Clin Invest 2007;117:175–184 [DOI] [PMC free article] [PubMed] [Google Scholar]
- 11.Gordon S: Alternative activation of macrophages. Nat Rev Immunol 2003;3:23–35 [DOI] [PubMed] [Google Scholar]
- 12.Gordon S, Taylor PR: Monocyte and macrophage heterogeneity. Nat Rev Immunol 2005;5:953–964 [DOI] [PubMed] [Google Scholar]
- 13.Mantovani A, Sica A, Sozzani S, et al. : The chemokine system in diverse forms of macrophage activation and polarization. Trends Immunol 2004;25:677–686 [DOI] [PubMed] [Google Scholar]
- 14.Lumeng CN, DelProposto JB, Westcott DJ, et al. : Phenotypic switching of adipose tissue macrophages with obesity is generated by spatiotemporal differences in macrophage subtypes. Diabetes 2008;57:3239–3246 [DOI] [PMC free article] [PubMed] [Google Scholar]
- 15.Uysal KT, Wiesbrock SM, Marino MW, et al. : Protection from obesity-induced insulin resistance in mice lacking TNF-alpha function. Nature 1997;389:610–614 [DOI] [PubMed] [Google Scholar]
- 16.Patsouris D, Li PP, Thapar D, et al. : Ablation of CD11c-positive cells normalizes insulin sensitivity in obese insulin resistant animals. Cell Metab 2008;8:301–309 [DOI] [PMC free article] [PubMed] [Google Scholar]
- 17.Odegaard JI, Ricardo-Gonzalez RR, Goforth MH, et al. : Macrophage-specific PPARgamma controls alternative activation and improves insulin resistance. Nature 2007;447:1116–1120 [DOI] [PMC free article] [PubMed] [Google Scholar]
- 18.Hevener AL, Olefsky JM, Reichart D, et al. : Macrophage PPAR gamma is required for normal skeletal muscle and hepatic insulin sensitivity and full antidiabetic effects of thiazolidinediones. J Clin Invest 2007;117:1658–1669 [DOI] [PMC free article] [PubMed] [Google Scholar]
- 19.Kang K, Reilly SM, Karabacak V, et al. : Adipocyte-derived Th2 cytokines and myeloid PPARdelta regulate macrophage polarization and insulin sensitivity. Cell Metab 2008;7:485–495 [DOI] [PMC free article] [PubMed] [Google Scholar]
- 20.Odegaard JI, Ricardo-Gonzalez RR, Red Eagle A, et al. : Alternative M2 activation of Kupffer cells by PPARdelta ameliorates obesity-induced insulin resistance. Cell Metab 2008;7:496–507 [DOI] [PMC free article] [PubMed] [Google Scholar]
- 21.Wada T, Sasaoka T, Funaki M, et al. : Overexpression of SH2-containing inositol phosphatase 2 results in negative regulation of insulin-induced metabolic actions in 3T3–L1 adipocytes via its 5′-phosphatase catalytic activity. Mol Cell Biol 2001;21:1633–1646 [DOI] [PMC free article] [PubMed] [Google Scholar]
- 22.Cinti S, Mitchell G, Barbatelli G, et al. : Adipocyte death defines macrophage localization and function in adipose tissue of obese mice and humans. J Lipid Res 2005;46:2347–2355 [DOI] [PubMed] [Google Scholar]
- 23.Stienstra R, Duval C, Keshtkar S, et al. : Peroxisome proliferator-activated receptor gamma activation promotes infiltration of alternatively activated macrophages into adipose tissue. J Biol Chem 2008;283:22620–22627 [DOI] [PubMed] [Google Scholar]
- 24.Okuno A, Tamemoto H, Tobe K, et al. : Troglitazone increases the number of small adipocytes without the change of white adipose tissue mass in obese Zucker rats. J Clin Invest 1998;101:1354–1361 [DOI] [PMC free article] [PubMed] [Google Scholar]
- 25.Kubota N, Terauchi Y, Miki H, et al. : PPAR gamma mediates high-fat diet-induced adipocyte hypertrophy and insulin resistance. Mol Cell 1999;4:597–609 [DOI] [PubMed] [Google Scholar]
- 26.Furukawa S, Fujita T, Shimabukuro M, et al. : Increased oxidative stress in obesity and its impact on metabolic syndrome. J Clin Invest 2004;114:1752–1761 [DOI] [PMC free article] [PubMed] [Google Scholar]
- 27.Thompson PW, Bayliffe AI, Warren AP, et al. : Interleukin-10 is upregulated by nanomolar rosiglitazone treatment of mature dendritic cells and human CD4+ T cells. Cytokine 2007;39:184–191 [DOI] [PubMed] [Google Scholar]
- 28.Esposito K, Pontillo A, Giugliano F, et al. : Association of low interleukin-10 levels with the metabolic syndrome in obese women. J Clin Endocrinol Metab 2003;88:1055–1058 [DOI] [PubMed] [Google Scholar]
- 29.Straczkowski M, Kowalska I, Nikolajuk A, et al. : Plasma interleukin-10 concentration is positively related to insulin sensitivity in young healthy individuals. Diabetes Care 2005;28:2036–2037 [DOI] [PubMed] [Google Scholar]
- 30.Kim HJ, Higashimori T, Park SY, et al. : Differential effects of interleukin-6 and -10 on skeletal muscle and liver insulin action in vivo. Diabetes 2004;53:1060–1067 [DOI] [PubMed] [Google Scholar]


