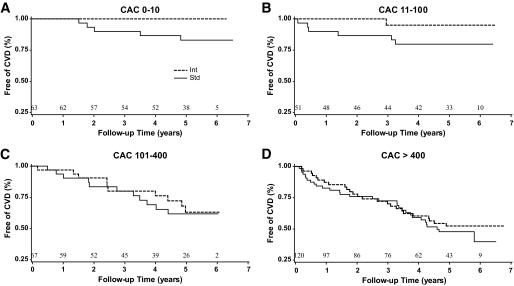
FIG. 2.
Kaplan-Meier curves for time to primary macrovascular end point by clinical categories of CAC (0–10 [A], 11–100 [B], 101–400 [C], and >400[D]) in those randomized to the standard (Std) or intensive (Int) therapy arm. Differences between treatment groups were significant in A (P = 0.03). Shown above the x-axes are the total numbers of participants at risk at baseline and the beginning of each follow-up year through year 6.

