Abstract
Molecules of the general form Tp*MoO(OR)2 (where Tp* = hydrotris(3,5-dimethyl-1-pyrazolyl)borate and (OR)2 = (OMe)2, (OEt)2, and (OnPr)2 for alkoxide ligands, and (OR)2 = O(CH2)3O, O(CH2)4O, and O[CH(CH3)CH2CH(CH3)]O for diolato ligands) were studied using gas-phase photoelectron spectroscopy, cyclic voltammetry, and density functional theory calculations to examine the effect of increasing ligand size and structure on the oxo-molybdenum core. Oxidation potentials and first ionization energies are shown to be sensitive to the character of the diolato and alkoxide ligands. A linear correlation between the solution-phase oxidation potentials and the gas-phase ionization energies resulted in an unexpected slope of greater than unity. Density functional theory calculations indicated that this unique example of a system in which oxidation potentials are more sensitive to substitution than vertical ionization energies is due to the large differences in the cation reorganization energies, which range from 0.2 eV or less for the molecules with diolato ligands to around 0.5 eV for the molecules with alkoxide ligands.
Introduction
Molybdenum-containing enzymes play an important biological role in animals, plants, and microorganisms. Oxomolybdenum active sites are involved in the metabolism of sulfur, nitrogen, and carbon. These catalytic active sites undergo formal two-electron redox processes between the Mo(VI) and Mo(IV) oxidation states,1 therefore, it is important to understand the electron transfer properties of oxomolybdenum centers. Extensive work has been performed on oxo-Mo(V) centers containing the tridentate ligand hydrotris(3,5-dimethyl-1-pyrazolyl) borate (Tp*). Previous work compared ligands with oxygen donor atoms to ligands containing sulfur donor atoms.2–4 The studies concluded that due to the greater amount of covalency in Mo-S bonds compared to Mo-O bonds, sulfur atom ligation leads to smaller cation reorganization energies. Hence, as according to Marcus theory, faster electron transfer rates are obtainable at oxomolybdenum centers with sulfur atom ligation.5
Photoelectron spectroscopy is a direct measure of the energy for electron transfer from a molecule. In this technique the electron is transferred to the vacuum and the energy is accurately referenced to gas phase optical transitions.6,7 Detailed information on the ionization energies and cation reorganization energies can be obtained on a fast time scale and in the absence of environmental effects.8–10 In a study of the gas-phase photoelectron ionizations and electrochemical potentials of oxo-Mo(V) molecules that contain phenoxide ligands it was found that the energies for electron removal to form the cation were highly sensitive to changing the para substituent on the phenoxide ligands.11 When comparing the values, it was seen that the electrochemical potentials were less sensitive to changes in the substituent than were the gas-phase photoelectron ionizations. This trend is typical and expected based on the solvent stabilization of the cation that has a leveling effect on the energy required for removal of an electron. In contrast, a similar study of oxo-Mo(V) molecules containing alkoxide ligands compared to similar molecules containing dialoto ligands suggested that the oxidation potentials were more sensitive to the substitution than were the ionization energies.12 To our knowledge this trend is unprecedented.
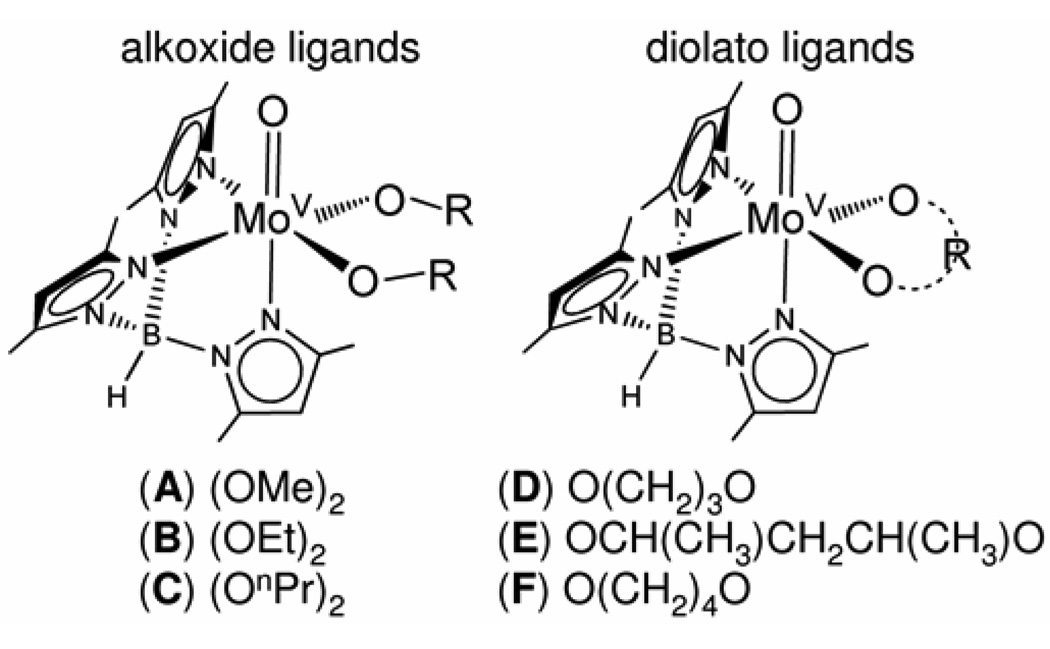
In the study reported here, oxidation potentials measured by electrochemistry and ionization energies measured by photoelectron spectroscopy are interpreted with the aid of computations by density functional theory for a series of oxo-Mo(V) molecules substituted with diolato and alkoxide ligands (Figure 1). All of the molecules show a quasi-reversible one-electron oxidation in dichloromethane and a broad low-energy ionization band in the gas-phase photoelectron spectra, both of which are sensitive to the composition of the diolato or alkoxide ligands.
Figure 1.
General structure of Tp*MoO(OR)2 and Tp*MoO(O2R) molecules.
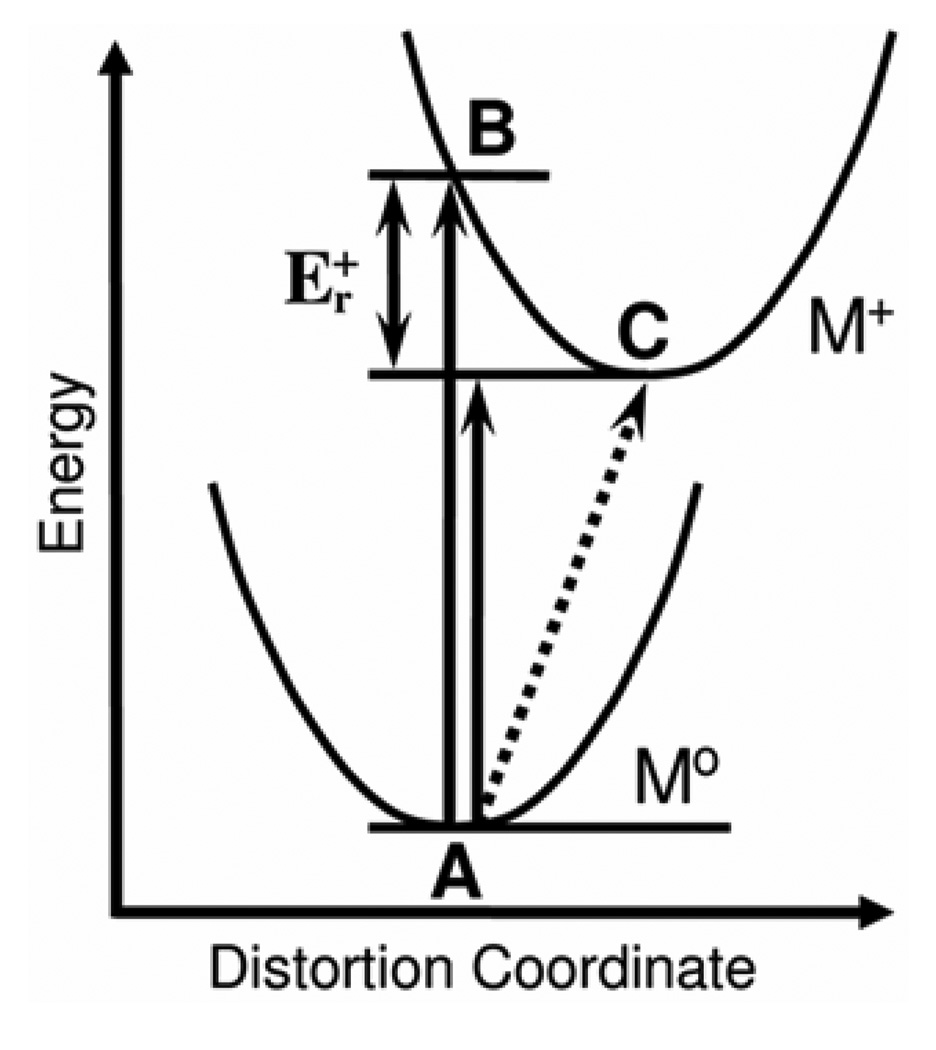
To set the framework for discussion, Figure 2 is a schematic of the electrochemical oxidation and photoelectron ionization measures of the energy difference from the neutral molecule to the molecular cation. The lower potential curve in Figure 2 represents the energy of distortion of the neutral molecule from the lowest energy structure at point A, and the upper potential curve represents the energy of distortion of the cation away from the optimum structure at point C. The energy from point A to point B in Figure 2 is the vertical ionization energy (IEv). The IEv is observed in photoelectron spectroscopy as the point of highest intensity of the ionization band. The energy difference between points A and C in Figure 2 represents the adiabatic ionization energy, which is generally indicated in the photoelectron spectrum by the onset of ionization intensity. 13 The difference in energy from the vertical to the adiabatic ionization is the cation reorganization energy, Er+.8 This reorganization energy will be a focus of this study. The magnitude of Er + is reflected simply in the width of the first ionization band. The slower time scale of cyclic voltammetry compared to photoelectron spectroscopy allows full geometry relaxation and direct measure of the energy between points A and C (represented by the dashed line in Figure 2), however, cyclic voltammetry is a free energy measurement rather than a spectroscopic energy measurement and also incurs energy changes associated with solvent effects not present in the gas phase. Theoretical vertical ionization energies, cation reorganization energies, and free energies of oxidation in solution were also computed and compared with the experimental measures. A unique correlation between the results from the photoelectron spectra and the cyclic voltammograms is presented.
Figure 2.
Diagram illustrating the relationship among photoelectron ionization energies, cation reorganization energies, and electrochemical measurements for classical potential wells with unresolved vibrational structure. The vertical arrows represent spectroscopic ionization energies measured in the gas phase on the fast time scale of photoelectron spectroscopy, and the dashed line represents the free energy of oxidation measured in solution on the slower time scale of cyclic voltammetry. See the introduction section for further explanation.
Experimental
Preparations
Molecules A–D and F were prepared according to previously reported methods.14 Molecule E was synthesized using the same method as molecules A–D. All molecules were characterized by mass spectrometry, cyclic voltammetry, and photoelectron spectroscopy.
Photoelectron Spectroscopy
Photoelectron spectra were recorded on the same instrument and analyzed with the same spectral fitting procedures as reported previously.15 The position of the peak maximum in the analytical representation of the first ionization band is reproducible to about ± 0.02 eV. All samples sublimed cleanly without evidence of decomposition. Sublimation temperature ranges were 132 – 145 °C for A, 147 – 151 °C for B, 124 – 138 °C for C, 152 – 161 °C for D, 147 – 151 °C for E, and 153 – 161 °C for F.
Electrochemical Measurements
All electrochemical experiments were performed at room temperature using a Bioanalytical Systems (BAS) CV-50W potentiostat. All solutions contained ~0.1 M tertrabutylammonium tetrafluoroborate as a supporting electrolyte in degassed, anhydrous dichloromethane. A scan rate of 0.1 V/s was used for all voltammograms. A platinum-disk working electrode (1.6 mm diameter) was used with a platinum wire auxiliary electrode and a Ag/AgCl reference electrode. The working electrode was polished with alumina prior to each experiment. Potentials were measured with respect to the ferrocene/ferrocenium (Fc/Fc+) couple, which was measured in a separate solution, and all values are reported as the average of the oxidation and reduction peaks (E1/2) with respect to the Fc/Fc+ redox couple.
Density Functional Theory Calculations
All calculations were performed using ADF2006.01d.16–18 Geometry optimizations and frequency calculations were carried out using the VWN functional with the Stoll correction implemented on the complete molecules including the methyl groups of the Tp* ligand.19 The OPTX density functional was used to calculate all electronic energies reported.20 The OPTX functional was compared to many other common functionals found in the ADF package, and the OPTX functional most accurately predicted oxidation potentials and ionization energies for this series of oxo-Tp*Mo molecules. A triple-ζ̣STO basis set with one polarization function (TZP) was used in all calculations. Relativistic effects were taken into account in all calculations by using the scalar ZORA formalism21 implemented as part of the ADF2006.01d program. All electronic structures with unpaired spin were calculated using an unrestricted framework. Only low-spin molecules have been analyzed. The theoretical stretching frequencies for all species were calculated analytically and the lack of imaginary frequencies shows that each geometry was a true minimum. All figures of the geometry optimized structures were created using the program Molekel.22
Solvation effects on the molecules were modeled through the Conductor-like Screening Model (COSMO) of solvation.23 The solvent parameters implemented were those defined by the ADF2006.01d program to simulate a dichloromethane solvated environment. Thermal contributions to the free energy (G) values were calculated from the electronic self-consistent-field (SCF) energies considering the qtranslational, qrotational, and qvibrational contributions in the gas-phase.24 Enthalpy and entropy terms were calculated under standard temperature and pressure. The transferability of these thermal contributions to the solvent phase are not a serious concern for calculating the free energy differences with oxidation because the differences in translational, rotational, and vibrational contributions are small for removal of one electron.
Standard potentials versus ferrocene were computed as the free energy difference of the reaction Fc+ + A ⇌ Fc + A+, where A is the oxo-Tp*Mo molecule under investigation. From this, the standard potential is obtained by the relation EoA/A+ vs. ferrocene = −ΔGorxn/F where F is Faraday’s constant. When the free energy is expressed in units of volts the numerical value of the Faraday constant is 1. The absolute half-cell potential for the Fc/Fc+ couple was calculated to be 5.17 V in dichloromethane.
Results and Discussion
Photoelectron Spectroscopy
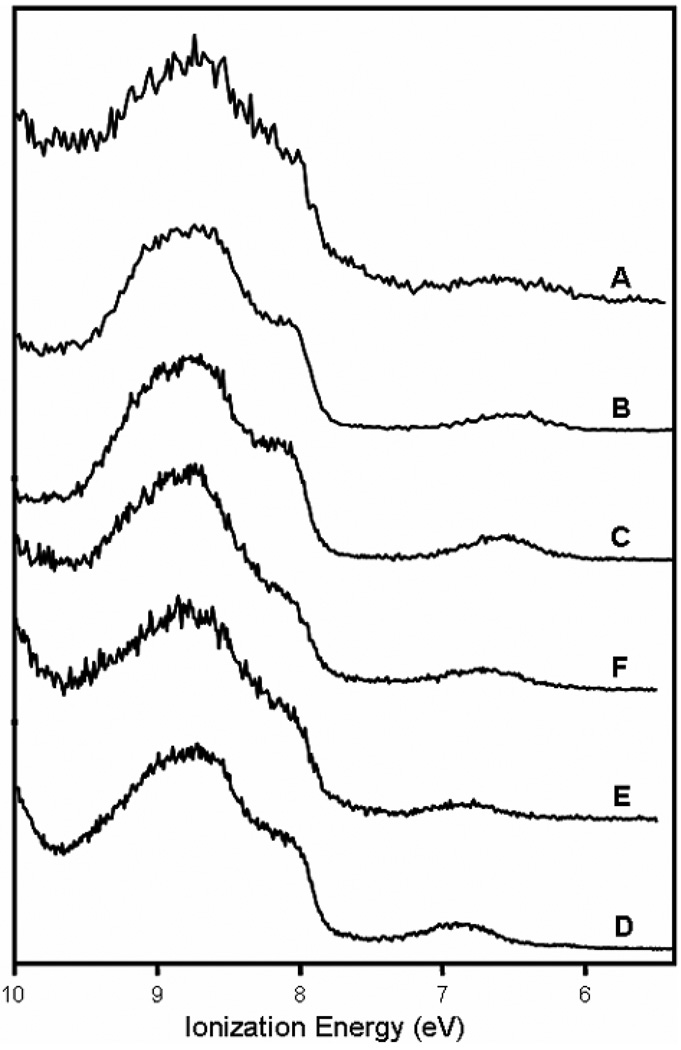
The He I photoelectron spectra of the six Tp*MoO(OX)2 molecules of this study are displayed in Figure 3. The photoelectron spectra of molecules A–D and F have been measured previously12 and are repeated here to ensure similar accuracy and consistency in the determination of the ionization energies for comparison to the measured oxidation potentials in this series. The spectra shown in Figure 3 match the spectra reported previously within the variations of signal-to-noise, resolution, and baselines of scattered electrons. The spectra from 5.5 to10 eV ionization energy show two main features in the ionization profile: a symmetric, broad, low-intensity band between 6 and 7.5 eV and a complex ionization band above 7.5 eV. Ionizations above 7.5 eV are attributed to filled orbitals of the ligands12 and were not analyzed further for this study. The band below 7.5 eV, however, is attributed to the ionization of the lone d1 Mo(V) electron of these molecules. The broadness of these low energy ionization bands indicates large reorganization energies upon formation of the cation structures.25 For comparison with the ionizations of metal d electrons that are largely localized on the metal center and in non-bonding interactions, the width at half-height of the predominantly metal d a1 ionization of (η5-C5H5)2Mo(CH3)2 is about 0.3 eV26 and that of the predominantly metal d a1g ionization of ferrocene is about 0.1 eV.27 The width at half-height for the first ionizations shown in Figure 3 are on the order of 0.6 eV.
Figure 3.
Close-up HeI photoelectron spectra of Tp*MoO(OX)2 molecules. The broad band near 7 eV is assigned to the ionization of the Mo 4d1 electron. The spectra are displayed from top to bottom in order of increasing ionization energy of this band.
To gain further insight into the vertical ionization energies and the cation reorganization energies, density functional theory calculations were performed. The geometric and electronic structures for all six neutral and corresponding cation molecules were calculated. The calculated vertical ionization energies are compared to the experimental values in Table 1. The calculated values and the trends are in good agreement with the experimental values, indicating that the calculations are able to properly account for the geometric and electronic structures of the molecules. Within each series of molecules with alkoxide ligands or diolato ligands, the ionization energies shift slightly lower with increasing size of the hydrocarbon portion of the ligands, but the shifts are small and there is little difference overall in the vertical ionization energies between the alkoxide-containing and diolato-containing molecules.
Table 1.
Experimental and Calculated Vertical Ionization Energies (eV) and Oxidation Potentials (V versus Fc/Fc+).
| Molecule | Expt. IEv |
Calc. IEv |
Er+ | ΔGsolv | ΔG (trans, rot, vib) |
Calc. |
Expt. |
|---|---|---|---|---|---|---|---|
| alkoxide ligands | |||||||
| A | 6.63 | 6.66 | 0.50 | 0.86 | 0.04 | 0.09 | 0.09 |
| B | 6.60 | 6.54 | 0.48 | 0.85 | 0.02 | 0.02 | 0.05 |
| C | 6.58 | 6.52 | 0.51 | 0.81 | 0.06 | −0.03 | 0.03 |
| diolato ligands | |||||||
| D | 6.84 | 6.71 | 0.15 | 0.85 | 0.01 | 0.54 | 0.44 |
| E | 6.81 | 6.61 | 0.17 | 0.83 | 0.01 | 0.44 | 0.47 |
| F | 6.71 | 6.58 | 0.20 | 0.85 | 0.02 | 0.36 | 0.32 |
IEv is the gas-phase vertical ionization energy (eV). The experimental IEv values were obtained by fitting the spectroscopic data and have an uncertainty of ±0.02 eV. Er+ is the calculated gas-phase reorganization energy of the molecular positive ion (eV). ΔGsolv is the calculated difference in free energy of solvation of the molecular cation and neutral species in dichloromethane (Gs+ − Gso, eV). ΔGtrans,rot,vib is the calculated gas-phase translational, rotational, and vibrational contributions to the free energy change with ionization (eV). is the standard oxidation potential in V versus Fc/Fc+ with a ±5 mV uncertainty.
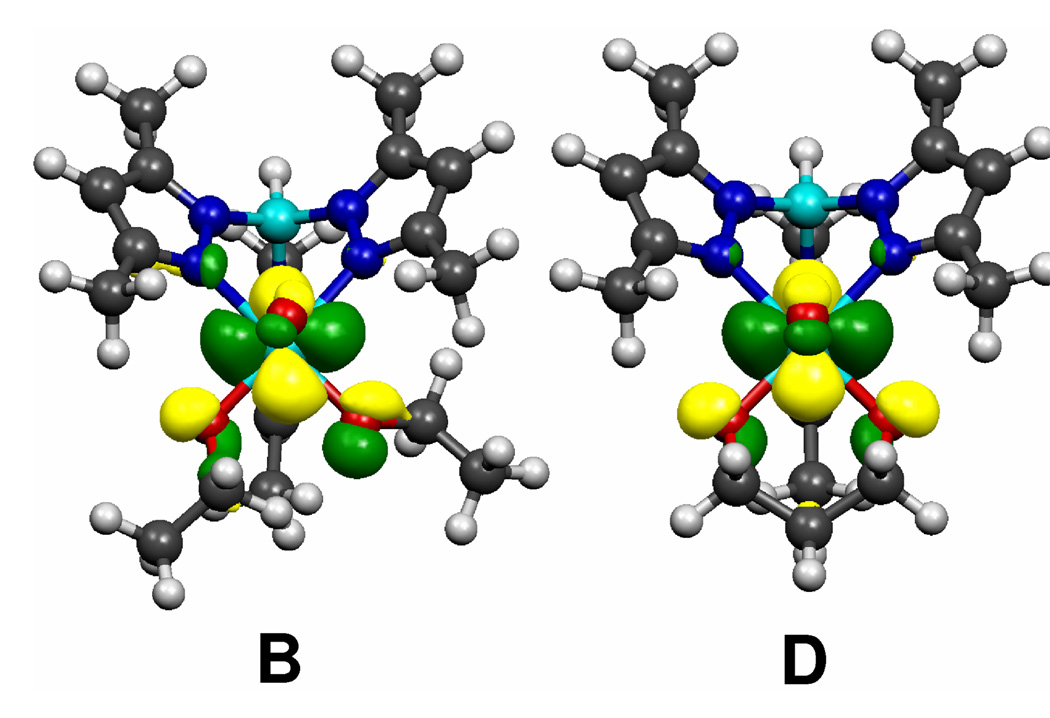
Figure 4 illustrates the lowest energy neutral structures for Tp*MoO(OEt)2 (B) and Tp*MoO[O(CH2)3O] (D) along with the calculated singly occupied molecular orbital (SOMO) for each molecule. The SOMO is the highest energy occupied orbital, and hence, the ionization from this orbital is responsible for the broad first band in the photoelectron spectra. As can be seen from Figure 4, the SOMO consists of primarily molybdenum character, but also contains some π anti-bonding character between the alkoxide or diolato oxygen atoms and the molybdenum center. This anti-bonding interaction between the pπ electrons of the oxygen atoms and the dπ electron of the molybdenum atom destabilizes the SOMO of the molecules. Ionization of the d1 Mo(V) electron relieves the repulsive interaction and results in a relaxation along the O-Mo-O bond angle and the oxo-Mo-O-C dihedral for the alkoxide molecules. This relaxation has been shown previously to be an important factor in cation reorganization energies of d1 bent metallocene CpMX2 molecules.28 The diolato molecules, however, cannot undergo large geometric reorganizations without putting excessive ring strain in the alkyl linkers of the chelating ligands. Table 2 lists the O-Mo-O bond angles and the oxo-Mo-O-C dihedrals for the computed lowest-energy neutral and cation molecules. As can be seen from Table 2, the alkoxide molecules are able to go through much larger geometric reorganizations upon ionization compared to the diolato molecules. These reorganizations help to stabilize the charge at the metal, and hence the alkoxide-containing molecules exhibit much larger cation reorganization energies, Er+.
Figure 4.
The calculated SOMO for representative alkoxide (B) and diolato (D) molecules. The SOMOs are primarily the lone Mo 4d1 electron, but they also contain considerable anti-bonding character from the O pπ orbitals.
Table 2.
Calculated changes in O-Mo-O bond angles and oxo-Mo-O-C dihedral angles upon ionization.a
| Molecule | O-Mo-O | oxo-Mo-O-Cb |
|---|---|---|
| alkoxide ligands | ||
| A | 11.5 | 34.6 |
| B | 11.3 | 30.0 |
| C | 10.5 | 25.4 |
| diolato ligands | ||
| D | 0.2 | 10.4 |
| E | 0.4 | 10.0 |
| F | 0.4 | 15.0 |
Only values for the lowest energy calculated structures are reported.
Values averaged over both dihedrals in molecule.
It is important to emphasize that the calculated values of Er+ are not similar for all the molecules. The calculated values for the cation reorganization energies are listed in Table 1 and range from a low of 0.15 to 0.20 eV for the diolato molecules in comparison to about 0.50 eV for the alkoxide molecules. The large calculated reorganization energies for the alkoxide molecules agree well with the broadness of the first ionization band in the photoelectron spectra. However, the photoelectron spectra of the diolato molecules also exhibit a large degree of broadening in the first peak despite the expected and calculated smaller reorganization energies. A further computational investigation into the diolato molecules indicated that the broadening was due to ionization of multiple geometric conformations of the chelating diolato ligands, which can adopt chair or boat structures. For Tp*MoO[O(CH2)4O], chair, boat, or boat-twist structures are possible for the diolato ring. The chair conformations were calculated as the lowest energy predominate conformers for D and E, and the boat-twist structure for F. A Boltzman distribution analysis, at the sublimation temperature of the molecules, however, indicated that the minor conformers are present and have an effect on the photoelectron spectrum. The calculated vertical ionizations of the minor conformers (Table 3) are higher in energy than the calculated vertical ionization energies of the major conformers by about 0.2 eV, but fall within the experimental ionization band. The ionizations of the minor conformers, therefore, should have a broadening effect on the first ionization band.
Table 3.
Calculated vertical ionization energies and thermal population analysis for conformations of the diolato molecules.
| Relative E (kcal/mol) |
IEv (eV) |
% of population |
|
|---|---|---|---|
| Molecule D | |||
| boat | +2.1 | 6.92 | 6 |
| chair | 0 | 6.71 | 94 |
| Molecule E | |||
| boat | +3.0 | 6.81 | 2 |
| chair | 0 | 6.61 | 98 |
| Molecule F | |||
| boat | +2.3 | 6.77 | 4 |
| chair | +3.4 | 6.63 | 1 |
| boat twist | 0 | 6.58 | 95 |
Another set of computations were also performed to further illustrate that the large Er+ values for the alkoxide molecules arise from the geometric changes that are unattainable in the diolato molecules. A geometry optimization calculation was performed on the cation of molecule A starting from the neutral geometry and with the O-Mo-O angle frozen to the value for the neutral molecule. The resulting cation with the frozen O-Mo-O angle was 0.16 eV higher in energy than the lowest energy cation structure of A, meaning the Er+ value was much smaller with this constraint. A similar calculation in which the O-Mo-O angle was allowed to optimize, but the oxo-Mo-O-C dihedral was frozen to the value found in the neutral molecule, also resulted in a decrease of the Er+, this time by 0.14 eV. Hence, the relaxations of the O-Mo-O bond angles and the oxo-Mo-O-C dihedrals in the alkoxide molecules account for a majority of the approximately 0.3 eV difference in the cation reorganization energies between the alkoxide and diolato containing molecules. These geometric reorganizations do not occur to the same extent for the diolato ligands and therefore much smaller calculated Er+ values are obtained for the diolato-containing molecules.
Electrochemistry
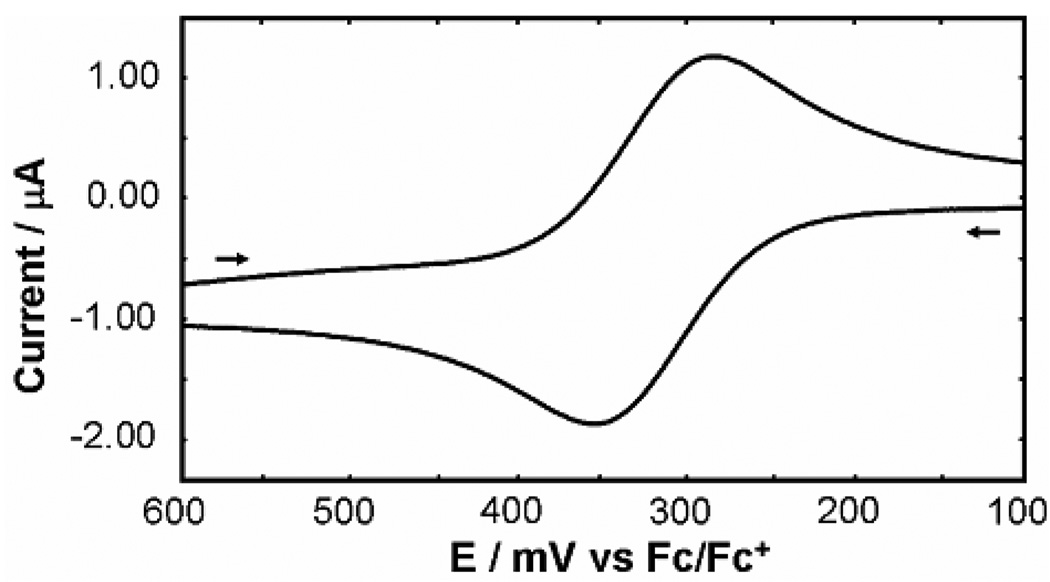
Cyclic voltammetry was used to determine the oxidation potentials for the Mo(V/VI) couple of the Tp*MoO(OX)2 molecules. All cyclic voltammograms (CVs) exhibited quasi-reversible waves as displayed by the voltammogram of F in Figure 5 (the areas under the oxidation and reduction waves are the same within one percent and the separation between the peaks is 68 mV at this scan rate), which is representative for the entire series of molecules. Reduction potentials of the Mo(V) species were not examined for this study, but have been reported previously.14
Figure 5.
Voltammogram of F that is representative of the Tp*MoO(OX)2 molecules. Experimental conditions found in Methods section. The arrows indicate the direction of the scan. Switching potentials not shown.
Initial examination of the CVs showed that the oxidation potentials for the Tp*MoO(OX)2 molecules are very sensitive to the character of the diolato rings and alkoxide chains. The measured oxidation potentials, listed in Table 1, range from 0.03 V to 0.47 V in dichloromethane (vs. Fc/Fc+). Also listed in Table 1 are the oxidation potentials obtained from the DFT computations. The strong agreement between the calculated and experimental oxidation potentials indicates that the calculations account well for the structural changes of the cations, along with the solvation energies associated with solution phase oxidation. These experimental measurements and computations set the stage for the following discussion.
Correlation Between Photoelectron Spectroscopy and Electrochemistry
Experimental and computational data both indicate that the gas-phase spectroscopic ionization energies are only moderately sensitive to the composition of the alkoxide and diolato ligands for this series of Tp*MoO(OX)2 molecules, whereas the solution-phase oxidation free energies are very sensitive to the exchange of alkoxide ligands for diolato ligands. Although photoelectron spectroscopy and electrochemistry differ in multiple ways, as analyzed below for these molecules, there is often a linear correlation between the measurements made by these the two techniques. The relationship between oxidation potentials (E1/2) and vertical ionization energies (IEv) can be represented by equation 1, where
| (1) |
C1 is a constant dependent on the reference potential, calculated here to be 5.17 V for the Fc/Fc+ couple in dichloromethane. The calculated values for each term in equation 1 for each of the molecules in this study are listed in Table 1. The major contributions to the oxidation potentials are the inherent ionization energies and reorganization energies (Er+), along with the free energies of solvation (Gs+ and Gso) associated with the cation and neutral molecules. The minor contribution from the changes in free energy of translational, rotational, and vibrational degrees of freedom (ΔGtrans,rot,vib) is small as expected because there is little change in molecular mass, molecular shape, and vibrational frequencies with removal of an electron from the SOMO of these molecules.
The solvation energy of a molecule, when expressed as a positive number, is defined as the energy required to remove a molecule from a solvated environment into vacuum. Neutral molecules of similar size and composition, such as the Tp*MoO(OX)2 molecules of this study, are expected to have very similar solvation energies (Gso). Charged molecules typically have larger solvation energies (Gs+) than neutral molecules because of the higher energy molecular charge - induced solvent dipole interactions as the cation is stabilized by the surrounding solvent molecules. If one assumes that the reorganization energies, solvation energies of the neutral molecules, and translational/rotational/vibrational free energy differences are either relatively small or do not change significantly through a given series of related molecules, then equation 1 can be rearranged to equation 2, where C2 is now approximately constant,
| (2) |
equaling Er+ − Gso + ΔGtrans,rot,vib + C1. A linear correlation of E1/2 with IEv in this case indicates Gs+ must be proportional to IEv, and the slope will be less than 1 because both Gs+ and IEv are positive numbers by definition. This correlation is often the case.11,29–31 For example, a previous study comparing E1/2 and IEv for a series of substituted ferrocene molecules resulted in a linear correlation with a slope of 0.73 and an R2 value of 0.97 in acetonitrile.29 The value of the slope was attributed to stronger interactions between the solvent and the ferrocene derivatives with higher ionization energies. Taking this slope value and the known vertical ionization energy IEv of ferrocene (6.86 eV27) gives a value for the solvent stabilization energy of ferrocene in acetonitrile, Gs+, of 1.85 eV. We have previously validated a computational approach that accounts extremely well for many properties, including pKa values and redox potentials, of iron-containing organometallic molecules.15,25,32 These calculations obtain a cation stabilization energy for ferrocene in acetonitrile of 1.90 eV. Hence, the results suggest that for series of molecules that satisfy the conditions of equation 2, which is often the case, the slope of the plot of E1/2 versus IEv offers a method to experimentally measure the solvent stabilization energies of cations.
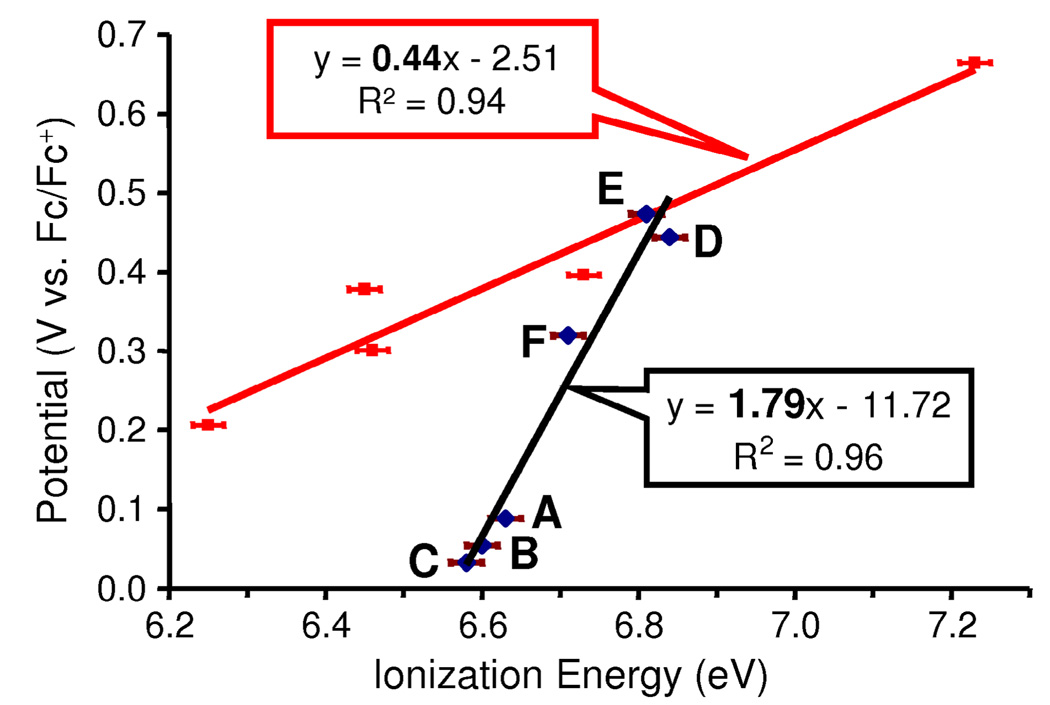
An example more closely related to the present study is the series of molecules with the general formula Tp*MoO(p-OC6H4X)2.11 The correlation of E1/2 with IEv is shown as the red line in Figure 6. The slope value of 0.44 (R2 = 0.94) suggests substantial solvent stabilization energies for the cations of these molecules that exhibit proportionality with the magnitude of the vertical ionization energies. Using the computational approach of the present study, the calculated Gs+ for Tp*MoO(p-OC6H4F)2 (IEv = 6.73 eV) is 0.19 eV greater than the Gs+ of Tp*MoO(OC6H5)2 (IEv = 6.45 eV), which is in reasonable agreement with the 0.16 eV increase predicted by equation 2.
Figure 6.
Correlation between experimental oxidation potentials (V vs. Fc/Fc+) and ionization energies (eV) for Tp*MoO(p-OC6H4X)2 molecules (red) and Tp*MoO(OX)2 molecules (black).
Also shown in Figure 6 is the correlation of experimental E1/2 with IEv values for the present series of Tp*MoO(OX)2 molecules that contain alkoxide and diolato ligands. It is immediately apparent that this series presents a much different situation compared to the correlation for the phenoxide molecules shown on the same plot. The most striking feature is the slope of 1.79, which is much greater than unity and inconsistent with equation 2. Plotting the correlation as separate groups of either just alkoxide-containing molecules or just diolato-containing molecules also results in slopes of greater than unity for each group (1.12 for the alkoxide-containing molecules and 1.10 for the diolato-containing molecules, see Supporting Information). The explanation for the slope greater than unity shown in Figure 6 presents itself in the values in Table 1. The calculated vertical ionization energies vary only over a small range reflecting the size of the hydrocarbon chains of the alkoxide and diolato ligands. In addition, the differences in solvent stabilization energies between the cations and the neutral molecules, ΔGs, are relatively small and nearly constant. As discussed earlier, the ionization is largely localized on the Mo center of the molecules, and the bulky Tp* ligand and the hydrocarbon portion of the alkoxide and diolato ligands helps “shield” the positively charged Mo center from the solvent molecules. In comparison to the similar oxo-Mo(V) molecules containing phenoxide ligands,11 the alkoxide and diolato ligands do not have a delocalized phenoxide π−system with the substituent on the periphery of the molecule. Our calculations indicate that the phenoxide ligands allow charge delocalization, which makes substitutions on the phenoxide-containing molecules more sensitive to solvent effects.
Under these circumstances for the alkoxide- and diolato-containing molecules, the cation reorganization energies, Er+, have the largest effect on the correlation. As shown in the analysis of the photoelectron spectra, the flexibility of the alkoxide ligands allows reorientation of the ligands for substantial stabilization of the cation, while the more constrained diolato ligands only allow much smaller cation reorganization energies. As a consequence the molecules with alkoxide ligands have much lower oxidation potentials than the molecules with diolato ligands, while the range of ionization energies is small. The oxidation potentials are more sensitive to the alkoxide and diolato ligand substitutions than are the vertical ionization energies, and the slope of the line is much greater than one. To our knowledge this is the first instance that a correlation slope greater than unity has been reported.
For comparison with sulfur-containing ligands, calculations were carried out also on Tp*MoO[S(CH2)3S], which is analogous to D but with sulfur atoms replacing the oxygen atoms. The calculated value for the cation reorganization energy Er+ was only 0.08 eV, which is roughly half the amount of cation reorganization energy calculated for D. A likely factor is the shorter Mo–O distances compared to the Mo–S distances, which create greater π repulsion between the metal d electron and the oxygen lone pairs in the neutral molecule and greater stabilization of the metal positive charge in the cation by the oxygen lone pairs. Smaller cation reorganization energies favoring faster electron transfer are thus expected for sulfur-containing ligands that are chelating to the metals or otherwise geometrically constrained in the enzymes.
Supplementary Material
Acknowledgments
Support of this research by the National Institutes of Health (GM-37773 to JHE) and by the National Science Foundation through the Collaborative Research in Chemistry program (CHE0527003 and CHE0749530 to DLL) is gratefully acknowledged. RAS was a participant in the Undergraduate Biology Research Program, supported in part by a grant to The University of Arizona from the Howard Hughes Medical Insitute (71195-5213040) and held a Beckman Scholar award through a grant to the University of Arizona from the Beckman Foundation. We thank M. Arvin, E. Klein, and D. Evans for helpful discussions throughout the phases of this research.
Footnotes
Supporting Information Available: Cyclic voltammograms of molecules A–E. Calculated structures of the neutral species of A–F and the phenolate and thiolate molecules. Cartesian coordinates of all structures. This material is available free of charge via the Internet at http://pubs.acs.org.
References
- 1.Hille R. Chem. Rev. 1996;96:2757–2816. doi: 10.1021/cr950061t. [DOI] [PubMed] [Google Scholar]
- 2.Olson GM, Schultz FA. Inorg. Chim. Acta. 1994;225:1–7. [Google Scholar]
- 3.Uhrhammer D, Schultz FA. Inorg. Chem. 2004;43:7389–7395. doi: 10.1021/ic040082i. [DOI] [PubMed] [Google Scholar]
- 4.Westcott BL, Gruhn NE, Enemark JH. J. Am. Chem. Soc. 1998;120:3382–3386. [Google Scholar]
- 5.Marcus RA. J. Chem. Phys. 1956;24:966–978. [Google Scholar]
- 6.Gruhn NE, Lichtenberger DL. Characterization of the Electronic Structure of Transition Metal Carbonyls and Metallocenes. Inorg. Electron. Struct. Spec. 1999;Vol. 2:533–574. [Google Scholar]
- 7.Gruhn NE, Lichtenberger DL. Photoelectron Spectroscopy. In: Scott RA, Lukehart CM, editors. Applications of Physical Methods to Inorganic and Bioinorganic Chemistry. Chichester, UK: John Wiley & Sons Ltd.; 2007. pp. 441–459. [Google Scholar]
- 8.Amashukeli X, Winkler JR, Gray HB, Gruhn NE, Lichtenberger DL. J. Phys. Chem. A. 2002;106:7593–7598. [Google Scholar]
- 9.Gruhn NE, da Silva Filho DA, Bill TG, Malagoli M, Coropceanu V, Kahn A, Bredas J. J. Am. Chem. Soc. 2002;124:7918–7919. doi: 10.1021/ja0175892. [DOI] [PubMed] [Google Scholar]
- 10.Lobanova Griffith O, Gruhn NE, Anthony JE, Purushothaman B, Lichtenberger DL. The Journal of Physical Chemistry C. 2008;112:20518–20524. [Google Scholar]
- 11.Graff JN, McElhaney AE, Basu P, Gruhn NE, Chang CJ, Enemark JH. Inorg. Chem. 2002;41:2642–2647. doi: 10.1021/ic0110981. [DOI] [PubMed] [Google Scholar]
- 12.Chang CSJ, Rai-Chaudhuri A, Lichtenberger DL, Enemark JH. Polyhedron. 1990;9:1965–1973. [Google Scholar]
- 13.When estimating the adiabatic ionization energy from the onset of ionization intensity, account should also be taken for the possibility of appreciable hot bands on the low ionization energy side of the band from thermal population of higher-quanta vibrational states in the neutral molecule. This estimate of the adiabatic ionization energy also presumes that the vibrational manifold of the neutral molecule maps sufficiently to the optimum geometry of the cation such that the adiabatic ionization is observed on the fast (vertical) time scale of photoelectron spectroscopy. Otherwise the onset of ionization intensity is an upper bound to the true adiabatic ionization energy.
- 14.Chang CSJ, Collison D, Mabbs FE, Enemark JH. Inorg. Chem. 1990;29:2261–2267. [Google Scholar]
- 15.Felton GAN, Vannucci AK, Chen J, Lockett LT, Okumura N, Petro BJ, Zakai UI, Evans DH, Glass RS, Lichtenberger DL. J. Am. Chem. Soc. 2007;129:12521–12530. doi: 10.1021/ja073886g. [DOI] [PubMed] [Google Scholar]
- 16.Guerra CF, Snijders JG, Te Velde G, Baerends EJ. Theor. Chem. Acc. 1998;99:391–403. [Google Scholar]
- 17.Te Velde G, Bickelhaupt FM, Baerends EJ, Fonseca Guerra C, Van Gisbergen SJA, Snijders JG, Ziegler T. J. Comput. Chem. 2001;22:931–967. [Google Scholar]
- 18.ADF2006.01d, SCM, Theoretical Chemistry. Amsterdam, The Netherlands: Vrije Universiteit; 2006. http://www.scm.com. [Google Scholar]
- 19.Stoll H, Pavlidou CME, Preuss H. Theor. Chim. Acta. 1978;49:143–149. [Google Scholar]
- 20.Handy NC, Cohen AJ. Mol. Phys. 2001;99:403–412. [Google Scholar]
- 21.van Lenthe E, Ehlers A, Baerends E. J. Chem. Phys. 1999;110:8943–8953. [Google Scholar]
- 22.Portmann S, Luthi HP. Chimia. 2000;54:766–769. [Google Scholar]
- 23.Klamt A. J. Phys. Chem. 1995;99:2224–2235. [Google Scholar]
- 24.Jensen F. Introduction to Computational Chemistry. Chichester, England: Wiley; 2002. [Google Scholar]
- 25.Petro BJ, Vannucci AK, Lockett LT, Mebi C, Kottani R, Gruhn NE, Nichol GS, Goodyer PAJ, Evans DH, Glass RS, Lichtenberger DL. J. Mol. Struct. 2008;890:281–288. [Google Scholar]
- 26.Green JC, Jackson SE, Higginson B. J. Chem. Soc. Dalton Trans. 1975:403–409. [Google Scholar]
- 27.Lichtenberger DL, Fan H, Gruhn NE. J. Organomet. Chem. 2003;666:75–85. [Google Scholar]
- 28.Petersen JL, Lichtenberger DL, Fenske RF, Dahl LF. J. Am. Chem. Soc. 1975;97:6433–6441. [Google Scholar]
- 29.Matsumura-Inoue T, Kuroda K, Umezawa Y, Achiba Y. J. Chem. Soc. Faraday Trans. 2. 1989;85:857–866. [Google Scholar]
- 30.Neikam WC, Dimeler GR, Desmond MM. J. Electrochem. Soc. 1964;111:1190–1192. [Google Scholar]
- 31.Parker VD. J. Am. Chem. Soc. 1976;98:98–103. [Google Scholar]
- 32.Felton GAN, Vannucci AK, Okumura N, Lockett LT, Evans DH, Glass RS, Lichtenberger DL. Organometallics. 2008;27:4671–4679. [Google Scholar]
Associated Data
This section collects any data citations, data availability statements, or supplementary materials included in this article.


