

Abstract
Hyperpolarization-activated cyclic nucleotide-gated cation (HCN) channels are the molecular substrate of the hyperpolarization-activated inward current (Ih). Because the developmental profile of HCN channels in the thalamus is not well understood, we combined electrophysiological, molecular, immunohistochemical, EEG recordings in vivo, and computer modeling techniques to examine HCN gene expression and Ih properties in rat thalamocortical relay (TC) neurons in the dorsal part of the lateral geniculate nucleus and the functional consequence of this maturation. Recordings of TC neurons revealed an approximate sixfold increase in Ih density between postnatal day 3 (P3) and P106, which was accompanied by significantly altered current kinetics, cAMP sensitivity, and steady-state activation properties. Quantification on tissue levels revealed a significant developmental decrease in cAMP. Consequently the block of basal adenylyl cyclase activity was accompanied by a hyperpolarizing shift of the Ih activation curve in young but not adult rats. Quantitative analyses of HCN channel isoforms revealed a steady increase of mRNA and protein expression levels of HCN1, HCN2, and HCN4 with reduced relative abundance of HCN4. Computer modeling in a simplified thalamic network indicated that the occurrence of rhythmic delta activity, which was present in the EEG at P12, differentially depended on Ih conductance and modulation by cAMP at different developmental states. These data indicate that the developmental increase in Ih density results from increased expression of three HCN channel isoforms and that isoform composition and intracellular cAMP levels interact in determining Ih properties to enable progressive maturation of rhythmic slow-wave sleep activity patterns.
Introduction
As sleep approaches in adult mammals, the low-voltage, fast-frequency EEG pattern of alert wakefulness begins to slow down until slow-wave sleep, characterized by the increasing presence of spindle waves and high-amplitude, slow delta waves, occurs (Sinton and McCarley, 2004; Staunton, 2005). The thalamocortical system is the neuronal substrate of rhythmic synchronized activity during slow-wave sleep. During this state, thalamocortical relay (TC) neurons display intrinsic pacemaker activity, leading to the rhythmic generation of bursts of action potentials, which are synchronized throughout the thalamocortical network (Steriade et al., 1997). This pace-making property is based on Ih, which is gated by membrane voltage as well as cAMP (Pape, 1996). The regulation of the voltage dependence of Ih through cAMP is considered an important mechanism for the control of rhythmic burst firing during the sleep-wake cycle.
Four members of a gene family encoding mammalian HCN channels (HCN1–HCN4) give rise to Ih (Kaupp and Seifert, 2001; Robinson and Siegelbaum, 2003; Santoro and Baram, 2003). Four subunits are thought to assemble to form functional channels, and cAMP acts directly on the C-terminal intracellular domain to rapidly regulate channel opening (Wainger et al., 2001; Robinson and Siegelbaum, 2003). The expression pattern of HCN isoforms in the mammalian brain varies with age, region, and species (Moosmang et al., 1999; Monteggia et al., 2000; Bender and Baram, 2008), and the electrophysiological properties of functional HCN channels seem to critically depend on homomeric or heteromeric formation of channel subunits (Much et al., 2003; Brewster et al., 2005; Chen et al., 2005).
Recent evidence suggests that altered Ih properties and HCN channel expression plays a critical role during epileptic seizures in different brain regions (Bender et al., 2003). In the thalamocortical system, two genetic rat models of absence epilepsy revealed that abnormal regulation of Ih accompanies the pathogenesis in that there is a reduction in responsiveness to cAMP associated with a selective increase in the expression of the relatively cAMP-insensitive HCN1 isoform in TC neurons (Budde et al., 2005; Kuisle et al., 2006).
The developmental maturation of HCN channels in the thalamus is not well understood. In general, these developmental changes influence Ih conductance, either by governing the levels of expression of different HCN isoforms or via regulation of cAMP levels (Surges et al., 2006). In rat thalamus, HCN expression patterns are established at early postnatal stages in a nucleus-specific manner, with HCN2 and HCN4 being most robustly expressed in relay nuclei (Bender et al., 2001; Ludwig et al., 2003). However, a comprehensive quantitative study of mRNA and protein expression of the HCN channels in the thalamus, and, importantly, of the consequences of this developmental profile on the properties and magnitude of Ih and the resulting modulation of thalamocortical sleep patterns has not been reported. Therefore, we combined in vitro and in vivo electrophysiological, immunological, molecular biological, and computational modeling techniques to correlate Ih current density, voltage dependence, and kinetics with the HCN expression pattern and the generation of rhythmic activity in single TC neurons as well as thalamic networks.
Materials and Methods
Preparation.
All animal preparations were done according to the European Communities Council Directive of November 24, 1986 (86/609/EEC). Rats [the Sprague Dawley strain was used for all experiments presented here; postnatal day 3 (P3) to P106] were anesthetized with isoflurane and decapitated. In rapid sequence, after surgically removing a scull cap caudal to the bregma, a block of brain tissue containing the thalamus was removed from the cranial vault and submerged in ice-cold aerated (O2) saline containing the following (in mm): 200 sucrose, 20 PIPES, 2.5 KCl, 1.25 NaH2PO4, 10 MgSO4, 0.5 CaCl2, and 10 dextrose, pH 7.35, with NaOH. Thalamic slices were prepared as coronal sections on a vibratome. Before recording, slices were kept submerged in artificial CSF containing the following (in mm): 125 NaCl, 2.5 KCl, 1.25 NaH2PO4, 24 NaHCO3, 2 MgSO4, 2 CaCl2, and 10 dextrose, pH adjusted to 7.35 by bubbling with carbogen (95% O2 and 5% CO2).
Whole-cell patch clamp.
Recordings were performed on TC neurons of the dorsal part of the lateral geniculate nucleus (dLGN) at room temperature in a solution containing the following (in mm): 120 NaCl, 2.5 KCl, 1.25 NaH2PO4, 30 HEPES, 2 MgSO4, 2 CaCl2, and 10 dextrose, pH 7.25 adjusted with HCl. Individual cells were visually identified by infrared differential interference contrast video microscopy. Membrane currents were measured with glass microelectrodes pulled from borosilicate glass capillaries (GC150T-10; Clark Electromedical Instruments) and filled with the following (in mm): 95 K-gluconate, 20 K3-citrate, 10 NaCl, 10 HEPES, 1 MgCl2, 0.5 CaCl2, 3 BAPTA, 3 Mg-ATP, and 0.5 Na-GTP. The internal solution was set to a pH of 7.25 with KOH and an osmolality of 295 mOsm/kg. The electrodes were connected to an EPC-10 amplifier (HEKA) with a chlorided silver wire. Electrode resistances were in the range of 2–3 MΩ, with access resistances in the range of 5–20 MΩ. Series resistance compensation of >30% was routinely applied. Voltage-clamp experiments were controlled by the software Pulse or PatchMaster (HEKA) operating on an IBM-compatible personal computer. Measurements were corrected for liquid junction potential. All results are presented as mean ± SEM. Substance effects were tested for statistical significance using the nonparametric Mann–Whitney test (Prism software; GraphPad Software). When applicable, the parametric t test was used (Origin software). Differences were considered statistically significant if p < 0.05.
The protocol used to assess Ih was designed to increase the stability of whole-cell recordings and account for increasingly fast activation kinetics of Ih. Therefore, the pulse length was shortened by 1500 ms with increasing hyperpolarization (3.5 s pulse length at −130 mV). Steady-state activation of Ih, p(V), was estimated by normalizing the tail current amplitudes (I) 50 ms after stepping to a constant potential of −100 mV (see Fig. 1A, arrow) from a variable amplitude step using the following equation:
 |
with Imax being the tail current amplitude for the voltage step from −130 to −100 mV and Imin for the voltage step from −40 to −100 mV, respectively. Ih activation was well accounted for by a Boltzmann equation of the following form:
 |
where Vh is the voltage of half-maximal activation, and k is the slope factor.
Figure 1.

Postnatal development of Ih properties in TC neurons. A, Representative current traces obtained from cells of different postnatal age. Currents were elicited by applying the shown voltage-clamp protocol from −40 mV (inset). The tail current voltage was −100 mV (see arrow). The duration of each hyperpolarizing step was shortened as command potentials became more negative. Calibration: 3 s, 100 pA. The bracket indicates the amplitude of Ih. B, Mean current density versus postnatal age reveals increasing Ih currents (n = 63; 1–8 per data point). Current densities were calculated by dividing amplitudes at −130 mV by the membrane capacitance obtained during whole-cell recordings. Data from P3 and P106 cells were highly significantly different (**p < 0.01). C, Mean steady-state activation curves for P3 and P106 were obtained by plotting normalized tail current amplitudes against the step potential and fitting them with a Boltzmann function. D, Mean half-maximal activation voltages (Vh) versus postnatal age reveals a hyperpolarizing shift in Vh with age (n = 6–17 per data point). Significantly different results were obtained for some combinations of postnatal ages (see Results) (*p < 0.05).
The amplitude of Ih (see Fig. 1A, bracket) was calculated by subtracting the instantaneous current amplitude Ii from the steady-state current (ISS). The density of Ih was calculated by dividing the Ih current amplitude at −130 mV by the membrane capacitance obtained during whole-cell recordings.
The time course of Ih activation in TC neurons was best approximated by the following single-exponential equation:
 |
where Ih (t) is the current amplitude at time t, and A0, A1, and τ are axis intercept, amplitude coefficient, and time constant, respectively. In ∼10% of the cells recorded under different conditions, the time course of activation was best fitted by a biexponential function. These cells were not included for analysis of activation kinetics.
In vivo electrophysiology.
Rats aged P6, P11, P13, P17, and P89 were bilaterally implanted with two cortical electrodes (Plastics One) positioned over the frontoparietal cortex. A ground electrode was placed in the cerebellum, and the assembly was anchored with dental cement and four stainless steel screws. Digital video EEG recordings were performed on the following day in freely moving, non-anesthetized rats, with concurrent video monitoring (Camcorder, ZR40; Canon). Electrophysiological data were recorded at a frequency band of 0.1–200 Hz, sampled at 400 Hz/channel using Powerlab 8SP (AD Instruments) equipped with Chart 4 for Windows. The data were filtered (0.1–30 Hz) for analysis and synchronized with the video monitoring.
Computer simulations.
All simulations were processed within the NEURON Simulation Environment at a temperature of 36°C (Hines and Carnevale, 2001; Meuth et al., 2005). Given the four-cell neuronal network model (see Fig. 7B) (supplemental Table S1, available at www.jneurosci.org as supplemental material) published by Destexhe et al. (1996), the corresponding TC cell template was used to investigate the impact of Ih on the two typical firing modes of a single TC neuron (burst and tonic activity) (see Fig. 5A). The Ih current kinetic and voltage dependency (supplemental Fig. S1, available at www.jneurosci.org as supplemental material) of this template originates from a previously McCormick and Huguenard implementation (McCormick and Huguenard, 1992) and has been expanded with Ca2+ dependence by Destexhe et al. (1996). To reach a stable membrane resting potential of −60 mV, the default parameter setting was adapted as follows:
 |
Evaluation of the Ih driven voltage sag (see Fig. 5B) was accomplished by successively decreasing the maximum Ih conductance in 10% steps from 100 to 0%. Thereby the strength of the applied hyperpolarizing pulse was continuously lowered to compensate the increased membrane resistance and to ensure a constant step potential of −130 mV. All other model parameters remained unchanged during the simulations. In each step, the voltage sag was calculated by subtracting the initial (global minimum) (see Fig. 5B, inset) from the final (right at the end of the hyperpolarizing stimulus) (see Fig. 5B, inset) membrane voltage.
Figure 7.

Network modeling. A, Results in both TC and RE neurons were identical. Therefore, only TC1 (top) and RE1 (middle) are shown. Oscillations disappear while reducing Ih. Given 100% Ih (black traces), the network shows oscillations at 5.6 Hz. By simultaneously reducing the maximum Ih conductance of both TC cells to 80% (gray traces), the oscillations are decelerated to 5.3 Hz and finally disappear if the Ih level is set to 50% (dashed traces). With Ih levels set to 40% (bottom), a 15 mV depolarizing shift in the activation curve resulted in resuming of oscillatory activity. B, The network topology as well as the connection parameters corresponds to Destexhe et al. (1996). RE neurons reciprocally communicate via GABAA-mediated connections and project to both TC neurons via GABAA and GABAB. The feedback from TC cells is carried by AMPA receptors in both RE cells. C, Interburst frequency. Stepwise reducing the maximum Ih conductance in both TC cells of the network continuously slowed down the oscillations and finally erased all suprathreshold activity in case the Ih level falls to 50%. The interburst frequency was calculated with regard to the tip of the first action potentials of two consecutive bursts. All calculations were based on the traces of TC1 and considered the last seven bursts in each simulation for determining the plotted mean frequency. The arrow indicates the interburst frequency with 40% Ih and a 15 mV shift in the activation curve.
Figure 5.

Single-cell modeling. A, Reducing Ih affects burst behavior. Although there is no significant difference in the tonic action potential generation, reducing the maximum Ih conductance from 100% (left) to 20% (right) affects the response of the model to hyperpolarization. The applied stimulus protocol is given in the inset. B, Incrementing the maximum Ih conductance of the single-cell TC neuron model in 10% steps from 0 to 100% led to a linearly growing voltage sag. The voltage sag was determined by subtracting the initial (global minimum) from the final (right at the end of the stimulus) membrane voltage (see inset).
A second set of simulations is based on the simplified neuronal network (Destexhe et al., 1996) given in Figure 7B. To have two autonomous oscillators, parameters in both TC cells (in variation from the original model by Destexhe) were set to the following:
 |
Additionally, the duration of all simulations was extended to 20 s so that the networks could reach a steady state. Part 1 of the simulations (see Fig. 7A, top and middle) comprises altogether 11 separate runs, in which the maximum Ih conductance of both TC cells was successively decremented by 10%. Based on the traces of the first TC cell (TC1), the interburst intervals of the last seven bursts were considered and finally averaged per run (see Fig. 7C, gray bars). Calculating the interburst interval of two consecutive bursts was done with regard to the tip of the first action potential in each case. In part 2 (see Fig. 7A, bottom), the Ih activation curve was shifted by 15 mV to more depolarized values. This shift applied to both TC cells. The mean interburst interval was evaluated as mentioned previously (see Fig. 7C, white bar).
Drugs.
During experiments with 8-bromo-cAMP (water soluble; Sigma) added to the recording pipette, properties of Ih were determined 8–15 min after obtaining the whole-cell configuration. The adenylyl cyclase inhibitor 9-(tetrahydro-2-furanyl)-9Hpurin-6-amine (SQ22.536) was obtained from Sigma and prepared as stock solution in water. Before recording, slices were incubated for 2 h in extracellular solution containing 300 μm SQ22.536 and were transferred to the recording chamber thereafter. The blocker was not present in the recording solution. Properties of Ih were determined 8 min after obtaining the whole-cell configuration.
Determination of cAMP level in tissue samples.
Samples of the dLGN were prepared from freshly dissected coronal sections and put immediately into 300 μl of ice-cold buffer containing 50 mm HEPES, pH 7.6, 1 mm EDTA, 25 mm sucrose, complete protease inhibitor cocktail (Roche), and 50 μm IBMX (3-isobutyl-1-methylxanthine). Protein samples were centrifuged at 2500 × g for 10 min at 4°C, and pellets were discarded. From these homogenates, 50 μl aliquots were used to determine the cAMP content. Values of cAMP per milligram total protein were determined in triplicate using the TRK432 cAMP assay kit (GE Healthcare).
Immunohistochemistry.
Rats of different ages (P10 and P70) were deeply anesthetized with sodium pentobarbital (100 mg/kg, i.p.) and transcardially perfused with 4% phosphate-buffered paraformaldehyde (PFA). Brains were removed, postfixed for 4 h in 4% PFA, cryoprotected in 25% sucrose for 48–72 h, and frozen in isopentane. Coronal sections (40 μm) through the thalamus were cut on a cryostat and collected in PBS. Sections were treated for 30 min with 0.3% H2O2/PBS, then washed three times for 10 min in PBS, preincubated for 1 h in 10% normal goat serum/PBS, and finally incubated with primary antisera in PBS plus 0.3% Triton X-100 for 48 h at 4°C. Polyclonal guinea pig anti-HCN1 (1:500), HCN2 (1:1500), or HCN4 (1:800) antisera were used for these studies (kind gifts from Dr. Ryuichi Shigemoto, Okazaki, Japan). After primary antibody incubation and several washes, sections were transferred to secondary antibody solution (biotinylated goat anti-guinea pig IgGs, 1:250; Vector Laboratories) for 3 h, followed by additional washes and avidin–biotin–peroxidase complex solution (Vector Laboratories) for 2 h at room temperature. Antibody binding was visualized by incubating sections in a solution containing 0.04% 3,3′ diaminobenzidine, 0.001% H2O2, 0.01% NiCl2, and 0.01% CoCl2. For negative controls, occlusion of the primary antibody from the staining procedure was routinely performed with no positive immunological signal detected.
Western blotting.
Rats of different ages (P7, P30, and P90) were rapidly decapitated, and dLGNs were quickly dissected and frozen immediately in liquid nitrogen. Tissue was then homogenized in ice-cold buffer containing 50 mm HEPES, pH 7.6, 1 mm EDTA, and 25 mm sucrose. Protease inhibitor cocktail (Roche) was added according to the guidelines of the manufacturer. Protein samples were centrifuged at 2500 × g for 10 min at 4°C, and pellets were discarded. The resulting supernatants were separated by 12% SDS-PAGE. Proteins were transferred in 25 mm Tris, 192 mm glycin, 0.1% SDS, and 20% methanol onto Hybond ECL nitrocellulose membranes at 20 V overnight at 4°C. Thereafter, membranes were blocked with 5% nonfat milk in TBS–0.1% Tween 20 for 1 h and incubated with primary antibodies for 2 h at room temperature. The following antibodies were used: rabbit anti-HCN1, rabbit anti-HCN2, rabbit anti-HCN4 (1:300 for each antibody; Alomone Labs) and monoclonal mouse anti-β-actin (1:4000; Abcam). After washing (three times for 10 min in TBS–0.1% Tween 20), blots were subsequently incubated with horseradish peroxidase-conjugated goat anti-rabbit or anti-mouse antibodies (1:2000 for each antibody; Dako) for 1 h at room temperature. Washing was performed as before, and blots were developed using an ECL Plus detection kit (GE Healthcare) according to the guidelines of the manufacturer.
Quantitation of HCN expression was achieved by densitometric analysis of corresponding protein bands (Quantity One 4.2.2 software, ChemiDoc; Bio-Rad). Protein content was normalized using β-actin as an internal and loading standard.
In situ hybridization.
For in situ hybridization (ISH), rats were quickly decapitated on P2, P11, or P60 (three to six rats per group), and brains were dissected and placed on powdered dry ice. Coronal sections (20 μm) through the thalamus were cut, mounted on gel-coated slides, and fixed in 4% PFA. After a graded ethanol treatment, sections were exposed to acetic anhydride-triethanolamine and then dehydrated through 70–100% ethanol. Sections were preincubated in hybridization solution [50% formamide, 5× sodium–EDTA–Tris (5× SET: 750 mm NaCl, 12.5 mm EDTA, and 150 mm Tris, pH 8), 0.2% SDS, 5× Denhardt's solution, 0.5 mg/ml salmon sperm-sheared DNA, 250 mg/ml yeast tRNA, 100 mm dithiothreitol, and 10% dextran sulfate] and probed overnight at 55°C with antisense [35S]cytidine triphosphate-radiolabeled HCN cRNA probes (0.5–1 × 10⁶ cpm/30 μl/section). These probes were synthesized by in vitro transcription from cDNAs containing specific gene regions of mouse HCN1, HCN2, and HCN4 channels as described previously (Bender et al., 2001; Brewster et al., 2002). The specific activity of the probes was 1.67–5.2 × 10⁹ cpm/μg. On the following day, sections were washed in decreasing concentrations of SSC solutions, with the most stringent wash at 0.03× SSC for 60 min at 62°C. After dehydration in increasing alcohol concentrations, sections were apposed against Kodak Biomax films. Specificity of signal was verified by hybridizing sections with sense probe or with excess unlabeled (100-fold) antisense probe in addition to labeled probe. Quantification and statistical analyses of the HCN mRNA signals were accomplished by measuring optical density of incorporated radioactivity in dLGN using the image analysis program ImageTool (version 1.27; University of Texas Health Science Center, San Antonio, TX). Optical density measured over the corpus callosum was used as a background signal and subtracted from the signal measured in dLGN. Linearity of the hybridization signal was ascertained using 14C standards (American Radiolabeled Chemicals).
Results
Basic properties of Ih in developing TC neurons
Data from 219 visually and electrophysiologically identified TC neurons of the dLGN were included for analysis. Ih was activated in the presence of Ba2+ (1 mm) from a holding potential of −40 mV by using hyperpolarizing voltage steps of increasing (ΔV = −10 mV) amplitude and decreasing (Δt = −1500 ms) duration, followed by a constant step to −100 mV (Fig. 1A; the inset shows a scheme of the voltage protocol). The density of Ih at −130 mV strongly increased as a function of postnatal age from 1.1 ± 0.1 pA/pF (n = 6) at P3 to 5.2 ± 0.4 pA/pF (n = 7) at P106 (p < 0.001) (Fig. 1B), thereby representing a 5.5-fold increase over the observed period of development. An analysis of the deactivating currents revealed a half-maximal value of Ih activation (Vh) at a membrane potential of −85.2 ± 1.5 mV (n = 6) at P3, which was not significantly (p > 0.063) different from Vh at the other developmental stages (P7, −85.5 ± 0.9 mV, n = 9; P11, −86.7 ± 1.0 mV, n = 10; P18, −88.5 ± 0.8 mV, n = 14; P30, −89.1 ± 1.0, n = 17; P60, −87.7 ± 0.6 mV, n = 16; P106, −88.8 ± 1.0 mV, n = 7) (Fig. 1C,D). Nevertheless, there was a tendency to more hyperpolarized activation curves in older animals (Fig. 1D) because comparisons between some datasets revealed significant differences (P7/P18, P7/P30, and P7/P106; p < 0.04).
Because the relative contribution of different HCN isoforms to the properties of Ih is also evident in the time course of Ih activation, we analyzed activation time constants as a function of age. Time constants of activation at a potential of −130 mV increased during development (P3, τ = 435 ± 32, n = 6; P7, 432 ± 43 ms, n = 9; P11, 483 ± 25 ms, n = 10; P18, 530 ± 35 ms, n = 12; P30, 692 ± 35 ms, n = 12; P60, 576 ± 44 ms, n = 9; P106, 598 ± 52 ms, n = 7) with the earliest ages (P3 and P7) being significantly (p < 0.03) different from P30 and P106 (data not shown).
Strong modulation by intracellular cAMP is a hallmark of Ih in TC neurons and also reflects the relative contribution of the different HCN isoform expression (Pape, 1996; Budde et al., 2005). To examine the cAMP gating of this conductance throughout the age range studied here, we recorded Ih while the pipette solution contained different concentrations (0.1, 1, and 10 μm) of 8-bromo-cAMP (Fig. 2A). Inclusion of 8-bromo-cAMP induced a significant (p < 0.001) concentration-dependent shift of Ih activation curves at all developmental stages. Compared with cells from P10 (0.1 μm, Vh = −77.9 ± 0.8, n = 10; 1 μm, Vh = −73.8 ± 0.5, n = 23; 10 μm, Vh = −70.2 ± 1.8, n = 7), Vh values in P30 (0.1 μm, Vh = −80.5 ± 0.8, n = 8; 1 μm, Vh = −77.7 ± 0.5, n = 8; 10 μm, Vh = −76.1 ± 0.7, n = 7) and P70 (0.1 μm, Vh = −80.4 ± 0.9, n = 5; 1 μm, Vh = −76.9 ± 0.9, n = 14; 10 μm, Vh = −75.4 ± 0.9, n = 5) rats were significantly (p < 0.004) more hyperpolarized (Fig. 2B). In addition to altering Vh, cAMP significantly (p < 0.02) accelerated Ih activation kinetics at −130 mV at all concentrations for P10 and P30 rats (data not shown). For P70 rats only, 1 and 10 μm induced a significant (p < 0.05) acceleration. When different age groups were compared, activation time constants at −130 mV in P10 cells (0.1 μm, τ = 402 ± 14 ms, n = 10; 1 μm, τ = 300 ± 20 ms, n = 10; 10 μm, τ = 299 ± 20 ms, n = 7) were significantly faster than in cells from P30 (0.1 μm, τ = 531 ± 17 ms, n = 8; 1 μm, τ = 475 ± 11 ms, n = 8; 10 μm, τ = 470 ± 13 ms, n = 8) and P70 (0.1 μm, τ = 491 ± 36 ms, n = 5; 1 μm, τ = 471 ± 18 ms, n = 12; 10 μm, τ = 435 ± 19 ms, n = 5) animals.
Figure 2.
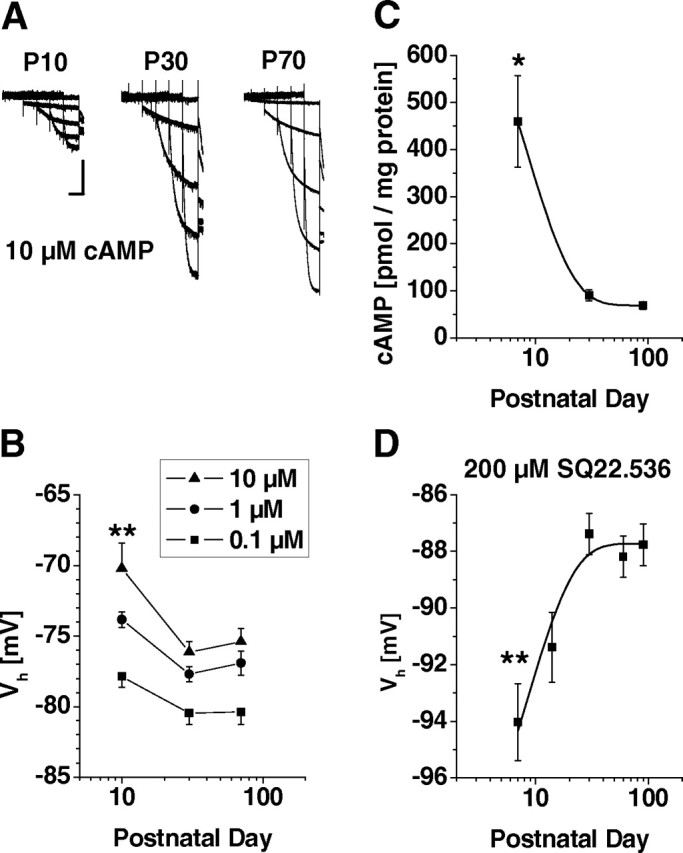
Modulation of Ih by cAMP. A, Representative current traces obtained from cells in the presence of 10 μm intracellular cAMP at P10, P30, and P70. Voltage protocols as in Figure 1. Calibration: 3 s, 200 pA. B, Mean Vh values of steady-state activation curves at different postnatal ages (P10, P30, and P70) in the presence of 0.1 μm (filled squares), 1 μm (filled circles), and 10 μm (filled triangles) of intracellular cAMP were obtained from independent populations of cells. Data from P7 and P70 cells were highly significantly different (**p < 0.01). C, Results obtained from a radioactive competition assay revealed a significant decrease in cAMP content with age (*p < 0.05). D, Mean Vh values of steady-state activation curves at different postnatal ages (P7, P14, P30, P60, and P90) after preincubation of brain slices in SQ22.536 (200 μm, 2 h). Results indicated a highly significant hyperpolarization at P7 compared with age-matched controls (**p < 0.01).
Next we assessed the possible influence of basal cAMP production on Ih properties. Quantification of cAMP concentration in dLGN tissue revealed a significant (p < 0.02) decline with age ranging from 459 ± 97 pmol/mg at P7 to 91 ± 11 pmol/mg at P30 and remained at the lower level thereafter (P90, 69 ± 8 pmol/mg, n = 3) (Fig. 2C). To test whether this change has an impact on Ih properties, thalamic slices were incubated with the adenylyl cyclase inhibitor SQ22.536 (300 μm, 2 h) before current recordings (Fig. 2D). Inhibition of adenylyl cyclase activity resulted in significant (p < 0.0002) hyperpolarization of Ih activation curves at P7 (Vh = −94.0 ± 1.4 mV, n = 10) but had very little effect in older animals (P30, Vh = −87.4 ± 0.7 mV, n = 9; P60, Vh = −88.2 ± 0.7 mV, n = 12; P90, Vh = −87.8 ± 0.7 mV, n = 13). This effect was accompanied by a significant (p < 0.002) slowing of activation time constants at −130 mV in young (P7, τ = 714 ± 59 ms, n = 10) but not in old (P30, τ = 614 ± 36 ms, n = 9; P60, τ = 609 ± 21 ms, n = 11; P90, τ = 554 ± 14 ms, n = 13) animals (data not shown).
Expression of HCN channel mRNA and proteins in dLGN
By analyzing the molecular basis of Ih throughout the developmental range, we found that three of the four known members of the HCN channel gene family were significantly expressed in the dLGN throughout postnatal development (Fig. 3). Quantitative radioactive analyses of mRNAs indicated a progressive and significant increase of all isoforms as a function of age (increase from P2 to P60; HCN1, 2.0-fold, p = 0.0002; HCN2, 1.4-fold, p = 0.002; HCN4, 1.5-fold, p = 0.0032) (Fig. 3A).
Figure 3.

Quantitative analyses of postnatal mRNA and protein expression of HCN channels. A, HCN1, HCN2, and HCN4 mRNA levels in dLGN were obtained using radioactively labeled in situ hybridization probes (n = 3–6 per group). Significance is indicated for the comparison of P2 and P60 (**p < 0.01). B, HCN1, HCN2, and HCN4 protein levels in dLGN were evaluated using Western blot procedures with β-actin as reference (n = 9 per group). Significance is indicated for the comparison of P7 and P90 (**p < 0.01). C, Relationship between Ih current density and radioactive ISH signals. Values of radioactivity were summed for P2, P11, and P60 and plotted versus age-matched current density values from the fit in Figure 1B. D, Relationship between Ih current density and normalized Western blot signals. Values of HCN/β-actin ratios were summed for P7, P30, and P90 and plotted versus age-matched current density values from the fit in Figure 1B.
Protein expression of HCN channel isoforms was approximately concordant with the mRNA results in that the protein expression of HCN1 and HCN2 significantly (p < 0.004) increased from P7 to P90. Protein levels of HCN4 were not significantly changed over the analyzed time period, and the discrepancy between the mRNA and protein levels might be a result of the variability among available antisera against this subunit (Brewster et al., 2007; Shin and Chetkovich, 2007). The increase revealed by semiquantitative Western blotting was 7.6-fold (p > 0.004), 12.4-fold (p < 0.0001), and 1.3-fold (p > 0.08) (Fig. 3B) for HCN1, HCN2, and HCN4, respectively. Whereas the ratio of HCN2/HCN1 protein expression remained approximately constant during postnatal development (30 ± 3, n = 3), the ratios of HCN2/HCN4 and HCN1/HCN4 increased approximately eightfold and sixfold between P7 and P90, respectively. To localize the protein expression of HCN channel isoforms in dLGN, immunohistochemical staining was performed. The results indicated that HCN1 (Fig. 4A), HCN2 (Fig. 4B), and HCN4 (Fig. 4C) were present in this, as well as other thalamic nuclei, with an apparent increase of signal intensity between P10 and P70.
Figure 4.
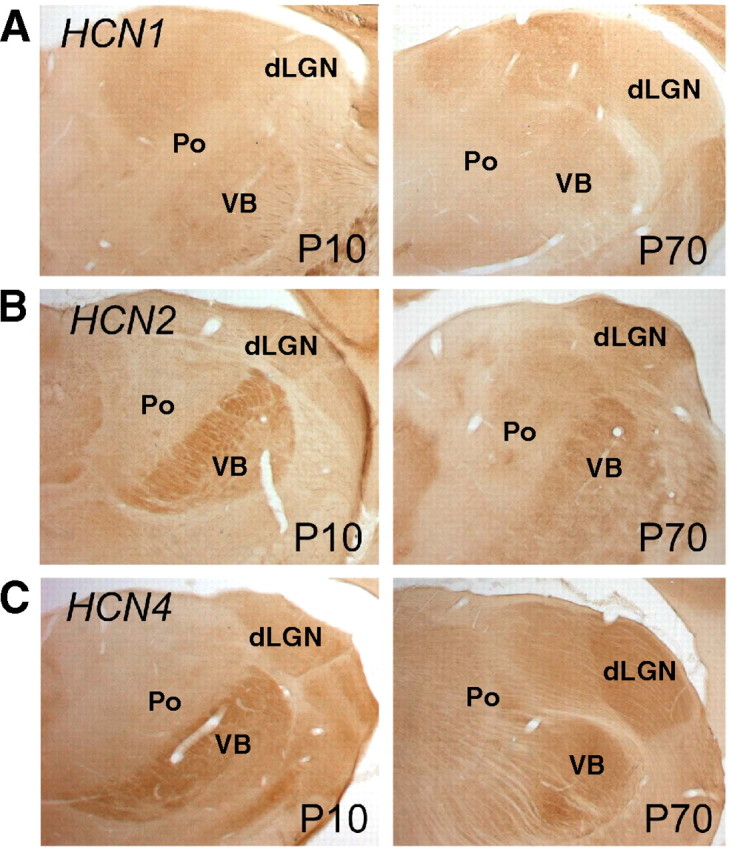
Immunohistochemical characterization of HCN channel localization. Specific antibodies directed against HCN1 (A), HCN2 (B), and HCN4 (C) were applied. All isoforms were detected in the dLGN and immunoreactivity was stronger in adult (P70) compared with P10 animals, which is consistent with the results of the mRNA and protein analysis (see Fig. 3). In both P10 and P70 dLGN, HCN1 immunoreactivity was considerably weaker than the corresponding immunosignal of the HCN2 and HCN4 isoforms. This may reflect the generally lower expression levels of HCN1 compared with these isoforms (see Fig. 3). Po, Posterior thalamic nuclear group; VB, ventrobasal thalamic complex.
How does HCN isoform expression during development govern Ih properties?
To correlate HCN expression levels and membrane current for matching postnatal ages, Ih current density (extrapolated from the fit in Fig. 1B) was plotted against the sum of the detected radioactivity (determined by ISH for P2, P11, and P60) (Fig. 3A) and the HCN/β-actin ratio (determined by Western blotting for P7, P30, and P90) (Fig. 3B) of all three isoforms. This yielded a linear relationship for both current density and summed mRNA levels (r2 = 0.999) (Fig. 3C) as well as for current density and summed protein levels (r2 = 0.994) (Fig. 3D).
Functional consequences of increased HCN isoform expression
One hallmark of Ih current activation during current-clamp recordings is the depolarizing voltage sag generated during the course of hyperpolarizing current steps (Pape, 1996). Furthermore, TC neurons can act as intrinsic oscillators in the delta frequency range (0.5–4 Hz) during slow-wave sleep (when oscillations are in the same delta frequency) based on the cyclic interaction between Ih and the transient low-threshold Ca2+ current (IT) (Pape, 1996; Lüthi and McCormick, 1998; Cueni et al., 2009). Whereas Ih acts as a pacemaker, IT is responsible for the generation of low-threshold Ca2+ spikes (LTS) underlying bursts of action potentials (supplemental Fig. S2, available at www.jneurosci.org as supplemental material). Because multiple ion channels mature during early postnatal development, it is difficult to isolate the influence of changed compound HCN channel expression on TC neuron firing patterns using experimental approaches. Therefore, we used in vivo EEG recordings (see Fig. 6) and computer modeling to assess the effect of changed Ih density on burst and tonic firing in a single-cell model (see Fig. 5) as well as on rhythmic slow-wave sleep activity in a reduced thalamic network model (see Fig. 7).
Figure 6.

In vivo cortical EEGs demonstrating the development of slow-wave sleep patterns with age. At each age, traces from the wake state (assessed via concurrent video monitoring) are on the left, whereas sleep traces are on the right. Traces obtained on P7 (A), P12 (B), P14 (C), P18 (D), and P90 (E) are shown. A, There was little distinction between the frequency distribution of EEG rhythms in the wake and the sleep state at P7. B, By P12, initial irregular slow-wave oscillations (2–4 Hz) were apparent in NREM sleep recordings, readily distinguishable from the wake record. C–E, Similar, maturing sleep patterns were found in EEG at older ages (C, D), leading to the well developed delta frequency (1–2 Hz) NREM sleep waves in the adult (E). Calibration: 1 s, 50 μV (P7), 0.1 mV (P12 and P14), 0.5 mV (P18), and 1 mV (P90).
The single TC neuron model was set to rest at a potential of −60 mV, and time-dependent, anomalous rectification was analyzed by applying hyperpolarizing pulses in current-clamp mode. A maximum Ih conductance of 10 μS/cm2 was considered the adult situation. When applied to the model cell (surface area ≈29,000 μm2), a hyperpolarization to −130 mV led to a voltage sag of 11.5 mV. In this case, the “adult” TC neuron (Fig. 5A, left) showed a prominent slow time-dependent rectification during hyperpolarization and a burst of action potentials superimposed on an LTS after release from hyperpolarization. This rectification was almost gone when reducing the Ih conductance to 20%, levels found during the very early postnatal period (Fig. 5A, right). Although the deactivating component of Ih generates a depolarizing afterpotential after release from hyperpolarization, amplitude and duration of the LTS are dominated by IT (supplemental Fig. S2, available at www.jneurosci.org as supplemental material). Therefore, a full LTS was generated even in the absence of Ih (Fig. 5A, right). In contrast, tonic firing evoked by depolarizing current steps was not significantly affected by the reduction of Ih. A systematic decrease (10% steps) of the maximum Ih conductance from 100 to 0% was answered by the computer model with linearly decreasing voltage sags (Fig. 5B). Together, anomalous rectification was highly dependent on the maximum Ih conductance.
Next, we examined the role of the developmentally determined, isoform-specific HCN channel expression patterns and the resulting alteration in cAMP modulation in the maturation of sleep patterns. We recorded in vivo cortical EEGs from rats at five developmental ages, P7, P12, P14, P18, and P90. As shown in Figure 6A, there was little distinction between the frequency distribution of EEG rhythms in the wake and the sleep state at P7. In contrast, slow-wave oscillations, in the delta frequency range, were sporadically detectable at P12 (Fig. 6B) and P14 (Fig. 6C) and were readily apparent in non-rapid eye movement (NREM) sleep recordings from rats at P18 (Fig. 6D, right). These were clearly distinguishable from the wake record (Fig. 6B–D, left). A similar, mature sleep pattern was found in adult (P90) cortical EEG recordings, in which well developed delta frequency (1–2 Hz) sleep waves distinguished the NREM sleep state (Fig. 6E).
The contribution of HCN channel maturation to these patterns was evaluated using computer modeling. Spontaneous rhythmic slow-wave sleep activity was analyzed in a model network of four reciprocally connected TC and reticular thalamic (RE) neurons (Destexhe et al., 1996) as depicted in Figure 7B. At a hyperpolarized membrane potential of approximately −80 mV, both TC neurons generated spontaneous burst activity within a frequency range of 4–6 Hz (close to the delta frequency range of 0.5–4 Hz). Regarding the entire network, synchronized activity could be observed in all four neurons with an underlying frequency of 5.6 Hz under control conditions (Fig. 7A; only traces from TC1 and RE1 are shown in the top and middle, respectively). Because of the decreasing depolarizing and thus pace-making influence, a gradual reduction of the maximum Ih conductance applied to both TC neurons in parallel resulted in a decreasing burst frequency down to 4.1 Hz (Fig. 7C). When the maximum Ih conductance was lowered to 50% of the control condition, spontaneous bursting in the pace-making TC neurons and, consequently, the entire network oscillation stopped (Fig. 7A). To investigate the effect of cAMP-dependent modulation of HCN channels on rhythmic activity, the Ih activation curve was shifted by 15 mV in the depolarizing direction. With the Ih conductance lowered to 40% of the control value (situation at approximately P12–P14) spontaneous burst activity resumed when the voltage dependency of Ih was shifted 15 mV in the depolarizing direction (Fig. 7A, bottom). Under these conditions, the underlying frequency was 3.1 Hz (Fig. 7C).
Discussion
The results of the present study can be summarized as follows. (1) Ih current density strongly increases during the first 9 postnatal weeks until it reaches constant adult values. This change in current properties is associated with an overall increased expression of the three major neuronal HCN channel isoforms (HCN1, HCN2, and HCN4). (2) A linear relationship exists between the summed mRNA/protein expression levels of these channels and Ih current density, consistent with the dependence of current density on HCN gene expression. (3) Current kinetics and sensitivity to modulation by cAMP change significantly with age and the voltage dependence of Ih activation has the tendency to more hyperpolarized potentials in older rats. These findings are in agreement with the increase in HCN1/HCN4 and HCN2/HCN4 expression ratios as well as the decrease in cAMP levels in dLGN with age. (4) The dramatic decrease in cAMP content of dLGN tissue with age is accompanied by a significant decrease in the effect of the adenylyl cyclase blocker SQ22.536 on activation properties. Together with the changes in Ih cAMP sensitivity, these finding suggest that the expression of the Ih building blocks, namely the HCN channels and the intracellular cAMP concentration, act in concert to achieve specific current properties in a changing neuronal environment. In this respect, young cells seem to require an extremely high cAMP sensitivity. (5) Computer modeling indicates that the increase in Ih conductance is necessary to sustain the spontaneous delta activity in TC neurons and, consequently, the synchronized slow-wave sleep rhythms in the thalamic network. Moreover, strong modulation of Ih with low (early developmental situation) conductance induces initiation of rhythmic delta activity. (6) In conclusion, a tight regulation of HCN channel expression and the resulting Ih current density takes place in TC neurons of developing dLGN. This, in turn, is likely to partially contribute to the maturation of slow-wave sleep activity in the thalamic network.
Correlation of HCN expression and Ih properties
In the present study, a clear linear correlation was demonstrated between total HCN mRNA levels as well as total HCN protein levels and Ih current density, thereby also pointing to a linear correlation between total mRNA and protein levels. This tight coupling between mRNA, protein and membrane current has also been found previously for HCN channels in the developing rat hippocampus. In that region, a progressive increase in Ih current amplitude correlated with a strong increase in HCN1, a moderate increase in HCN2, and a decrease in HCN4 expression (Vasilyev and Barish, 2002; Surges et al., 2006; Brewster et al., 2007).
To establish a clear correlation between kinetics, voltage dependence, and cAMP sensitivity of Ih and the HCN channel expression profile is more difficult. In general, this relationship is determined primarily by the HCN subunit composition. The three main isoforms that contribute to Ih in TC neurons reveal different voltage-dependent and kinetic properties in heterologous expression systems (Seifert et al., 1999; Robinson and Siegelbaum, 2003; Santoro and Baram, 2003). For example, compared with HCN2 and HCN4 (the latter reveals the highest cAMP sensitivity), the HCN1 isoform has faster activation kinetics, a more depolarized membrane voltage of activation, and less response to direct cAMP-dependent modulation. The combination of HCN2 and HCN4 is thought to result in a slow activation time course and a high cAMP sensitivity of Ih in TC neurons, with the later being fine tuned by the degree of HCN1 contribution (Ludwig et al., 2003; Budde et al., 2005, 2008). However, the relationship of the HCN isoform expression profile and Ih properties in native cells can be assumed to be more complex because channels might behave differently in expression systems and native cells, considerable differences exist between reported activation curves of cloned isoforms in different studies, and heteromerization of HCN channels may occur. HCN channel heteromers possess novel properties resembling those of neither heterologously expressed homomeric channels nor their arithmetic intermediates (Much et al., 2003; Richichi et al., 2008; Zha et al., 2008). In the thalamus, the analysis of Ih modulation by cAMP and halothane indeed indicated an important contribution of HCN1/HCN2 heterodimeric channels (Budde et al., 2005, 2008; Kuisle et al., 2006). Nevertheless, it is interesting to note that, in a computer model, using the activation curves established for cloned HCN channel isoforms in expression systems and weighting the influence of each isoform on Ih according to its protein expression level found in the present study resulted in mean activation Ih curves that were surprisingly consistent with those measured in cells in this study (supplemental Fig. S3, available at www.jneurosci.org as supplemental material).
Given the high intracellular cAMP levels and taking the dominance of HCN4 at P7 into account, one might expect more depolarized Vh values as found in this study. Therefore, our findings point to an as yet unidentified hyperpolarizing influence. Among others, two possible mechanisms may account for this. (1) Intracellular acidification leads to a hyperpolarizing shift in the Ih activation curve in TC neurons (Meuth et al., 2006). Because several components of cellular pH homeostasis, like carbonic anhydrases, mature steeply during the second postnatal week (Ruusuvuori et al., 2004), immature pH regulation may negatively modulate Ih activation curves. (2) An even more intriguing scenario may involve the puzzling HCN3 isoform. Immunohistochemical staining revealed HCN3 expression early postnatally in TC neurons of three rat strains (ACI, Sprague Dawley, and WAG/Rij) but not in adult animals (data not shown). Although the current generated by the HCN3 isoform is very similar to HCN2, cAMP induces a shift of HCN3 voltage dependency to more hyperpolarized potentials (Mistrik et al., 2005). Therefore, the early postnatal expression of this isoform may account for the rather negative activation curve at P7.
Altogether, these findings point to a scenario in which TC neurons regulate the expression of all four distinct Ih building blocks in combination with changing intracellular cAMP levels to achieve a current with maximal modulation by cAMP during early postnatal stages (HCN4 ≫ HCN2 > HCN1, presence of HCN3, high cAMP levels) compared with adult stages (HCN2 > HCN4 ≫ HCN1, low cAMP levels). Thus, transcriptional control of HCN channel genes in TC neurons represents a potent molecular mechanism that balances current density and modulatory range of Ih.
Functional relevance of Ih properties during development
During states of wakefulness and rapid eye movement (REM) sleep, the thalamocortical system is characterized by tonic action potential generation and high-frequency oscillations (∼40 Hz) (Steriade et al., 1997). During states of NREM and slow-wave sleep, the thalamocortical system shows highly synchronized oscillatory burst activity (<15 Hz). HCN channels play two essential roles in this scenario. (1) Cyclic interaction with T-type Ca2+ channels enables the generation of rhythmic activity in TC neurons (McCormick and Bal, 1997). (2) The arousal-inducing function exerted by the ascending brainstem system depends on the release of neurotransmitters that govern the switch from burst to tonic firing. Noradrenaline and 5-HT are of special interest because their effects significantly depend on their modulation of HCN channels (McCormick and Pape, 1990). Modulation by brainstem transmitters shifts the voltage dependence of activation of HCN channels to more depolarized potentials. This consequently depolarizes the membrane, increases the input resistance, and thereby favors the tonic firing mode. Therefore, the density and the properties of Ih during development are crucial factors in the generation and termination of sleep-related TC activity, and it is not surprising that these are tightly regulated by coordinated expression of all HCN channel isoforms.
Developmental regulation of HCN channels, Ih, and sleep
Two models have been suggested for the appearance of REM and NREM sleep during mammalian ontogeny (Frank and Heller, 2003; Blumberg et al., 2005). REM and NREM sleep is thought to develop from either two different immature, homologous sleep states or a common form of early sleep termed “presleep.” The transformation of presleep into REM and NREM begins if the neocortical EEG exhibits state-dependent differentiated activity. In young rats, the EEG does not exhibit slow-wave activity (Fig. 6A) and rhythmic thalamocortical phenomena do not appear until P12 (Jouvet-Mounier et al., 1970; Mares et al., 1982; Seelke and Blumberg, 2008). Although the maturation of multiple ion channels and receptors as well as neuronal networks contributes to the development of adult sleep patterns, the present study points to a scenario in which an essential molecular prerequisite of intrinsic oscillatory activity in TC neurons, Ih, gradually matures and, as soon as a certain current density is reached, enables the appearance of delta activity in single TC neurons (and in the thalamocortical network). Given the high modulatory reserve of Ih in young animals, computer modeling suggests that this takes place at P12–P14. These findings are in good agreement with dynamic clamp studies in cat TC neurons in which the occurrence of spontaneous delta activity depends on the presence of an artificial Ih of sufficient amplitude (Hughes et al., 1998). Therefore, the maturation of Ih partially contributes to the development of slow-wave sleep rhythms and the establishment of adult sleep/wake patterns in rats.
Footnotes
This work was supported by Deutsche Forschungsgemeinschaft Grants BU 1019/8-1 and BE 4107/2-1, Interdisziplinäres Zentrum für Klinische Forschung Grant Bud/005/07, and National Institutes of Health Grants NS 35439 and NS 45540. This work was done in partial fulfillment of the MD thesis of M.P. and the PhD thesis of P.M. We thank A. Markovic, E. Naß, and S. Ruppel for excellent technical assistance.
References
- Bender and Baram, 2008.Bender RA, Baram TZ. HCN channels in developing neuronal networks. Prog Neurobiol. 2008;86:129–140. doi: 10.1016/j.pneurobio.2008.09.007. [DOI] [PMC free article] [PubMed] [Google Scholar]
- Bender et al., 2001.Bender RA, Brewster A, Santoro B, Ludwig A, Hofmann F, Biel M, Baram TZ. Differential and age-dependent expression of hyperpolarization-activated, cyclic nucleotide-gated cation channel isoforms 1–4 suggests evolving roles in the developing rat hippocampus. Neuroscience. 2001;106:689–698. doi: 10.1016/s0306-4522(01)00314-1. [DOI] [PMC free article] [PubMed] [Google Scholar]
- Bender et al., 2003.Bender RA, Soleymani SV, Brewster AL, Nguyen ST, Beck H, Mathern GW, Baram TZ. Enhanced expression of a specific hyperpolarization-activated cyclic nucleotide-gated cation channel (HCN) in surviving dentate gyrus granule cells of human and experimental epileptic hippocampus. J Neurosci. 2003;23:6826–6836. doi: 10.1523/JNEUROSCI.23-17-06826.2003. [DOI] [PMC free article] [PubMed] [Google Scholar]
- Blumberg et al., 2005.Blumberg MS, Karlsson KA, Seelke AM, Mohns EJ. The ontogeny of mammalian sleep: a response to Frank and Heller (2003) J Sleep Res. 2005;14:91–98. doi: 10.1111/j.1365-2869.2004.00430_1.x. [DOI] [PMC free article] [PubMed] [Google Scholar]
- Brewster et al., 2002.Brewster A, Bender RA, Chen Y, Dube C, Eghbal-Ahmadi M, Baram TZ. Developmental febrile seizures modulate hippocampal gene expression of hyperpolarization-activated channels in an isoform- and cell-specific manner. J Neurosci. 2002;22:4591–4599. doi: 10.1523/JNEUROSCI.22-11-04591.2002. [DOI] [PMC free article] [PubMed] [Google Scholar]
- Brewster et al., 2005.Brewster AL, Bernard JA, Gall CM, Baram TZ. Formation of heteromeric hyperpolarization-activated cyclic nucleotide-gated (HCN) channels in the hippocampus is regulated by developmental seizures. Neurobiol Dis. 2005;19:200–207. doi: 10.1016/j.nbd.2004.12.015. [DOI] [PMC free article] [PubMed] [Google Scholar]
- Brewster et al., 2007.Brewster AL, Chen Y, Bender RA, Yeh A, Shigemoto R, Baram TZ. Quantitative analysis and subcellular distribution of mRNA and protein expression of the hyperpolarization-activated cyclic nucleotide-gated channels throughout development in rat hippocampus. Cereb Cortex. 2007;17:702–712. doi: 10.1093/cercor/bhk021. [DOI] [PMC free article] [PubMed] [Google Scholar]
- Budde et al., 2005.Budde T, Caputi L, Kanyshkova T, Staak R, Abrahamczik C, Munsch T, Pape HC. Impaired regulation of thalamic pacemaker channels through an imbalance of subunit expression in absence epilepsy. J Neurosci. 2005;25:9871–9882. doi: 10.1523/JNEUROSCI.2590-05.2005. [DOI] [PMC free article] [PubMed] [Google Scholar]
- Budde et al., 2008.Budde T, Coulon P, Pawlowski M, Meuth P, Kanyshkova T, Japes A, Meuth SG, Pape HC. Reciprocal modulation of Ih and ITASK in thalamocortical relay neurons by halothane. Pflugers Arch. 2008;456:1061–1073. doi: 10.1007/s00424-008-0482-9. [DOI] [PubMed] [Google Scholar]
- Chen et al., 2005.Chen X, Sirois JE, Lei Q, Talley EM, Lynch C, 3rd, Bayliss DA. HCN subunit-specific and cAMP-modulated effects of anesthetics on neuronal pacemaker currents. J Neurosci. 2005;25:5803–5814. doi: 10.1523/JNEUROSCI.1153-05.2005. [DOI] [PMC free article] [PubMed] [Google Scholar]
- Cueni et al., 2009.Cueni L, Canepari M, Adelman JP, Lüthi A. Ca(2+) signaling by T-type Ca(2+) channels in neurons. Pflugers Arch. 2009;457:1161–1172. doi: 10.1007/s00424-008-0582-6. [DOI] [PubMed] [Google Scholar]
- Destexhe et al., 1996.Destexhe A, Bal T, McCormick DA, Sejnowski TJ. Ionic mechanisms underlying synchronized oscillations and propagating waves in a model of ferret thalamic slices. J Neurophysiol. 1996;76:2049–2070. doi: 10.1152/jn.1996.76.3.2049. [DOI] [PubMed] [Google Scholar]
- Frank and Heller, 2003.Frank MG, Heller HC. The ontogeny of mammalian sleep: a reappraisal of alternative hypotheses. J Sleep Res. 2003;12:25–34. doi: 10.1046/j.1365-2869.2003.00339.x. [DOI] [PubMed] [Google Scholar]
- Hines and Carnevale, 2001.Hines ML, Carnevale NT. NEURON: a tool for neuroscientists. Neuroscientist. 2001;7:123–135. doi: 10.1177/107385840100700207. [DOI] [PubMed] [Google Scholar]
- Hughes et al., 1998.Hughes SW, Cope DW, Crunelli V. Dynamic clamp study of Ih modulation of burst firing and delta oscillations in thalamocortical neurons in vitro. Neuroscience. 1998;87:541–550. doi: 10.1016/s0306-4522(98)00170-5. [DOI] [PubMed] [Google Scholar]
- Jouvet-Mounier et al., 1970.Jouvet-Mounier D, Astic L, Lacote D. Ontogenesis of the states of sleep in rat, cat, and guinea pig during the first postnatal month. Dev Psychobiol. 1970;2:216–239. doi: 10.1002/dev.420020407. [DOI] [PubMed] [Google Scholar]
- Kaupp and Seifert, 2001.Kaupp UB, Seifert R. Molecular diversity of pacemaker ion channels. Annu Rev Physiol. 2001;63:235–257. doi: 10.1146/annurev.physiol.63.1.235. [DOI] [PubMed] [Google Scholar]
- Kuisle et al., 2006.Kuisle M, Wanaverbecq N, Brewster AL, Frère SG, Pinault D, Baram TZ, Lüthi A. Functional stabilization of weakened thalamic pacemaker channel regulation in rat absence epilepsy. J Physiol. 2006;575:83–100. doi: 10.1113/jphysiol.2006.110486. [DOI] [PMC free article] [PubMed] [Google Scholar]
- Ludwig et al., 2003.Ludwig A, Budde T, Stieber J, Moosmang S, Wahl C, Holthoff K, Langebartels A, Wotjak C, Munsch T, Zong X, Feil S, Feil R, Lancel M, Chien KR, Konnerth A, Pape HC, Biel M, Hofmann F. Absence epilepsy and sinus dysrhythmia in mice lacking the pacemaker channel HCN2. EMBO J. 2003;22:216–224. doi: 10.1093/emboj/cdg032. [DOI] [PMC free article] [PubMed] [Google Scholar]
- Lüthi and McCormick, 1998.Lüthi A, McCormick DA. H-current: properties of a neuronal and network pacemaker. Neuron. 1998;21:9–12. doi: 10.1016/s0896-6273(00)80509-7. [DOI] [PubMed] [Google Scholar]
- Mares et al., 1982.Mares P, Maresová D, Trojan S, Fischer J. Ontogenetic development of rhythmic thalamo-cortical phenomena in the rat. Brain Res Bull. 1982;8:765–769. doi: 10.1016/0361-9230(82)90103-4. [DOI] [PubMed] [Google Scholar]
- McCormick and Bal, 1997.McCormick DA, Bal T. Sleep and arousal: thalamocortical mechanisms. Annu Rev Neurosci. 1997;20:185–215. doi: 10.1146/annurev.neuro.20.1.185. [DOI] [PubMed] [Google Scholar]
- McCormick and Huguenard, 1992.McCormick DA, Huguenard JR. A model of the electrophysiological properties of thalamocortical relay neurons. J Neurophysiol. 1992;68:1384–1400. doi: 10.1152/jn.1992.68.4.1384. [DOI] [PubMed] [Google Scholar]
- McCormick and Pape, 1990.McCormick DA, Pape HC. Properties of a hyperpolarization-activated cation current and its role in rhythmic oscillation in thalamic relay neurones. J Physiol. 1990;431:291–318. doi: 10.1113/jphysiol.1990.sp018331. [DOI] [PMC free article] [PubMed] [Google Scholar]
- Meuth et al., 2005.Meuth P, Meuth SG, Jacobi D, Broicher T, Pape HC, Budde T. Get the rhythm: modeling of neuronal activity. J Undergrad Neurosci Educ. 2005;4:A1–A11. [PMC free article] [PubMed] [Google Scholar]
- Meuth et al., 2006.Meuth SG, Kanyshkova T, Meuth P, Landgraf P, Munsch T, Ludwig A, Hofmann F, Pape HC, Budde T. The membrane resting potential of thalamocortical relay neurons is shaped by the interaction among TASK3 and HCN2 channels. J Neurophysiol. 2006;96:1517–1529. doi: 10.1152/jn.01212.2005. [DOI] [PubMed] [Google Scholar]
- Mistrík et al., 2005.Mistrík P, Mader R, Michalakis S, Weidinger M, Pfeifer A, Biel M. The murine HCN3 gene encodes a hyperpolarization-activated cation channel with slow kinetics and unique response to cyclic nucleotides. J Biol Chem. 2005;280:27056–27061. doi: 10.1074/jbc.M502696200. [DOI] [PubMed] [Google Scholar]
- Monteggia et al., 2000.Monteggia LM, Eisch AJ, Tang MD, Kaczmarek LK, Nestler EJ. Cloning and localization of the hyperpolarization-activated cyclic nucleotide-gated channel family in rat brain. Brain Res Mol Brain Res. 2000;81:129–139. doi: 10.1016/s0169-328x(00)00155-8. [DOI] [PubMed] [Google Scholar]
- Moosmang et al., 1999.Moosmang S, Biel M, Hofmann F, Ludwig A. Differential distribution of four hyperpolarization-activated cation channels in mouse brain. Biol Chem. 1999;380:975–980. doi: 10.1515/BC.1999.121. [DOI] [PubMed] [Google Scholar]
- Much et al., 2003.Much B, Wahl-Schott C, Zong X, Schneider A, Baumann L, Moosmang S, Ludwig A, Biel M. Role of subunit heteromerization and N-linked glycosylation in the formation of functional hyperpolarization-activated cyclic nucleotide-gated channels. J Biol Chem. 2003;278:43781–43786. doi: 10.1074/jbc.M306958200. [DOI] [PubMed] [Google Scholar]
- Pape, 1996.Pape HC. Queer current and pacemaker: the hyperpolarization-activated cation current in neurons. Annu Rev Physiol. 1996;58:299–327. doi: 10.1146/annurev.ph.58.030196.001503. [DOI] [PubMed] [Google Scholar]
- Richichi et al., 2008.Richichi C, Brewster AL, Bender RA, Simeone TA, Zha Q, Yin HZ, Weiss JH, Baram TZ. Mechanisms of seizure-induced “transcriptional channelopathy” of hyperpolarization-activated cyclic nucleotide gated (HCN) channels. Neurobiol Dis. 2008;29:297–305. doi: 10.1016/j.nbd.2007.09.003. [DOI] [PMC free article] [PubMed] [Google Scholar]
- Robinson and Siegelbaum, 2003.Robinson RB, Siegelbaum SA. Hyperpolarization-activated cation currents: from molecules to physiological function. Annu Rev Physiol. 2003;65:453–480. doi: 10.1146/annurev.physiol.65.092101.142734. [DOI] [PubMed] [Google Scholar]
- Ruusuvuori et al., 2004.Ruusuvuori E, Li H, Huttu K, Palva JM, Smirnov S, Rivera C, Kaila K, Voipio J. Carbonic anhydrase isoform VII acts as a molecular switch in the development of synchronous gamma-frequency firing of hippocampal CA1 pyramidal cells. J Neurosci. 2004;24:2699–2707. doi: 10.1523/JNEUROSCI.5176-03.2004. [DOI] [PMC free article] [PubMed] [Google Scholar]
- Santoro and Baram, 2003.Santoro B, Baram TZ. The multiple personalities of h-channels. Trends Neurosci. 2003;26:550–554. doi: 10.1016/j.tins.2003.08.003. [DOI] [PMC free article] [PubMed] [Google Scholar]
- Seelke and Blumberg, 2008.Seelke AM, Blumberg MS. The microstructure of active and quiet sleep as cortical delta activity emerges in infant rats. Sleep. 2008;31:691–699. doi: 10.1093/sleep/31.5.691. [DOI] [PMC free article] [PubMed] [Google Scholar]
- Seifert et al., 1999.Seifert R, Scholten A, Gauss R, Mincheva A, Lichter P, Kaupp UB. Molecular characterization of a slowly gating human hyperpolarization-activated channel predominantly expressed in thalamus, heart, and testis. Proc Natl Acad Sci U S A. 1999;96:9391–9396. doi: 10.1073/pnas.96.16.9391. [DOI] [PMC free article] [PubMed] [Google Scholar]
- Shin and Chetkovich, 2007.Shin M, Chetkovich DM. Activity-dependent regulation of h channel distribution in hippocampal CA1 pyramidal neurons. J Biol Chem. 2007;282:33168–33180. doi: 10.1074/jbc.M703736200. [DOI] [PMC free article] [PubMed] [Google Scholar]
- Sinton and McCarley, 2004.Sinton CM, McCarley RW. Neurophysiological mechanisms of sleep and wakefulness: a question of balance. Semin Neurol. 2004;24:211–223. doi: 10.1055/s-2004-835067. [DOI] [PubMed] [Google Scholar]
- Staunton, 2005.Staunton H. Mammalian sleep. Naturwissenschaften. 2005;92:203–220. doi: 10.1007/s00114-005-0618-0. [DOI] [PubMed] [Google Scholar]
- Steriade et al., 1997.Steriade M, Jones EG, McCormick DA. Thalamus. Ed 1. Amsterdam: Elsevier; 1997. [Google Scholar]
- Surges et al., 2006.Surges R, Brewster AL, Bender RA, Beck H, Feuerstein TJ, Baram TZ. Regulated expression of HCN channels and cAMP levels shape the properties of the h current in developing rat hippocampus. Eur J Neurosci. 2006;24:94–104. doi: 10.1111/j.1460-9568.2006.04880.x. [DOI] [PMC free article] [PubMed] [Google Scholar]
- Vasilyev and Barish, 2002.Vasilyev DV, Barish ME. Postnatal development of the hyperpolarization-activated excitatory current Ih in mouse hippocampal pyramidal neurons. J Neurosci. 2002;22:8992–9004. doi: 10.1523/JNEUROSCI.22-20-08992.2002. [DOI] [PMC free article] [PubMed] [Google Scholar]
- Wainger et al., 2001.Wainger BJ, DeGennaro M, Santoro B, Siegelbaum SA, Tibbs GR. Molecular mechanism of cAMP modulation of HCN pacemaker channels. Nature. 2001;411:805–810. doi: 10.1038/35081088. [DOI] [PubMed] [Google Scholar]
- Zha et al., 2008.Zha Q, Brewster AL, Richichi C, Bender RA, Baram TZ. Activity-dependent heteromerization of the hyperpolarization-activated, cyclic-nucleotide gated (HCN) channels: role of N-linked glycosylation. J Neurochem. 2008;105:68–77. doi: 10.1111/j.1471-4159.2007.05110.x. [DOI] [PMC free article] [PubMed] [Google Scholar]