Abstract
Background
Eosinophil Associated Gastrointestinal Disorders (EGIDs) are commonly associated with atopy and are being recognized with increasing frequency. Current therapy for EGIDs is inadequate.
Objective
We sought to determine the efficacy of anti-IgE therapy in EGIDs and investigate the role of IgE in disease pathogenesis.
Methods
Nine subjects with EGIDs received omalizumab every 2 weeks for 16 weeks while other therapy was held constant. Blood absolute eosinophil counts, tissue eosinophil counts, symptom scores, and free IgE were serially measured. Allergen skin testing, and flow cytometry for basophil activation and FcεRI were determined at baseline and at week 16.
Results
Omalizumab was associated with a decrease in absolute eosinophil count at both the 16 week (34%, p=0.004) and combined weeks 12–16 (42%, p=0.012) time points. Tissue eosinophils decreased in the duodenum (59%) and gastric antrum (69%), but did not reach statistical significance (p=0.074 and 0.098, respectively). Esophageal eosinophil counts remained unchanged. Basophil and dendritic cell FcεRI expression, and free IgE were all significantly decreased (p<0.005). Omalizumab increased the concentration of allergen required to trigger half-maximal basophil activation by 170-fold. Allergen skin test wheal and erythema responses decreased by 78% and 82%, respectively. Symptom scores were decreased at both the midstudy (63%) and end of study (70%) time points (p<0.005 for both).
Conclusion
These results demonstrate that IgE-mediated processes contribute to the generation of eosinophilic inflammation in EGIDs, and suggest that anti-IgE therapy may be effective in these disorders.
Clinical implications
Anti-IgE may be a potential therapy for EGIDs.
Keywords: Eosinophil, eosinophilic gastroenteritis, eosinophilic esophagitis, omalizumab, IgE, food allergy, basophil
Introduction
Eosinophil Associated Gastrointestinal Disorders (EGIDs), comprising eosinophilic esophagitis (EE), eosinophilic gastroenteritis (EG) and eosinophilic colitis, are a spectrum of diseases that are being diagnosed with increasing frequency.1 Approximately 75% of EGID patients are atopic, with a high prevalence of positive food allergen skin tests.1, 2 Some EGID patients improve after institution of an amino acid based elemental diet and will then exacerbate after resumption of an unrestricted diet.3 In sum, these findings support the concept that food allergen driven eosinophilic inflammation plays a major role in disease pathogenesis.
Since recognition of EGIDs as an important clinical entity is recent, there remain substantial deficits in our understanding of their pathogenesis and treatment. Mouse models of EGIDs demonstrate a Th2 polarized inflammatory response with important roles played by multiple cytokines, including IL-5, IL-13, eotaxin-1 (CCL11), and eotaxin-3 (CCL24).4 EGIDs have been hypothesized to be a mixed inflammatory disease driven by both food allergen specific IgE and Th2 cells.4
Omalizumab is a humanized therapeutic anti-IgE mAb that reduces free IgE levels and is an effective treatment for allergic asthma and seasonal allergic rhinitis.5 A different anti-IgE therapeutic, TNX-901, was shown to increase the maximum tolerated dose of peanut by 10-fold in subjects with peanut hypersensitivity.6 Although no studies have specifically addressed the use of omalizumab in eosinophilic diseases, omalizumab significantly decreases peripheral blood7, bronchial8, and skin9 eosinophilia.
We thus employed a clinical trial of omalizumab in EGID subjects to determine the effect of omalizumab on peripheral blood eosinophilia and other measures of EGID disease activity. Furthermore, this allowed us to investigate the role of IgE in EGID pathogenesis, and examine anti-IgE as a potential non-corticosteroid therapy for EGIDs.
Methods
Subjects
Nine subjects with EG based on typical gastrointestinal symptoms, ≥ 25 eosinophils per high power field (hpf) in stomach or duodenal biopsies, and negative work-up for other etiologies of gut eosinophilia, including helminth infection, were enrolled. Crohn's disease was ruled out by lack of pathologic findings (ulcerations, granulomata, or crypt architectural distortion) and clinical features (fistula, abdominal mass, surgical obstructive disease) consistent with the disease. Inclusion criteria included age 12–76 years, a pre-study baseline absolute eosinophil count (AEC) ≥500 eosinophils per mm3, and evidence of atopy by skin or serologic testing, or total serum IgE ≥100 IU/mL. Exclusion criteria included immunodeficiency, the presence of the FIP1L1-PDGF-R fusion gene, and an IgE times weight product of >63,000 kg×IU(IgE)/mL.
Study design
The study was a single center open label study conducted from December 2003 to August 2006. The NIAID Institutional Review Board approved the study and all subjects signed informed consent. After a 3 week baseline screening period, subjects received omalizumab subcutaneously during study week 0, and then every 2 weeks for a total of 8 doses. Medications and dietary restrictions were held constant. Because doses below that indicated in the package insert provide clinical benefit,10 to maximize accrual, subjects with IgE & weight beyond those allowed by the Xolair® package insert were enrolled. Thus, three subjects (1–3) had a baseline serum IgE×weight product above that allowed by the package insert, but within the study entry criteria. Subject 4 received 85 mg per dose; all other subjects received 375 mg per dose. Each subject's omalizumab dose calculated in mg/kg/IU(IgE)/mL is noted in Table I. Subjects were observed for 24 hours after the first dose and for 2 hours after subsequent doses.
Table I.
Study Subjects
| Subjects/ symbol |
Disease location (E/G/D) |
Predominant symptom |
Ag (y) |
Sex | Weight (kg) |
Baseline IgE (U/mL) |
Omalizumab dose (mg/kg/ IU(IgE)/mL) |
Duration of Disease (y) |
Concurrent Therapy | Allergen sensitivity |
Baseline AEC × 109/L |
|---|---|---|---|---|---|---|---|---|---|---|---|
S1
|
E/G/D | Abdominal pain | 37 | M | 80 | 583 | 0.0080 | 2 | None | Peanut, egg, wheat, carrot, apple, mites | 2732 |
S2
|
G | Abdominal pain | 48 | M | 66 | 780 | 0.0073 | 9 | Budesonide 6 mg qD, omeprazole, fexofenadine, doxepin, ketotifen | Peanut, soy, wheat, pork, corn, shrimp, cod, walnut, mites | 1779 |
S3
|
E/G/D | Abdominal pain, bloating, dysphagia | 45 | M | 76 | 555 | 0.0089 | 4 | Budesonide 9 mg qD, cetirizine, montelukast | Peanut, egg, wheat, carrot, apple, mites | 1889 |
S4
|
E/G/D | Abdominal pain | 40 | M | 78 | 42 | 0.02 | 5 | Prednisone 25 mg QOD, omeprazole, | Peanut, egg, wheat, corn, soy, milk | 2485 |
S5
|
E/D | Diarrhea | 60 | M | 64 | 370 | 0.016 | 1 | None | None | 564 |
S6
|
E/G/D | Abdominal pain | 30 | M | 71 | 228 | 0.017 | 14 | Prednisone 10 mg dD, esomeprazole, loratadine, fluticasone/salmeterol inhaler | Peanut, egg, soy, pork, corn, pecan, mites | 4221 |
S7
|
G/D | Abdominal pain, bloating, vomiting | 49 | F | 68 | 223 | 0.025 | 10 | Budesonide 6 mg qD, esomeprazole, fexofenadine, nasal fluticasone, fluticasone/salmeterol inhaler | Peanut, soy, wheat, shrimp, chicken, walnut, mites, ragweed | 768 |
S8
|
E/G/D | Abdominal pain, bloating, nausea | 42 | F | 76 | 268 | 0.018 | 2 | None | Peanut, soy, wheat, egg, corn, shrimp, cod | 1134 |
S9
|
E/G/D | Bloating, nausea, early satiety | 33 | F | 61 | 266 | 0.023 | 8 | Lansoprazole | Peanut, pork, oats, mites | 1040 |
S= subject, E=esophagus, G=stomach, D=duodenum, qD=every day. QOD= every other day. Allergen sensitivity ≡ Skin test wheal ≥3 mm above control.
During the 3 week pre-omalizumab baseline screening, subjects underwent esophagoduodenoscopy with biopsy, lymphapheresis, and titration skin testing. Baseline laboratory measurements included complete blood count with AEC, total serum IgE, FcεRI expression, in vitro basophil activation, and a free IgE analysis. All baseline studies were repeated after 16 weeks. Total and free IgE determinations were performed by the Johns Hopkins University Dermatology, Allergy and Clinical Immunology Reference Laboratory. Subjects underwent epicutaneous titration allergen skin testing at baseline and again at week 16. Commercial allergens (Greer Laboratories) were used neat and at serial 3-fold dilutions to a final 1:729 dilution. Each dilution was tested in duplicate and the wheal and erythema were measured at 15 minutes along two orthogonal axes. The products of the two orthogonal values for each dilution were averaged. Allergens studied were peanut (subjects S1, S4, S8) Dermatophagoides pteronyssinus (S2), corn (S6), ragweed (S7), and oats (S9). Two subjects (S3, S5) had negative skin tests during the baseline testing and were not included in the analysis.
Antibodies and Reagents
Anti-FcεRIα (clone AER-37) was obtained from eBiosciences, San Diego, CA. Anti-CD1c/BDCA (clone AD5-8E7), BDCA-2 (clone AC144) (Miltenyi Biotec, Auburn, CA, USA); HLA-DR, CD11c, CD63 and CD123 (BD-PharMingen, San Diego, CA); and lineage cocktail 1 (lin-1: CD3, CD14, CD16, CD19, CD20, and CD56), CD4 (Becton-Dickinson Biosciences, San Jose, CA) were purchased. Biotin labeled and unlabeled goat anti-human IgE were obtained from Biosource, Camarillo, CA and Kirkegaard and Perry Laboratories, Gaithersburg, MD, respectively.
Basophil activation via CD63 was measured using published methods.11 Basophils were activated with anti-IgE and clinically implicated allergens, including peanut (subjects S1, S3, S5, S8), Dermatophagoides farinii (S2, S9), soy (S4), pecan (S6), and shrimp (S7) (Greer Laboratories, Lenoir, NC). Briefly, 20 μl of stimulation buffer (20 mM HEPES, 125 mM NaCl, 5 mM KCl, 2.4 mM CaCl2, 1 mM MgCl2, 0.5 mM Glucose, all Sigma-Aldrich), IL-3 (10 ng/mL final concentration, Peprotech, Rocky Hill, NJ) and ½log10 dilutions of allergen or anti-IgE were added to 100 μl of heparinized whole blood, mixed, and incubated at 37°C for 15 min. Controls included whole blood plus stimulation buffer, with or without IL-3 (later referred to as constitutive activation) or N-formyl-methionine-leucine-phenylalanine (fMLP, Sigma-Aldrich, St. Louis, MO). Samples were then stained on ice with mAbs to CD63, CD123, HLA-DR and CD4 for 20 minutes, treated with 2 mL of FACSLyse, resuspended in PBS/10% DMSO and stored at −80°C. Cryopreserved fixed cells were thawed, acquired on a FACSCalibur flow cytometer (BD Biosciences) and analyzed with FlowJo software (Tree Star). For 6 subjects, the baseline and 16 week time points were each repeated twice on two consecutive days and the results averaged; for 3 subjects each time point was only examined once. Basophils were identified as CD123+, HLA-DR-, CD4- cells. The percentage of CD63+ basophils was determined for each concentration of allergen or anti-IgE, and the concentration yielding 50% of the maximal response (EC50) was determined using a sigmoidal dose-response curve fit with Prism software (GraphPad, San Diego, CA). Some dose response curves were flat because either all concentrations (including the negative control) exhibited maximal activation, or because omalizumab abrogated basophil activation (no response at all concentrations). These were arbitrarily assigned a minimum or maximum EC50 value, respectively.
Flow cytometric analysis of FcεRI expression and surface IgE by basophils and dendritic cells (DC) was performed using a 6 color adaptation of published methods12, 13. PBMC were prepared from EDTA anticoagulated blood using1.077 g/mL ficoll-diatrizoate (Sigma, St Louis, Mo) density gradient separation, fixed in 4% room temperature paraformaldehyde for 5 minutes, resuspended in PBS/10% dimethyl sulfoxide (Sigma) and stored at −80°C. Cryopreserved fixed cells were thawed, blocked in PBS/1% BSA/5% nonfat milk powder (PBS/BSA/milk) on ice for 30 minutes, and then stained on ice with the following mAbs. For FcεRI expression, cells were stained with mAbs to lin-1 FITC, FcεRI PE (phycoerythrin), CD123 PE/Cy5 (cyanin 5), BDCA-1 APC, BDCA-2 biotin and CD11c PE/Cy7, washed, and stained with streptavidin APC/Cy7 (Becton-Dickinson Biosciences, San Jose, Calif). For surface IgE binding, cells were stained with mAbs to lin-1 FITC, anti-IgE biotin (Biosource), CD123 PE/Cy5, and HLA-DR APC, washed, and stained with streptavidin PE (Becton-Dickinson Biosciences). Streptavidin staining was performed in PBS/1% BSA without milk. For FcεRI staining, basophils were identified as CD123bright, lin-1−, BDCA-2−; mDC were identified as BDCA-1+, CD11c+, lin−; and pDC were identified as CD123+, BDCA-2+, lin-1− subpopulations, respectively. For FcεRI staining, basophils were identified as CD123bright, lin-1−, HLA-DR−, and pDC were identified as CD123+, HLA-DR+, lin-1− subpopulations, respectively. Data were acquired on LSRII (FcεRI) or FACSCalibur (IgE) flow cytometers (both BD Biosciences) and analyzed with Flowjo software (Tree Star, Ashland, OR). Typically 300,000 to 600,000 total events were acquired to obtain ≥1000 basophils for analysis. FcεRIα and IgE fluorescence was quantitated as molecules of equivalent PE (MEPE) using 8 peak Rainbow Calibration Particles (Spherotech, Lake Forest, IL), as per the manufacturer's instructions. Free IgE was measured using a solid phase immunoenzymetric assay in which IgE was captured with anti-human IgE (clone HP6061) and detected with biotinylated FcεRI as described.14
Esophagoduodenoscopy and tissue eosinophil counting
Endoscopic biopsies were taken from the distal third of the esophagus, gastric antrum and body, and duodenum. A minimum of 5 biopsies were taken from each site, formalin fixed, and hematoxylin and eosin stained. Specimens were not collected for a given tissue site in 2 subjects (subject 3, esophagus; subject 4, gastric body) and were not included in the analysis. A blinded investigator determined the number of eosinophils per 40X hpf in 120 consecutive fields for each tissue site.
Symptom score
An EGID symptom score was modified from the Crohn's Disease Activity Index.15 The score separately rated symptoms from 0–3 in the following fields: stomach pain, nausea, vomiting, bloating, early satiety, dysphagia, and general well being. Symptom scores were recorded daily during the 3 weeks before starting omalizumab, and during study weeks 7–8 and 15–16; and for each period the mean value per day was calculated. An example of the symptom scorecard and scoring scale for each field is noted in the Online Repository.
Statistical analysis
The predesignated primary endpoint was the percent drop in AEC at week 16 (average of 2 or more determinations) compared to the baseline pre-omalizumab value (average of 2 or more determinations). Unless otherwise noted, median values were used as indicators of central tendency. The Wilcoxon signed rank test was used to compare paired data. The Spearman rank correlation test was used to test correlative data.
Results
Subjects
Of the 23 EGID patients screened, 9 subjects fulfilled the study inclusion criteria and were enrolled (Table I).
Adverse events
A total of 71 doses of omalizumab were administered with no severe adverse events. Laboratory studies done for the assessment of safety, including a Chem-20 panel, CBC, prothrombin and partial thromboplastin times were not adversely affected (data not shown).
Omalizumab effect on peripheral blood and gut eosinophils
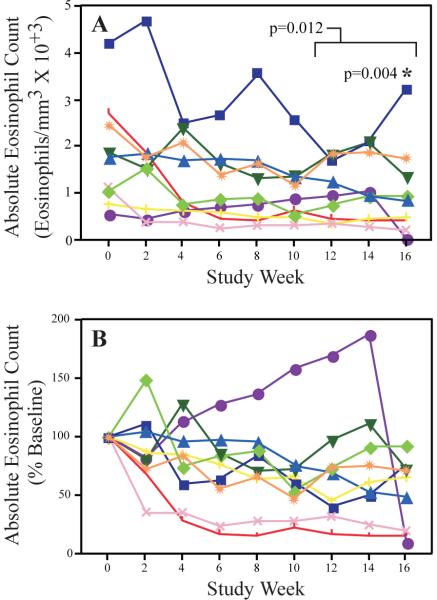
Omalizumab caused a significant drop in the AEC by week 16 (Fig 1; p=0.004, median and mean decrease of 34% and 47%, respectively). Similar reductions were apparent when analyzing the mean of the combined weeks 12, 14 and 16 AEC (p=0.012, median and mean decrease of 42% and 34%, respectively).
Figure 1.
Effect of omalizumab on peripheral blood eosinophil counts
Peripheral blood absolute eosinophil counts were determined at baseline (week 0) and every 2 weeks thereafter for the duration of the study. The actual values for each time point (A), as well as the value as a percentage of the pre-omalizumab baseline (B) are shown.
Although only 3 subjects were known to have EE prior to study entry, 7 out of 9 had esophageal biopsies that were diagnostic for concurrent EE with >25 eosinophils/hpf. As shown in Fig 2A–C, omalizumab therapy was associated with a downward trend in tissue eosinophilia in the duodenum (59% median decrease, p = 0.074) and gastric antrum (69% decrease, p = 0.098), and gastric body (54% decrease, p = 0.25), although these results did not reach statistical significance. In contrast, in Fig 2D, esophageal eosinophil counts trended upward during the study (25% median increase, p = 0.47). Changes in tissue eosinophil count did not correlate with changes in blood absolute eosinophil count (data not shown).
Figure 2.
Effect of omalizumab on tissue eosinophil counts
EGD was performed at baseline and again after 16 weeks of omalizumab therapy and the median number of eosinophils per hpf in the duodenum (A), gastric antrum (B) and body (C), and esophagus (D) were determined. Data are shown as the median value for each subject.
Efficacy of omalizumab in blocking IgE
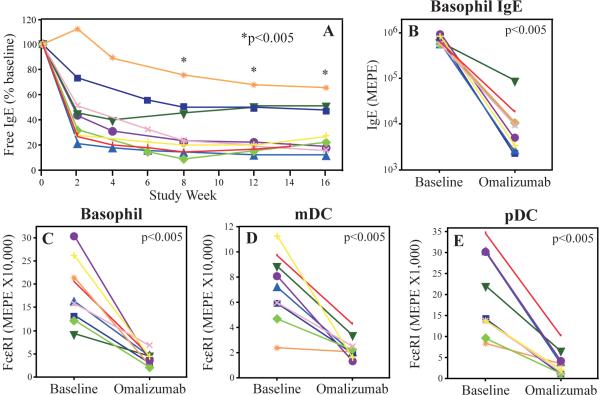
We next examined whether omalizumab effectively blocked IgE in the study population. Omalizumab treatment significantly lowered serum free IgE at the 8, 12 and 16-week time points (Fig 3A; median decrease of 76%, 80%, and 79%, respectively; p value of <0.005 for all). Similarly, cell surface bound IgE was decreased 98.4% in the basophil (Fig 3B) and 96% in the plasmacytoid DC (pDC) population (data not shown). Omalizumab treatment resulted in a significant drop in FcεRI surface expression in basophils and DCs (Fig 3C–E; 75%, 81%, and 61% drop for the basophil, myeloid DC (mDC) and pDC populations, respectively; p = <0.005 for all).
Figure 3.
Efficacy of omalizumab in blocking IgE
Changes in the level of serum free IgE (A), basophil associated IgE (B) and FcεRI expression by peripheral blood basophils (C), mDC (D), and pDC (E). The above were determined at baseline and again after 16 weeks of omalizumab. Free IgE was determined at baseline and serially thereafter. * = p<0.005 for each time point relative to baseline. Fluorescence intensity was quantitated as molecules of equivalent phycoerythrin (MEPE).
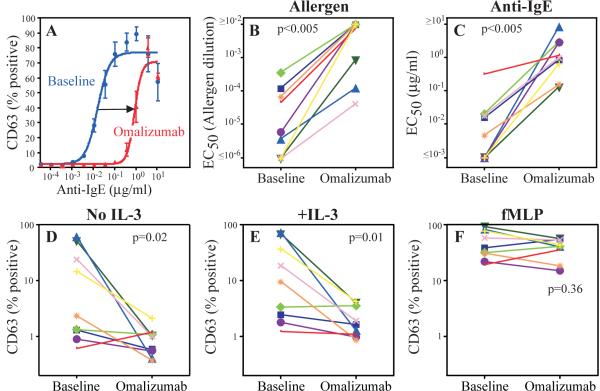
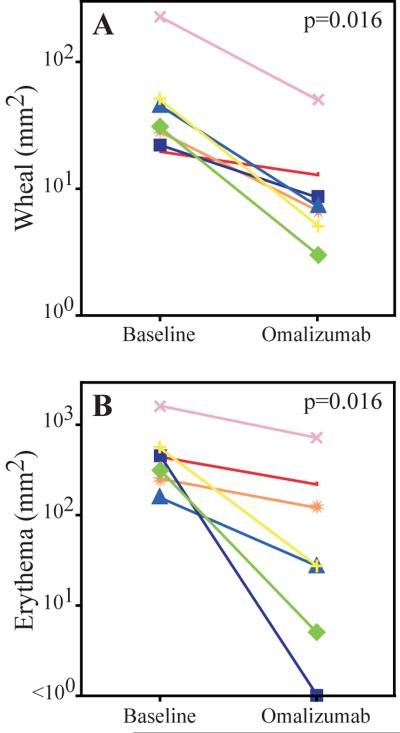
We further verified IgE blocking using a CD63 translocation based functional assay of basophil activation. At baseline, CD63 expression was 9.5% in the control, and 85.9% and 87.4% in the maximally activated allergen and anti-IgE activated conditions, respectively. Omalizumab therapy blocked in vitro basophil activation and shifted the dose response to both anti-IgE (Fig 4A) and allergen (data not shown). As seen in Figs 4B and C, omalizumab caused a large and significant increase in the EC50 to both allergen and anti-IgE (median 171-fold and 136-fold shifts, respectively, p < 0.005 for both). Additionally, omalizumab significantly decreased constitutive basophil activation by 84% and 89%, in whole blood without and with added IL-3, respectively (Fig 4D, E). Basophil responses to fMLP were unchanged (Fig 4F). As shown in Fig 5, omalizumab caused a significant reduction in allergen skin test wheal (median reduction 78%, p=0.016) and erythema (median reduction 82%, p=0.016). In sum, these data demonstrate that omalizumab effectively blocked IgE in the EGID patients and inhibited downstream events, such as FcεRI expression, IgE mediated basophil activation, and immediate hypersensitivity.
Figure 4.
Efficacy of omalizumab in blocking basophil activation
Basophil CD63 expression after in vitro activation by anti-IgE (A) and allergen (data not shown) was measured and the EC50 calculated for each, respectively (B, C). D–E, constitutive basophil CD63 expression without or with added IL-3. F, basophil CD63 expression after fMLP activation. The results were determined at baseline and again after 16 weeks of omalizumab.
Figure 5.
Efficacy of omalizumab in blocking immediate hypersensitivity
Wheal (A) and erythema (B) after food and aeroallergen titration skin testing at baseline and after 16 weeks of omalizumab. Each result is the mean of two skin tests.
Symptom scores
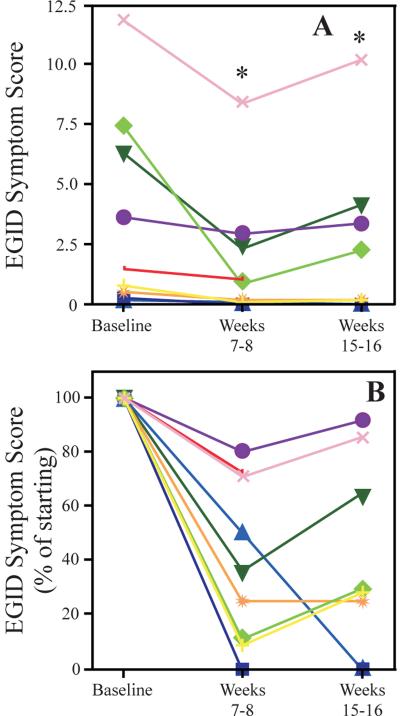
EGID symptom scores improved significantly at both the midstudy (weeks 7–8) and end of study (weeks 15–16) time points, with median reductions of 63% and 70%, respectively (Fig 6A, B; p < 0.005 for both). The 4 subjects with the highest baseline symptom score had less improvement compared with the 4 subjects with the lowest baseline symptoms (32% vs. 87% reduction, respectively). Improvements in EGID symptoms did not correlate with changes in blood or tissue eosinophils, or indices of IgE blocking (data not shown).
Figure 6.
Effect of omalizumab on EGID symptom scores
A, EGID symptom scores at baseline, mid study (weeks 7–8) and end of study (weeks 15–16). B, EGID symptom scores were calculated as a percentage of the baseline value for each subject. * = p<0.005 for each time point relative to baseline.
Discussion
In this report, we examine the safety and efficacy of anti-IgE therapy in EGID patients. We show that omalizumab therapy is associated with significant decreases in peripheral eosinophilia and gastrointestinal symptoms, and a trend towards lower eosinophil number in the gastric antrum and duodenum. Omalizumab was well tolerated. These results demonstrate that IgE mediated processes contribute to the generation of the eosinophilic inflammation in EGID, and suggest that anti-IgE therapy may be effective in these disorders.
In a recent study of children with EE, AEC correlated with tissue eosinophilia and disease activity, supporting its use as a biomarker of EGID disease activity.16 We thus used AEC as the primary endpoint to measure the impact of anti-IgE therapy on EGID disease activity. Almost all study endpoints improved in association with omalizumab therapy, and thus support the need for a multi-center placebo controlled study to definitively study anti-IgE therapy in EGIDs.
The partial AEC response found in most subjects, suggests that there are both IgE dependent and IgE independent inflammatory pathways operating in EGID.1 The magnitude of AEC decline was variable between subjects, suggesting heterogeneity in disease mechanism (Fig 1). This is most clearly seen in the 2 subjects who had the largest and the most rapid decline in AEC. This finding is not simply due to more effective IgE blocking in these subjects, as the data from Figs 3 and 4 indicate less effective IgE blocking in these subjects. Conversely, subject 4, who had the lowest IgE, had a dramatic increase in tissue eosinophilia. This suggests that EGID patients with IgE predominant disease may preferentially respond to omalizumab.
Omalizumab decreased both stomach and duodenum tissue eosinophilia, although these results did not achieve statistical significance (Fig 2). We performed a retrospective power analysis that indicated a minimum of 17 subjects was needed to give a 90% likelihood of detecting the magnitude of tissue eosinophil decrease we noted. This suggests that the lack of significance in our study is likely due to the small sample size (type 2 statistical error). In contrast to the decreases noted in the stomach and duodenum, the number of esophageal eosinophils trended upwards. Despite this increase in eosinophil number, there was not a concomitant increase in esophageal symptoms. Although the mechanistic basis for this finding is unclear, it further underscores the dichotomy between the esophagus and stomach/duodenum as distinct inflammatory sites in EGIDs, with differing epidemiology, pathophysiology and therapeutic response.
We used multiple techniques to verify that IgE and immediate hypersensitivity were effectively blocked (Figs 3–5). However, the level of IgE blockade in our study was substantially less than the 99% decrease in obtained in early phase studies17, suggesting more potent anti-IgE drugs may have greater efficacy in these disorders. We unexpectedly found increased CD63 expression in the baseline samples18, which suggests that basophils in EGIDs are constitutively active or have been activated in vivo. This finding is reminiscent of previous reports in subjects with food allergy19, 20 and chronic urticaria.21 Additionally, omalizumab decreased this constitutive basophil activation. Taken together, these results suggest that constitutive CD63 expression is a consequence of in vivo activation by allergen, and its decrease with omalizumab therapy reflects a reduction in IgE mediated basophil activation in vivo.
This study was open label in which subjects' diets and medications were held constant and the only variable introduced was omalizumab. This uncontrolled design is subject to sources of error, including placebo effect, changes in disease activity, and changes in therapy. Additionally, although no correlation between AEC decrease and aeroallergen season was found, it is possible that some subjects improved due to decreases in pollen allergen levels during the study. Thus, it is not possible to attribute the symptom improvement to the study drug alone. To measure EGID disease symptoms we modified the well accepted Crohn's Disease Activity Index. To our knowledge, this represents the first report of a symptom score to measure EGID disease activity. This scoring system is not validated, thus additional efforts are needed to validate this or similar symptom scores.
EGIDs represent a spectrum of diseases with increasing incidence, which lack safe and effective treatments. Progress in understanding EGID pathogenesis is needed to improve therapy. Our results demonstrate that omalizumab is effective in decreasing peripheral blood eosinophilia in EGIDs, and suggest that IgE mediated processes play a major role in the generation of eosinophilic inflammation in EGIDs. These results suggest that anti-IgE therapy, either alone or in combination with other antagonists, may be an effective treatment for EGIDs.
Supplementary Material
Acknowledgements
The authors thank Dr. Martha Quezado for diagnostic review of pathology materials, and Drs. Amy Klion and Erica Brittain for helpful discussion. The authors thank Pragya Gangele, Gettie Butts, and Dorrette Sutherland for their valuable assistance in endoscopy.
Funding: NIAID Division of Intramural Research Grant # Z01-AI-000761.
ClinicalTrials.gov identifier NCT00084097
Abbreviations
- AEC
Absolute eosinophil count
- DC
Dendritic cell
- EC50
Concentration yielding 50% maximal activation
- EGID
Eosinophilic gastrointestinal disorders
- EG
Eosinophilic gastroenteritis
- EE
Eosinophilic esophagitis
- hpf
high power field
- mAb
Monoclonal antibody
- mDC
myeloid dendritic cell
- MEPE
Molecules of equivalent phycoerythrin
- IU
International units
- pDC
plasmacytoid dendritic cell
- S
Subject number
Footnotes
Capsule summary Omalizumab treatment of subjects with eosinophil associated gastrointestinal disorders was associated with decreases in blood and tissue eosinophil counts, and improvements in symptoms. These results suggest that anti-IgE therapy may be effective in these disorders.
References
- 1.Rothenberg ME. Eosinophilic gastrointestinal disorders (EGID) J Allergy Clin Immunol. 2004;113:11–28. doi: 10.1016/j.jaci.2003.10.047. [DOI] [PubMed] [Google Scholar]
- 2.Spergel JM, Beausoleil JL, Mascarenhas M, Liacouras CA. The use of skin prick tests and patch tests to identify causative foods in eosinophilic esophagitis. J Allergy Clin Immunol. 2002;109:363–8. doi: 10.1067/mai.2002.121458. [DOI] [PubMed] [Google Scholar]
- 3.Markowitz JE, Spergel JM, Ruchelli E, Liacouras CA. Elemental diet is an effective treatment for eosinophilic esophagitis in children and adolescents. Am J Gastroenterol. 2003;98:777–82. doi: 10.1111/j.1572-0241.2003.07390.x. [DOI] [PubMed] [Google Scholar]
- 4.Blanchard C, Wang N, Rothenberg ME. Eosinophilic esophagitis: pathogenesis, genetics, and therapy. J Allergy Clin Immunol. 2006;118:1054–9. doi: 10.1016/j.jaci.2006.07.038. [DOI] [PubMed] [Google Scholar]
- 5.Holgate S, Casale T, Wenzel S, Bousquet J, Deniz Y, Reisner C. The anti-inflammatory effects of omalizumab confirm the central role of IgE in allergic inflammation. J Allergy Clin Immunol. 2005;115:459–65. doi: 10.1016/j.jaci.2004.11.053. [DOI] [PubMed] [Google Scholar]
- 6.Leung DY, Sampson HA, Yunginger JW, Burks AW, Jr., Schneider LC, Wortel CH, et al. Effect of anti-IgE therapy in patients with peanut allergy. N Engl J Med. 2003;348:986–93. doi: 10.1056/NEJMoa022613. [DOI] [PubMed] [Google Scholar]
- 7.Noga O, Hanf G, Kunkel G. Immunological and clinical changes in allergic asthmatics following treatment with omalizumab. Int Arch Allergy Immunol. 2003;131:46–52. doi: 10.1159/000070434. [DOI] [PubMed] [Google Scholar]
- 8.Djukanovic R, Wilson SJ, Kraft M, Jarjour NN, Steel M, Chung KF, et al. Effects of treatment with anti-immunoglobulin E antibody omalizumab on airway inflammation in allergic asthma. Am J Respir Crit Care Med. 2004;170:583–93. doi: 10.1164/rccm.200312-1651OC. [DOI] [PubMed] [Google Scholar]
- 9.Beck LA, Marcotte GV, MacGlashan D, Togias A, Saini S. Omalizumab-induced reductions in mast cell Fce psilon RI expression and function. J Allergy Clin Immunol. 2004;114:527–30. doi: 10.1016/j.jaci.2004.06.032. [DOI] [PubMed] [Google Scholar]
- 10.Hochhaus G, Brookman L, Fox H, Johnson C, Matthews J, Ren S, et al. Pharmacodynamics of omalizumab: implications for optimised dosing strategies and clinical efficacy in the treatment of allergic asthma. Curr Med Res Opin. 2003;19:491–8. doi: 10.1185/030079903125002171. [DOI] [PubMed] [Google Scholar]
- 11.Sainte-Laudy J, Sabbah A, Vallon C, Guerin JC. Analysis of anti-IgE and allergen induced human basophil activation by flow cytometry. Comparison with histamine release. Inflamm Res. 1998;47:401–8. doi: 10.1007/s000110050351. [DOI] [PubMed] [Google Scholar]
- 12.Foster B, Metcalfe DD, Prussin C. Human dendritic cell 1 and dendritic cell 2 subsets express FcepsilonRI: correlation with serum IgE and allergic asthma. J Allergy Clin Immunol. 2003;112:1132–8. doi: 10.1016/j.jaci.2003.09.011. [DOI] [PubMed] [Google Scholar]
- 13.Prussin C, Griffith DT, Boesel KM, Lin H, Foster B, Casale TB. Omalizumab treatment downregulates dendritic cell FcepsilonRI expression. J Allergy Clin Immunol. 2003;112:1147–54. doi: 10.1016/j.jaci.2003.10.003. [DOI] [PubMed] [Google Scholar]
- 14.Hamilton RG, Marcotte GV, Saini SS. Immunological methods for quantifying free and total serum IgE levels in allergy patients receiving omalizumab (Xolair) therapy. J Immunol Methods. 2005;303:81–91. doi: 10.1016/j.jim.2005.06.008. [DOI] [PubMed] [Google Scholar]
- 15.Yoshida EM. The Crohn's Disease Activity Index, its derivatives and the Inflammatory Bowel Disease Questionnaire: a review of instruments to assess Crohn's disease. Can J Gastroenterol. 1999;13:65–73. doi: 10.1155/1999/506915. [DOI] [PubMed] [Google Scholar]
- 16.Konikoff MR, Blanchard C, Kirby C, Buckmeier BK, Cohen MB, Heubi JE, et al. Potential of blood eosinophils, eosinophil-derived neurotoxin, and eotaxin-3 as biomarkers of eosinophilic esophagitis. Clin Gastroenterol Hepatol. 2006;4:1328–36. doi: 10.1016/j.cgh.2006.08.013. [DOI] [PubMed] [Google Scholar]
- 17.MacGlashan DW, Jr., Bochner BS, Adelman DC, Jardieu PM, Togias A, McKenzie-White J, et al. Down-regulation of Fc(epsilon)RI expression on human basophils during in vivo treatment of atopic patients with anti-IgE antibody. J Immunol. 1997;158:1438–45. [PubMed] [Google Scholar]
- 18.Sanz ML, Gamboa PM, Antepara I, Uasuf C, Vila L, Garcia-Aviles C, et al. Flow cytometric basophil activation test by detection of CD63 expression in patients with immediate-type reactions to betalactam antibiotics. Clin Exp Allergy. 2002;32:277–86. doi: 10.1046/j.1365-2222.2002.01305.x. [DOI] [PubMed] [Google Scholar]
- 19.Sampson HA, Broadbent KR, Bernhisel-Broadbent J. Spontaneous release of histamine from basophils and histamine-releasing factor in patients with atopic dermatitis and food hypersensitivity. N Engl J Med. 1989;321:228–32. doi: 10.1056/NEJM198907273210405. [DOI] [PubMed] [Google Scholar]
- 20.Shreffler WG. Evaluation of basophil activation in food allergy: present and future applications. Curr Opin Allergy Clin Immunol. 2006;6:226–33. doi: 10.1097/01.all.0000225165.83144.2f. [DOI] [PubMed] [Google Scholar]
- 21.Vasagar K, Vonakis BM, Gober LM, Viksman A, Gibbons SP, Jr., Saini SS. Evidence of in vivo basophil activation in chronic idiopathic urticaria. Clin Exp Allergy. 2006;36:770–6. doi: 10.1111/j.1365-2222.2006.02494.x. [DOI] [PubMed] [Google Scholar]
Associated Data
This section collects any data citations, data availability statements, or supplementary materials included in this article.


