1. Introduction
Sometimes working on a solution for one problem seems to create a new problem, or at least reveals a problem that was waiting to be uncovered. Such was the case with the availability of computational models in neuroscience. For many years, a common lament among computational neuroscientists was the difficulty of obtaining the source code used in published models. This constituted a serious barrier to a key element of scientific method: reproducibility.
We and our collaborators have been addressing this problem by developing ModelDB, a WWW-accessible resource designed to serve as a mechanism for attributed reuse of published models (1, 2). While it is still very much a neuroinformatics research project, ModelDB is already seeing heavy use by modelers from labs around the world. In the short time since its inception, it has grown to more than 180 entries, most of which are executable.
However, the presence of a large number of runnable, published models in ModelDB brought to light a problem that seems obvious in retrospect: even when source code is available, it can be hard to determine exactly what biological properties are represented in a model. Source code is generally hard to read and understand, because model developers tend to have their own individual programming styles, and generally do not place a high priority on presentation when writing code. Furthermore, programs are often organized in such a way that parameters are assigned values at run time that differ from what was specified at the top of the code.
Since most of the entries in ModelDB were written for the NEURON simulation environment (3, 4), we decided to make it easier to deal with the problem of understandability by adding a tool to NEURON that analyzes a model and presents a concise, yet complete, graphical and textual summary of its anatomical and biophysical properties. This tool, which is called ModelView, is part of NEURON’s graphical user interface, and in this paper we describe its main features and present an example of its use by analyzing one of the entries in ModelDB.
2. Materials
The NEURON simulation environment, which runs under OS X, UNIX/Linux, and MSWindows (3). Installers, source code, and documentation are available from http://www.neuron.yale.edu/ (4).
ModelDB (1), whose home page is http://senselab.med.yale.edu/senselab/modeldb/ (2).
To illustrate the features of the ModelView tool, we selected a very complex hippocampal Ca1 pyramidal cell model that was developed by Poirazi et al. for a study of synaptic integration (5). We retrieved this model following instructions provided at ModelDB’s WWW site. For simplicity, we used ModelDB’s “Auto-launch” feature, which downloads the model code and then makes NEURON automatically compile the biophysical mechanisms and execute the model code. This brought up a graphical window that contained three buttons, including one that was labeled “hyperpolarization-current,” which we clicked on to start a simulation that showed how the model is affected by an injected hyperpolarizing current. After the end of this simulation, we clicked on the Init button in NEURON’s RunControl panel to restore the model to its initial condition. At this point, the model cell was ready for analysis.
3. Methods
ModelView in NEURON
Clicking on NEURON Main Menu / Tools / Model View (Fig. 1) brings up a ModelView tool (Fig. 2), which initially shows a top-level summary of the model. In NEURON, a cell is represented by one or more sections, each of which consists of one or more computational nodes called segments (3). The first item in the summary (“183 sections; 331 segments”) shows the total number of sections and segments for all the cells in the model. The second and final items in the summary are the numbers of real and artificial cells, and density mechanisms and point processes; the latter two include ion channels, synaptic receptors, and electrodes (3). The Poirazi model contains one real cell, several density mechanisms, and one point process.
Figure 1.
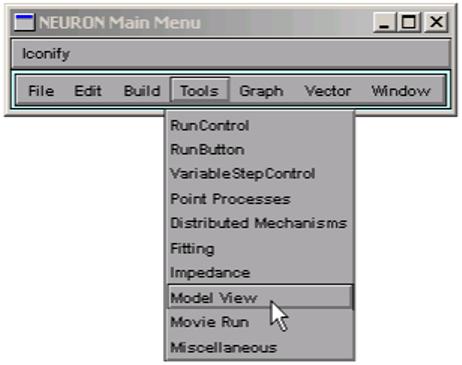
Click on Tools / Model View in the NEURON Main Menu toolbar to bring up a Model View tool.
Figure 2.
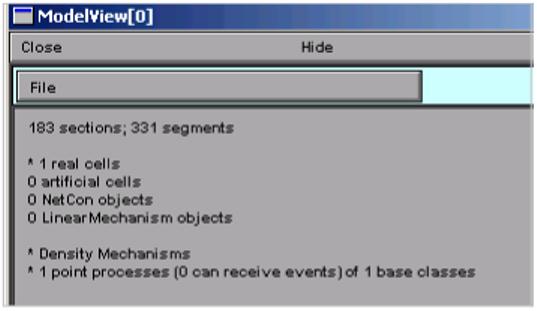
A newly created ModelView tool displays a top-level summary of the model. Note: this and many of the following images are cropped to focus on regions of particular interest.
The main window of the ModelView tool presents a tree-structured, hierarchical textual outline of the properties of a model that can be explored by clicking on any line of text. Clicking on a line that starts with an asterisk will expand or contract the next level of the tree. Clicking on “* 1 real cells”, and then on the newly appeared “* root soma[0]”, brings up a “shape plot” that shows the cell’s anatomical configuration, and expands the outline to display a list that reports how many duplicate and unique parameters that are distributed throughout the cell (Fig. 3). The first three lines of this list are the total number of sections and segments in this particular cell, the related nseg (spatial discretization) parameter distribution, and the number of inserted mechanisms.
Figure 3.
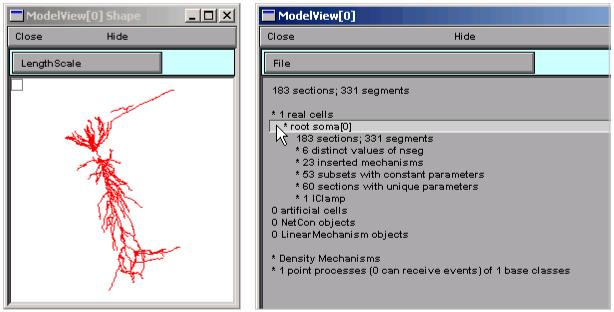
Clicking on “*1 real cells” and then on “* root soma[0]” brings up a shape plot of the model cell (left) and expands the outline.
Expanding “* 23 inserted mechanisms” reveals which ion channels are used in the model (Fig. 4). Clicking on “* cat” expands ModelView’s outline, disclosing that the cat mechanism’s conductance density gcatbar_cat varies over the cell. It also makes the shape plot redraw the cell so that only sections with the cat mechanism are red (Fig. 5). To see exactly how gcatbar_cat varies with location, we just click on “* 36 gcatbar_cat” to expand the outline; this also brings up a “range graph” window with a top panel that uses a color scale to indicate the spatial variation of gcatbar_cat, and a bottom panel that plots gcatbar_cat as a function of path distance in microns from the soma (Fig. 6).
Figure 4.
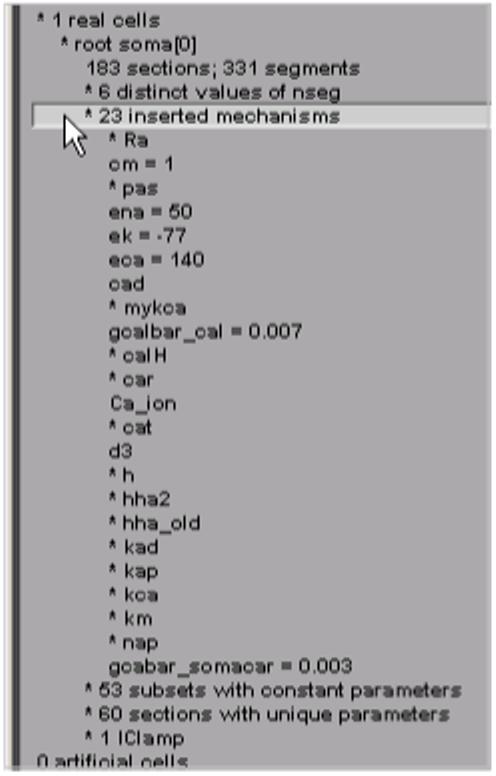
Clicking on “* 23 inserted mechanisms” expands the outline to reveal which ion channels the model uses.
Figure 5.
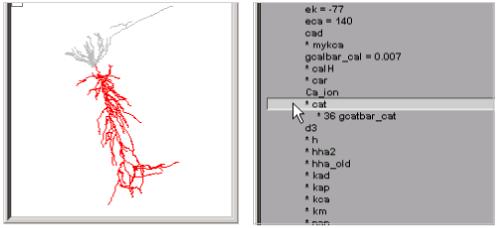
Selecting “* cat” makes the shape plot draw the sections that contain this current in red, and shows that its conductance density is nonuniform.
Figure 6.
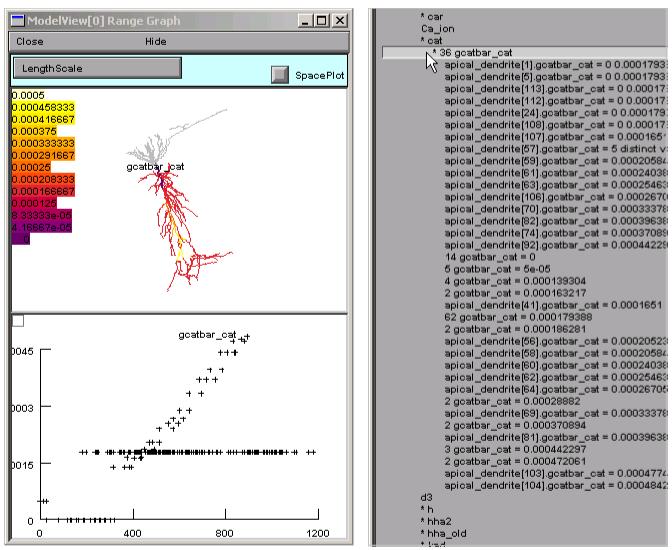
Clicking on “* 36 gcatbar_cat” brings up a range graph (left) which uses a color scale and graph to convey a sense of the spatial distribution of parameter values. Detailed parameter values are provided in ModelView’s expanded outline.
ModelView analyzes the model to find subsets of sections that share a parameter (or a set of parameters) that have the same value(s). In this example, there are 53 subsets with constant parameters (Fig. 3 right). The number of sections that have unique parameter values is also calculated and displayed (60 here). The fact that these numbers are so large indicates that some parameters have heterogeneous values. For a simpler model, the number of subsets with constant parameters, and the number of sections with unique parameters, would help identify the combinations of values that are used and also their spatial distribution. Selecting a parameter from these lists, e.g. eca = 140, highlights the part of the shape plot where the parameter has that value (Fig. 7).
Figure 7.
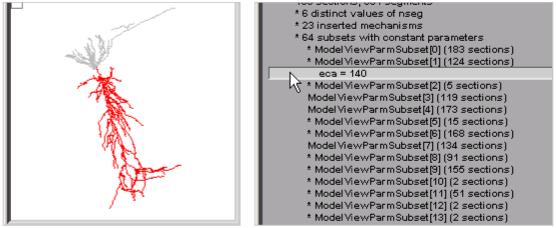
Browsing the list of subsets with constant parameters allows the discovery of sections in which a parameter has a particular value, e.g. “eca = 140” in this case.
The final top-level groups are Density Mechanisms and Point Processes, which expand into text trees and spawn graphs that show the distributions of these items. Homogeneous Parameters (Fig. 8) lists those parameters that occur with just a single value, whereas Heterogenous Parameters lists those that take multiple values. Selecting a homogeneous parameter, such as el_hha2, highlights that part of the shape plot where this parameter exists (Fig. 9). If a heterogeneous parameter is selected, such as gkabar_kad, the range graph shows the overall complexity (Fig. 10), while the ModelView’s text and the shape plot can be used to explore the details of the distribution (Fig. 11)--include the shape plot, which shows a single section in red, when the corresponding line in the text summary is highlighted).
Figure 8.
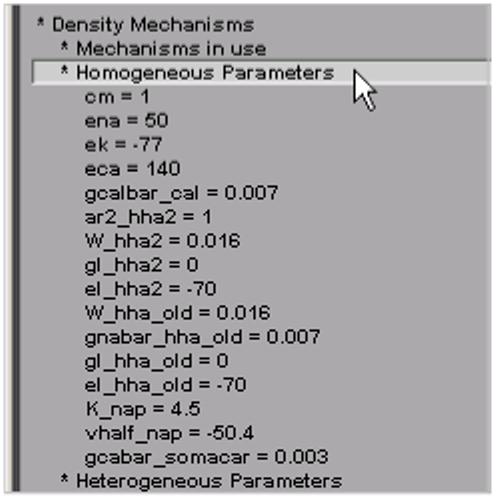
Clicking on “Homogeneous Parameters” shows which parameters have a single value over the entire model cell.
Figure 9.
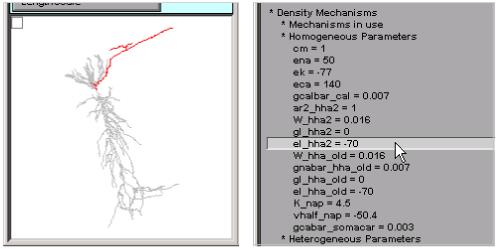
Selecting “el_hha2 = -70” reveals that this parameter (and the hha2 mechanism) is restricted to what looks like axonal branches of the model cell.
Figure 10.
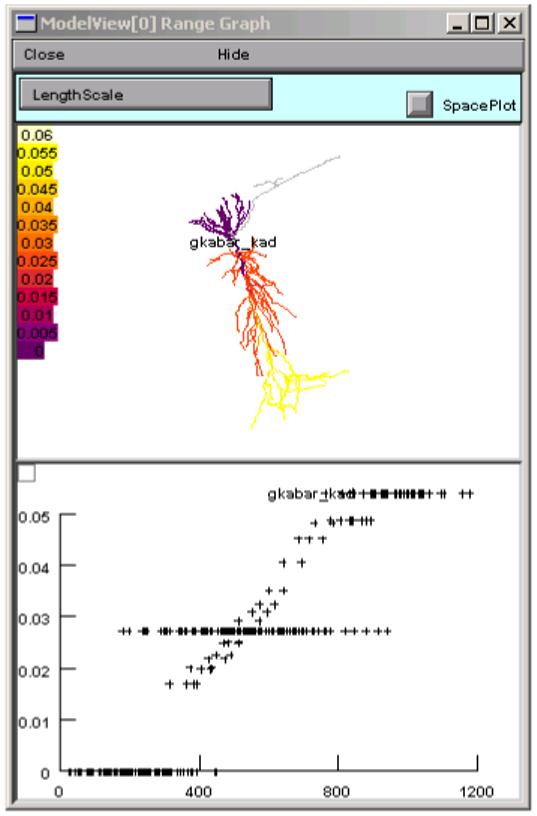
Selecting “* gkabar_kad” from the ModelView’s list of Heterogeneous Parameters brings up a range graph that shows the spatial distribution of this parameter’s values.
Figure 11.
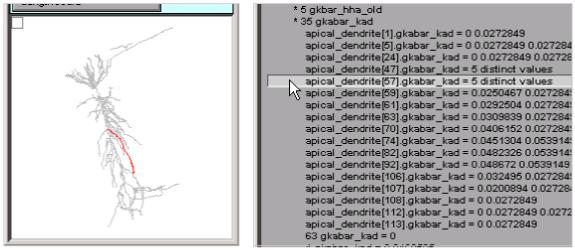
Details of the distribution of inhomogeneous parameters are easily examined by clicking on individual lines in the ModelView tool. This figure shows that apical_dendrite[57] (red branch in shape plot) has 5 different values of gkabar_kad along its length.
The Point Processes group reveals that this model has only one point process: a current clamp. The ModelView browser shows us that this is located at the soma (Fig. 12).
Figure 12.
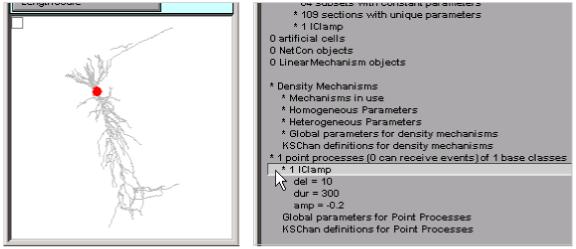
The red dot in the shape plot marks the location of the IClamp.
ModelView in ModelDB
We are developing a ModelView tool that will be incorporated into ModelDB. This will allow investigators to browse the morphology and biophysical specification for NEURON models stored in ModelDB.
ModelView and interoperability: future goals
ModelView can output an XML description of the model’s morphology and biophysical specification. ModelView uses MorphML (6) to describe the morphology of the cell. We are collaborating with the MorphML group to evolve the MorphML specification for interoperability. The biophysical XML specification is under development and we have plans to provide translation tools to previous and developing standards. We will continue to refine the XML output to make it suitable for communication with neuroinformatics tools as well as other modeling software such as Catacomb (7) and GENESIS (8). We will adopt, develop through informal collaboration and communication, and promote NeuroML (9) (whose goal is to establish standard descriptions of computational models that are simulator independent) and BrainML (10) (whose goal is to develop standards in the general description of neuroscience data). We will also attempt to implement the tools required to import and export models with a third specification, CellML (11) (whose purpose is to store and exchange computer-based biological models).
Summary
ModelView is a powerful model exploration tool that quickly and conveniently summarizes and displays information about NEURON models that can be hard to find if one has only the model code to search through. By presenting this information in an intuitive, browseable textual and graphical format that is easily understood, ModelView can help an investigator answer questions about a model that would otherwise have been very tedious to resolve. This tool is capable of further enhancements to match the evolving capabilities of NEURON and needs of computational neuroscientists. For example, we are developing XML interoperability tools that will extend ModelView’s functionality to further aid investigators in understanding models, and which will help translate models to simulator platforms different than the one in which they were originally written.
Acknowledgments
We are grateful for the support from NIH grants NS11613 and 5P01DC004732 (Human Brain Project).
References
- 1.Migliore M, Morse TM, Davison AP, Marenco L, Shepherd GM, Hines ML. ModelDB: making models publicly accessible to support computational neuroscience. Neuroinformatics. 2003;1:131–134. doi: 10.1385/NI:1:1:135. [DOI] [PMC free article] [PubMed] [Google Scholar]
- 2.ModelDB. http://senselab.med.yale.edu/senselab/
- 3.Hines ML, Carnevale NT. NEURON: a tool for neuroscientists. The Neuroscientist. 2001;7:123–135. doi: 10.1177/107385840100700207. [DOI] [PubMed] [Google Scholar]
- 4.NEURON. http://www.neuron.yale.edu/
- 5.Poirazi P, Brannon T, Mel BW. Arithmetic of subthreshold synaptic summation in a model CA1 pyramidal cell. Neuron. 2003;37:977–987. doi: 10.1016/s0896-6273(03)00148-x. [DOI] [PubMed] [Google Scholar]
- 6.MorphML. http:www.morphml.org/
- 7.Catacomb. http://www.enorg.org/
- 8.GENESIS. http://www.genesis-sim.org/GENESIS/
- 9.NeuroML. http://www.neuroml.org/
- 10.BrainML. http://brainml.org/
- 11.CellML. http://www.cellml.org/


