

Abstract
Previous research has identified a population of cells throughout the limbic system that discharge as a function of the animal's head direction (HD). Altering normal motor cues can alter the HD cell responses and disrupt the updating of their preferred firing directions, thus suggesting that motor cues contribute to processing the HD signal. A pathway that conveys motor information may stem from the interpeduncular nucleus (IPN), a brain region that has reciprocal connections with HD cell circuitry. To test this hypothesis, we produced electrolytic or neurotoxic lesions of the IPN and recorded HD cells in the anterior dorsal thalamus (ADN) of rats. Direction-specific firing remained present in the ADN after lesions of the IPN, but measures of HD cell properties showed that cells had reduced peak firing rates, large directional firing ranges, and firing that predicted the animal's future heading more than in intact controls. Furthermore, preferred firing directions were moderately less influenced by rotation of a salient visual landmark. Finally, the preferred directions of cells in lesioned rats exhibited large shifts when the animals foraged for scattered food pellets in a darkened environment and when locomoting from a familiar environment to a novel one. We propose that the IPN contributes motor information about the animal's movements to the HD cell circuitry. Furthermore, these results suggest that the IPN plays a broad role in the discharge properties and stability of direction-specific activity in the HD cell circuit.
Keywords: head direction cells, interpeduncular nucleus, lateral habenula, medial habenula, anterodorsal thalamic nucleus, spatial orientation, rat, navigation
Introduction
A large body of research has identified a class of neurons in the limbic system that discharge as a function of an animal's head direction (HD), independent of location and ongoing behavior (for review, see Sharp et al., 2001a; Wiener and Taube, 2005; Taube, 2007). A single HD cell fires action potentials only when the animal's head is pointed in a single direction, often referred to as the preferred firing direction. The direction in which an HD cell fires maximally can be controlled by visual cues such that rotation of a salient visual landmark can induce a corresponding shift in the preferred firing direction (Taube et al., 1990b; Taube, 1995). However, the preferred direction can be maintained in the absence of visual information and when locomoting into a novel environment, suggesting that internally generated information, such as vestibular, motor efference copy, and proprioceptive cues, are crucial for the stability of directional tuning (Taube and Burton, 1995; Goodridge et al., 1998). HD cells are found most prominently in the postsubiculum (Taube et al., 1990a), anterior dorsal thalamic nucleus (ADN) (Taube, 1995), and the lateral mammillary nuclei (LMN) (Blair et al., 1998; Stackman and Taube, 1998), as well as a number of other interconnected brain regions (Fig. 1). Recent evidence suggests that the origins of the HD signal may reside within the dorsal tegmental nuclei (DTN) and LMN circuitry because both structures are reciprocally connected and both contain neurons whose firing is modulated by angular head velocity and head direction (Groenewegen and Van Dijk 1984; Hayakawa and Zyo, 1984, 1989; Blair et al., 1998; Stackman and Taube, 1998; Bassett and Taube, 2001; Sharp et al., 2001). Furthermore, lesions of either the DTN or LMN abolish direction-specific activity in the ADN (Blair et al., 1999; Bassett et al., 2007). Although it is generally thought that vestibular information enters the HD circuit via a pathway originating in the medial vestibular nucleus→ nucleus prepositus/supragenual nucleus→ DTN (Liu et al., 1984; Brown et al., 2005; Biazoli et al., 2006), it is presently not clear where motor cues might be integrated. One possible candidate is the interpeduncular nucleus (IPN) because of its reciprocal connections with the DTN (Fig. 1) (Contestabile and Flumerfelt, 1981; Liu et al., 1984; Groenewegen et al., 1986) and the finding that it contains neurons sensitive to running speed (Sharp et al., 2006). The IPN receives inputs from both the medial and lateral subdivisions of the habenular nuclei, with the medial habenula sending the strongest projection to the IPN (Contestabile and Flumerfelt, 1981; Groenewegen et al., 1986). The lateral habenula contains a small population of cells whose activity is correlated with the animal's movement speed and angular head velocity (Sharp et al., 2006), and it receives most of its inputs from the entopeduncular nucleus, the rodent homolog of the medial globus pallidus in primates, which is considered a major motor output pathway of the basal ganglia (van der Kooy and Carter, 1981). Thus, given this circuitry, the IPN is in a pivotal position to convey motor information to the DTN for integration into the HD cell circuit.
Figure 1.

Schematic diagram showing the principle connections in the HD cell circuit as well as a proposed model of information flow (Sharp et al., 2001a; Taube and Bassett, 2003). Arrows represent direction of information flow between connected areas. Black arrows represent excitatory connections, whereas the broken line depicts inhibitory connections. The DTN receives inputs from the nucleus prepositus, supragenual nucleus, and the IPN. The nucleus prepositus and supragenual nucleus both receive inputs from the medial vestibular nuclei, whereas the IPN receives inputs predominantly from the medial and lateral habenula. It has been proposed that IPN inputs into the DTN might be a source of motor input (Taube, 2007), which together with the vestibular information relayed from the nucleus prepositus and supragenual nucleus represent multiple idiothetic pathways of information about self-movement projecting into the HD circuit. Previous studies suggest that the projections from the postsubiculum to the ADN and LMN constitute an allothetic pathway in which visual information enters the HD cell system (Goodridge and Taube, 1997). Finally, the connections between the DTN and LMN appear to be central to the generation of HD cell activity. LH, Lateral habenula; MH, medial habenula; MVN, medial vestibular nuclei; NPH, nucleus prepositus; PoS, postsubiculum; SGN, supragenual nucleus.
The present study tested this hypothesis by recording from ADN neurons in rats with lesions of the IPN. After an initial recording session that characterized ADN HD cell properties, we tested whether HD cells in IPN-lesioned animals could be controlled by a salient visual cue. We then tested the cells under two different conditions that determined their ability to process idiothetic cues and update their preferred firing direction without the use of visual landmarks. Here we show that IPN lesions not only disrupt the idiothetic-based control of directional activity in the ADN but also produce mild impairments in visual landmark control. The results suggest a broad role for the IPN in the generation and maintenance of direction-specific activity in the HD cell circuit.
Parts of this work have been published previously in abstract form (Taube et al., 2006).
Materials and Methods
Subjects
Subjects were 27 female Long–Evans rats, weighing 250–300 g at the beginning of testing. Rats were singly housed in Plexiglas cages and maintained on a 12 h light/dark cycle. Water was provided ad libitum, although access to food was restricted as necessary to maintain the animal's body weight in the range of 85–90% of its free-feeding weight. All procedures involving the rats were performed in compliance with institutional standards as set forth by the National Institutes of Health Guide for the Care and Use of Laboratory Animals and the Society for Neuroscience.
Presurgical training
Before all surgical procedures, rats were trained to forage for food pellets scattered on the floor of a gray wooden cylinder (76 cm in diameter; 50 cm high). The floor was composed of gray photographic backdrop paper that could be changed between sessions. The inside of the cylinder was featureless except for a white cue card occupying ∼100° of arc attached to the wall that served as a visual landmark. The cue card was maintained at the same position throughout training. A black floor-to-ceiling curtain enclosure (2.5 m in diameter) surrounded the cylinder, and four uniformly arranged lamps were located above the cylinder to provide illumination. A color video camera (model XC-711; Sony) was centered above the cylinder ∼3 m from the floor surface. Training continued until all animals spent 80–90% of their time in the cylinder foraging for food pellets (5–7 d). The purpose of this task was to encourage the rat to visit all parts of the cylinder and thereby sample different head directions at different locations.
Lesions and electrode implantation
All animals were anesthetized with Nembutal (0.1 ml/100 g body weight) and given atropine sulfate (0.1 ml) to prevent respiratory distress. The animals were then placed in a Kopf stereotaxic instrument (David Kopf Instruments), and an incision was made to expose the skull. Rats receiving IPN lesions (n = 13) first had a small hole drilled into their skull above the IPN. Rats were then given either electrolytic (n = 7) or neurotoxic (n = 6) lesions of the IPN. Electrolytic lesions were produced by first lowering a #0 stainless steel insect pin insulated by epoxylite (except for its 1 mm pointed tip) into four midline sites of the brain. The insect pin was allowed to sit for 2 min before current was passed. At each site, a 1 mA current was passed through the insect-pin electrode for 10 s. The insect pin was then retracted and lowered into the next lesion site. Neurotoxic lesions of the IPN were produced by infusing 0.15 L of a 100 mm solution of NMDA into six midline sites of the brain. The solution was infused at a rate of 0.02 L/min through a 1 L beveled Hamilton syringe. Before infusing the drug, the syringe remained stationary at each injection site for 3 min; this procedure presumably allowed the tissue to settle around the syringe. After each injection, the syringe was left in place for 5 min before being slowly removed. The needle was wiped with water between each injection and helped reduce overlying cortical damage. Electrolytic lesions were produced at four midline sites (in mm): posterior to bregma (P), −5.8 and ventral (V), −8.7; P, −6.2 and V, −8.5; P, −6.6 and V, −9.25; P, −7.0 and V, −9.4. Neurotoxic lesions were produced at six sites, with each site being 2.1 mm lateral to bregma and with the syringe at a 14° angle from the midline in the coronal plane (in mm): P, −5.6 and V, −8.8; P, −6.0 and V, −8.8; P, −6.4 and V, −8.8; P, −6.8 and V, −9.36; P, −7.2 and V, −9.36; P, −7.4 and V, −9.36. Electrolytic and neurotoxic lesion locations were based on coordinates provided by Paxinos and Watson (1998) and modified by previous histological results.
All animals (IPN, n = 13; control, n = 14) received implantation of recording electrodes above the ADN using the following coordinates: 1.5 mm posterior to bregma, 1.3 mm lateral to bregma, and 3.7 mm below the cortical surface (Paxinos and Watson, 1998). Three of the lesioned animals were implanted 2 weeks after the lesions were produced, whereas the remaining animals were implanted immediately after the lesion surgery. Electrodes were constructed and surgically placed using methods similar to those described previously (Kubie, 1984; Taube, 1995). Briefly, each electrode consisted of a bundle of 10 25-μm-diameter nichrome wires that were insulated except at the tip. The wires were threaded through a stainless steel cannula that was moveable in the dorsoventral direction after being fixed to the skull using dental acrylic.
Screening procedures and experimental manipulations
After 7 d of recovery from surgery, electrodes were monitored or “screened” for cellular activity while the animals foraged for food in the training cylinder. To detect cell activity, electrical signals were passed through a field-effect transistor in a source-follower configuration. Signals were amplified by a factor of 10,000–50,000 (Grass Instruments), bandpass filtered (300–10,000 Hz, ≥3 dB/octave), and sent through a dual window discriminator (BAK Electronics) for spike discrimination. The position and directional orientation of the rat was determined by an automated video tracking system (Ebtronics). This video tracking hardware provided x and y coordinates of red and green light-emitting diodes (LEDs) secured 10 cm apart above the head and back of the animal, respectively. The head direction of the animal was determined by the relative position of the red and green LEDs. Screening continued until each of the 10 implanted wires had been examined for HD cells or other cellular activity. Units were classified as HD cells if they fired maximally when the animal was pointing its head in a specific direction (the preferred firing direction) independent of its location in the cylinder and its behavior such as locomotion, grooming, or eating. If no HD cells were detected, the electrode array was advanced 25–50 μm, and the animal was returned to its home cage and monitored again either 4 h later or the next day. If an HD cell was identified, the animal was removed from the cylinder and placed in a cardboard box located outside the curtained area, and the apparatus was then prepared for three different tests (Fig. 2).
Figure 2.

A, Overhead view of the landmark rotation and dark test sessions. Each session, except the dark test, was separated by a period of disorientation treatment. The floor paper was replaced, and the walls were washed to remove lingering olfactory cues. White noise was played from an overhead location during each session to remove potential auditory cues. B, Overhead view of the dual-chamber test sessions. The door to the rectangle was closed during the rectangle session once the rat moved into the rectangle. The door to the cylinder was closed during both cylinder 1 and cylinder 2 sessions.
Landmark rotation test.
The landmark rotation experiment was used to assess whether IPN lesions affected the stability of the HD signal and visual landmark control of HD cell responses. The experiment consisted of three separate 8 min sessions (Fig. 2A). First, a standard session (standard 1) was performed in which HD cell activity was monitored and recorded while the rat foraged for food pellets in the cylinder. This session was followed by a cue-rotation session in which the visual landmark was rotated 90° in either the clockwise (CW) or counterclockwise (CCW) direction. The rotation of the cue always occurred while the animal was in the cardboard box (i.e., out of the animal's view). Finally, the third session consisted of returning the cue card to the original position during the first session (standard 2). Between each testing session, the floor paper was replaced with clean paper and the cylinder walls were wiped down with 80% ethanol and a dry cloth to prevent the animals from using markings on the floor or wall as orientation cues. To mask auditory cues, white noise was played from an overhead speaker hidden on the ceiling. Animals were given disorientation treatments before each recording session by placing the animal in a cardboard box and rotating it slowly (0.2–0.5 Hz) while the experimenter simultaneously walked around the testing room twice. This disorientation treatment has been used in previous studies (Taube, 1995; Goodridge et al., 1998) and was used in this test to prevent the animal from using idiothetic cues to maintain orientation from one session to the next.
Dark test.
An 8 min dark session in the cylinder was used to assess the idiothetic control of HD cells in IPN-lesioned animals. The test consisted of recording HD cell activity with the cue card removed and the room lights turned off (Fig. 2A). Illumination of the head-stage mounted LEDs was reduced to the minimum level needed for accurate tracking of the animal's HD. Before the dark test, the animals were removed from the cylinder and placed in a cardboard box while the floor paper was replaced and the cue card was removed from the cylinder. To start the test, the room lights were turned off and the rat was gently placed in the cylinder and allowed to chase food pellets for 8 min. Similar to previous studies (Goodridge et al., 1998; Golob and Taube, 1999), animals were not disoriented before being placed in the cylinder for dark testing. After the 8 min dark test was complete, animals were removed from the cylinder and a final 8 min standard session (standard 3) was conducted in which the room lights were turned back on, the floor paper replaced, and the cue card returned to its original position. Rats were given a disorientation treatment before being placed in the cylinder for standard 3. White noise was played from a speaker on the ceiling during every test session to obscure potential auditory cues.
Dual-chamber test.
The dual-chamber apparatus involves the animal self-locomoting into a novel enclosure (Taube and Burton, 1995). Figure 2B illustrates an overhead view of the dual-chamber apparatus, which is composed of two gray-colored compartments, a cylinder similar to that described above (76 cm in diameter) and a rectangle (51 × 69 cm) interconnected by a narrow U-shaped passageway (41 × 15 cm). The walls along one side of the alleyway were slanted by ∼15° for the overhead video camera to view all areas of the passageway. A section of wall in each enclosure could be removed to control access between the two sections and the passageway. The walls of the rectangle were featureless except for a white cue card positioned along the wall such that it was rotated 90° CCW with respect to the cue card in the cylindrical compartment. The floors of the cylinder and rectangle were composed of gray photographic backdrop paper that could be changed between sessions and animals. The passageway contained a gray-painted wooden floor. The cylinder enclosure in the dual-chamber apparatus was similar to the cylinder the rats had been trained and screened in for several weeks, and, for that reason, the cylinder was considered a familiar environment to the animals. The passageway and the rectangle represented a novel environment because the animals had no previous exposure to them. HD cells in control animals typically maintain a similar preferred direction between both compartments of the dual-chamber apparatus (Taube and Burton, 1995; Stackman et al., 2003; Calton et al., 2008), and it is has been shown that motor/proprioceptive cues available during the animal's journey from the cylinder to the rectangle are crucial for maintaining a stable preferred direction.
The procedure for the dual-chamber apparatus experiment consisted of three phases. First, the animal was placed in the cylindrical compartment of the apparatus with the door to the passageway closed (“cylinder 1 session”). After allowing the animal to forage for food pellets scattered on the floor of the cylinder for 4 min, the cylinder compartment door was opened and the animal was free to walk into the passageway and enter the rectangle. On entering the rectangle, the hidden door was closed, trapping the animal inside the rectangle environment while the activity of the HD cell was monitored for 12 min (“rectangle session”). After the rectangle session, the door to the rectangular compartment was opened and the rats were allowed to locomote back through the passageway to the cylinder, where they were again trapped while HD cell activity was monitored for another 4 min (“cylinder 2 session”). The dual-chamber apparatus experiment was conducted only once per animal because the task requires the rectangular compartment to be novel. Thus, only one HD cell recording session was collected per animal in this task.
Data analysis
An automated video-computer tracking system, sampling at 60 Hz, recorded the number of spikes occurring during each sample period while simultaneously recording the x, y positions of each LED. Data analysis was accomplished offline using custom software (LabView; National Instruments). The animal's HD was sorted into sixty 6° bins. Basic directional characteristics of the recorded cells were determined by examining cellular activity during the standard cylinder 1 session. Cells from lesioned and control animals were compared on measures of peak firing rate, background firing rate, directional firing range, directional information content, and anticipatory time interval (Blair and Sharp, 1995; Taube, 1995; Taube and Muller, 1998). The preferred direction was defined as the directional bin with the highest average firing rate. The peak firing rate was the average firing rate corresponding to the preferred direction. The background firing rate was the average firing rate of all other bins outside the directional firing range. The directional firing range was defined as the width at the base of a triangle fit to a firing rate versus HD plot. Directional information content is a measure of how many bits of head direction information is conveyed by each spike (Skaggs et al., 1993) and was calculated by the following formula: directional information content = Σ pi (λi/λ) log2 (λi/λ), where pi is the probability that the head pointed in the ith directional bin, λi is the mean firing rate for bin i, and λ is the mean firing rate across all directional bins.
The anticipatory time interval (ATI) is a measure of the amount of time that cell firing best predicts where the animal will be pointing its head in the future. Previous work has estimated that the activity of ADN HD cells reflect head directions ∼25 ms into the future better than current head directions (Blair and Sharp, 1995; Taube and Muller, 1998). Both sensory and motor inputs into the HD network have been postulated as a mechanism for this anticipatory activity (Blair and Sharp, 1995; Blair et al., 1997; Taube and Muller, 1998; Bassett et al., 2005; van der Meer et al., 2007). In fact, previous work has shown that the removal of motor inputs can alter ATIs of HD cells in the ADN (Bassett et al., 2005). Thus, because motor-related signals have been found in the IPN (Sharp et al., 2006), it is possible that the IPN may play a role in this phenomenon. To address this possibility, we compared the ATI of standard 1 sessions in cells from control and IPN-lesioned animals using the methods of Blair and Sharp (1995). First, HD cell tuning functions were calculated by constructing firing rate versus HD plots by first dividing the 360° directional range into 60 6° bins and then calculating the average firing rate for each bin. Tuning functions were constructed for CW and CCW directions, and the difference between the preferred firing directions for the two functions (i.e., separation angle) was determined. The spike record was then shifted forward and backward in time in steps of 16.67 ms (the maximum temporal resolution of the recording hardware) and the separation angle between the CW and CCW functions for head movements ≥90°/s computed for each shift. The spike series was shifted incrementally ±6 times (±100 ms) relative to the HD series, providing 13 values of CW–CCW separation angles. A scatter gram was then constructed from the 13 CW–CCW separation angles and their corresponding time shift. The x intercept of the best-fit line of this plot is referred to as the ATI and is equivalent to the amount of time that the spike series has to be shifted to achieve overlapping CW and CCW functions.
Circular statistics (Batschelet, 1981) were used to determine the stability of the preferred firing direction between the three dual-chamber apparatus sessions and the landmark rotation and dark testing sessions. Angular shift scores across testing sessions were calculated using a cross-correlation method (Taube, 1995). This approach involves shifting the firing rate versus HD function of the first session in 6° increments while correlating this shifted function with the nonshifted function from the other session. The amount of shift required to produce the maximal Pearson's r correlation between the two sessions is defined as the angular shift score between the sessions. These values were then subjected to Rayleigh tests (Batschelet, 1981) to determine whether the scores were clustered randomly or whether the preferred directions tended to shift in the same direction and amount. The Rayleigh test computes a mean vector length (r) for the distribution of angular shift values. This r value represents the variability in the shift angles for the group, with values of 1.0 indicating an absence of variability. ANOVAs and independent sample t tests were used for group comparisons of the absolute angular shift scores produced during landmark rotation, dark, and dual-chamber sessions. We also performed an F test on the concentration parameter of the directional shifts between the cylinder and novel enclosure for the dual-chamber task to determine whether there was a difference in the variance between groups (Batschelet, 1981). This test examines whether shifts in the preferred firing direction are similarly concentrated around the mean value between groups (Batschelet, 1981) (this measure is comparable to angular variance in normal statistical analyses), an expected finding if lesioned animals have the same degree of orientation between the two enclosures of the dual-chamber task.
For all experimental comparisons, HD cells collected from IPN-lesioned animals were compared with control data compiled from 11 unlesioned animals in the present study. To supplement our control data for analyzing the dual-chamber apparatus and landmark rotation tests, we randomly selected 29 HD cells from control animals collected in previously published studies using identical procedures and equipment (Taube, 1995; Calton et al., 2008). There were no differences between the control data obtained in the present study and the control data from the previous studies.
Histological analysis
At the completion of the experiment, animals were deeply anesthetized with sodium pentobarbital, and a small anodal current (20 μA, 10 s) was passed through two to four electrode wires to later conduct a Prussian blue reaction. The rats were then perfused intracardially with saline, followed by a 10% Formalin solution. Each brain was removed from the skull and was postfixed in a 10% Formalin solution containing 2% potassium ferrocyanide for at least 24 h. The brains were then cryoprotected in a 20% sucrose solution for 24 h and were then frozen and cut coronally at 30 μm sections with a cryostat. Every section through the ADN was collected, and every third section was collected through the IPN. Sections were mounted on glass microscope slides, stained with thionin, and examined under light microscopy to determine the location of recording sites and evaluate the lesions. To quantify the extent of electrolytic and neurotoxic damage to the IPN, digital images were captured at three rostrocaudal levels (5.8, 6.3, and 6.8 mm posterior to bregma) provided by Paxinos and Watson (1998). The area of undamaged tissue in the IPN was calculated at each rostrocaudal level using NIH ImageJ software (http://rsb.info.nih.gov/ij/index.html). Tissue was considered undamaged if it contained healthy neurons and few glial cells. Once the area of undamaged tissue was calculated, the area of spared tissue was summed across the three sections and compared with the average area measured in control rats. The total amount of damage was calculated using the following formula: tissue damaged = [average area of IPN in control rats (pixels2) − total area of spared IPN tissue in lesioned rats (pixels2)/average area of IPN in control rats (pixels2)] × 100%.
Results
Histology
Figures 3 and 4 show representative coronal sections of controls (Fig. 3B), IPN-neurotoxic lesioned rats (Fig. 3C), and IPN-electrolytic lesioned rats (Fig. 4) at select plates from Paxinos and Watson (1998). The overall amount of damage to the IPN varied from 78 to 100%. Eleven animals (n = 6 electrolytic lesions, n = 5 neurotoxic lesions) sustained a 90–100% complete lesion of the IPN, whereas one electrolytic lesioned animal and one neurotoxic lesioned rat had 81 and 78% damage, respectively. Because the anatomical evidence indicates that the DTN has reciprocal connections most prominently with the rostral subnuclei of the IPN (Hemmendinger and Moore, 1984; Liu et al., 1984; Groenewegen et al., 1986), it was particularly important that these rostral portions were completely lesioned. In the present study, all 13 rats had 90–100% complete lesions of the rostral IPN. For many animals (n = 5), sparing of tissue was localized in the most caudal subnuclei of the IPN approximately at the level of −6.8 to −7.2 mm relative to bregma. Because there were no differences in the behavior and cellular activity of rats with damage throughout the rostrocaudal extent and those with lesions localized to the rostral IPN, all animals were pooled into one group.
Figure 3.
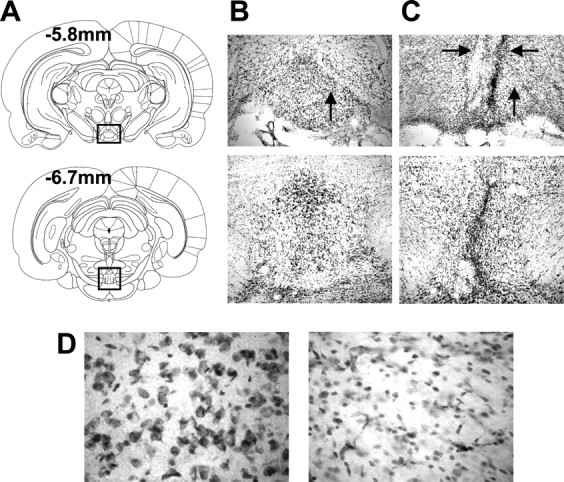
A, Selected plates from Paxinos and Watson (1998) showing the rostrocaudal extent of the IPN at relative coordinates from bregma. B, An enlarged view of the boxed area in A depicting representative sections from a control rat. C, Representative sections from a rat with neurotoxic lesions of the IPN. Note the glial scar that passes through the IPN. The horizontal black arrows point to damage extending into structures dorsal to the IPN (paranigral nucleus and interfascicular nucleus). D, Sections from a representative control (left) and IPN-lesioned (right) rat at the location indicated by the vertical black arrows in B and C. Note the absence of neurons and the greater number of glial cells in the section from the IPN-lesioned rat.
Figure 4.
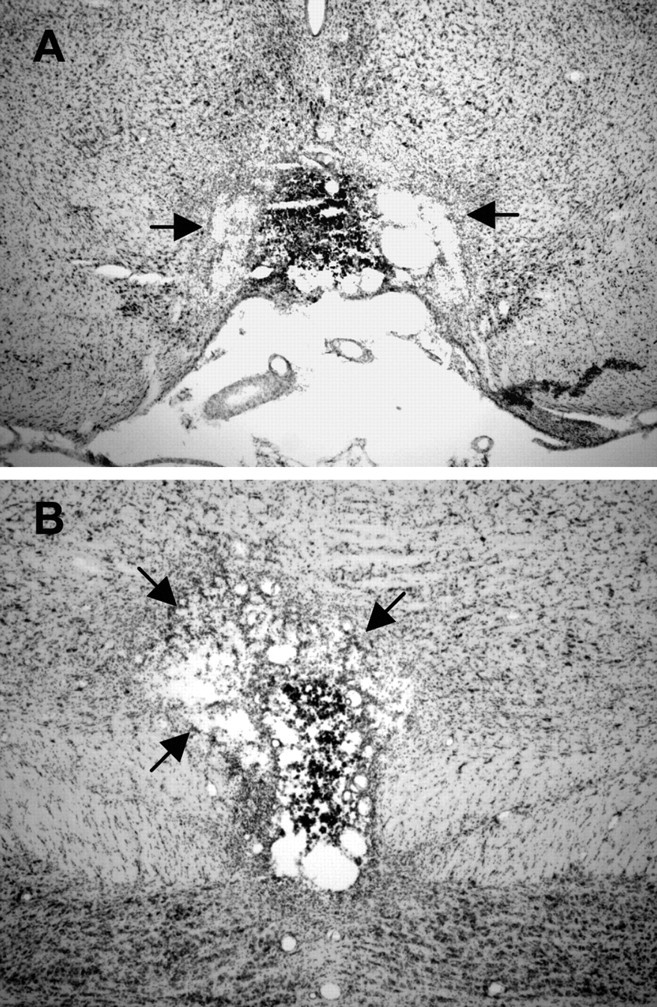
A, Representative section at −5.8 mm relative to bregma for a rat with a complete electrolytic lesion of the IPN. The black arrows show damage that extends bilaterally beyond the borders of the IPN into the paranigral nucleus. B, Representative section at −6.7 mm relative to bregma from the same electrolytic lesioned rat in A. Notice that, at this level, the lesion is complete but extends unilaterally into the ventral tegmental area.
Lesions typically extended into lateral and dorsal structures, including the paranigral nucleus, interfascicular nucleus, caudal linear nucleus of the raphe, and the ventral tegmental area (Figs. 3, 4). In 6 of the 13 cases, damage to these adjacent structures were incomplete and unilateral (<40%). Lesions to these areas were unavoidable because of their close proximity to the IPN. However, given that none of these areas are known to project directly to the DTN, or to any other brain regions intimately related to the HD cell circuit, it is unlikely that the damage sustained to these adjacent structures contributed to our experimental results. Six IPN-lesioned animals had minor unilateral damage (<30%) to the overlying parietal cortex. In four of these cases, the damage extended into the lateral border of the dysgranular retrosplenial cortex (<20%). Extensive lesions of the parietal cortex have been shown to impair some forms of navigation in spatial tasks (Save et al., 2001; Parron and Save, 2004) but have not been shown to disrupt HD cell generation or stability in the dual-chamber apparatus, dark tests, or landmark rotation tests (Calton et al., 2008). The retrosplenial cortex has been shown to have an important role in navigational abilities in rats and, when extensively lesioned, can impair navigational accuracy in several spatial tasks (Aggleton and Vann, 2004; Harker and Whishaw, 2004). Because very large lesions of the retrosplenial cortex are required to obtain these deficits (Vann and Aggleton, 2004), it is unlikely that the <20% damage in the two IPN-lesioned animals contributed to our results. In addition, a recent study (Clark and Taube, 2009) described four cases in which similar parietal and retrosplenial cortical damage was induced in rats without lesioning the IPN and found that the animals were unimpaired in IPN-dependent spatial tasks, such as a table-top homing task and the hidden platform version of the Morris water maze (Morris et al., 1982; Frohardt et al., 2006). In light of these considerations, we argue that lesions specific to the IPN were the most likely cause of our experimental findings.
Neural activity overview
The electrode arrays were judged to have advanced through the ADN in all 27 animals (data not shown). A total of 128 cells were isolated within the sampling range of the ADN from the 13 IPN-lesioned animals. Of these cells, 54 were identified as HD cells, three cells were classified as theta modulated, and 71 cells had nondeterminable correlates. A cell was classified as a theta cell if it fired rhythmically in the theta frequency range (5–12 Hz) when its firing pattern was observed at a slow sweep speed (10 divisions/s) on an oscilloscope or listened to through an audio amplifier. Moreover, we identified whether its activity was correlated with periods of locomotor activity, a well documented behavioral correlate of theta rhythmic activity (Vanderwolf, 1969). Three control rats were removed from the general activity overview because of poor histology. For the remaining 11 control rats, a total of 93 cells were isolated within the sampling range of the ADN. Forty of these cells were identified as HD cells, five cells were classified as theta modulated, and 48 cells had nondeterminable correlates. An ANOVA conducted on the percentage of cells that had HD correlates in IPN-lesioned animals (electrolytic lesions, 39.0 ± 7.04%; neurotoxic lesions, 46.6 ± 7.60%) did not differ significantly from the percentage of HD cells found in control animals (46.2 ± 5.61%; F(2,21) = 0.386; p = 0.684). The incidence rate of HD cells (percentage of HD cells in the ADN) in intact animals is similar to previous reports (Taube, 1995; Bassett et al., 2007). Table 1 shows the incidence rates for HD cells in lesioned and unlesioned animals.
Table 1.
Incidence of HD cell versus non-HD cells in lesioned and control rats
| Control (n = 11) |
Electrolytic IPN lesion (n = 7) |
Neurotoxic IPN lesion (n = 6) |
||||||
|---|---|---|---|---|---|---|---|---|
| HD cells/rat | Non-HD cells/rat | Lesion | HD cells/rat | Non-HD cells/rat | Lesion | HD cells/rat | Non-HD cells/rat | |
| 3 | 2 | 81% | 8 | 15 | 99% | 4 | 9 | |
| 5 | 8 | 90% | 2 | 6 | 100% | 1 | 2 | |
| 2 | 3 | 93% | 1 | 5 | 92% | 6 | 3 | |
| 8 | 7 | 98% | 1 | 5 | 100% | 8 | 2 | |
| 4 | 2 | 100% | 3 | 3 | 78% | 4 | 8 | |
| 2 | 3 | 100% | 3 | 2 | 94% | 6 | 11 | |
| 2 | 5 | 100% | 7 | 3 | ||||
| 2 | 4 | |||||||
| 4 | 2 | |||||||
| 5 | 15 | |||||||
| 3 | 2 | |||||||
| Total | 40 | 53 | 25 | 39 | 29 | 35 | ||
| Total per group | 93 | 64 | 64 | |||||
Basic directional characteristics
Forty of 54 HD cells from IPN-lesioned animals and 36 of 40 HD cells from control rats were considered to be well isolated from background noise during the standard cylinder 1 session and were used in the following analyses. Because the basic directional characteristics of cells recorded from electrolytic (n = 13) and neurotoxic (n = 27) lesioned animals were not significantly different (t(38) = 1.55, −0.985, 1.74, 0.218, −1.73, for peak firing rate, background firing rate, directional information content, directional firing range, and ATI, respectively; all p values > 0.05), we pooled the HD cells from both lesion groups into one group. Table 2 shows the mean and SE for peak firing rate, background firing rate, directional information content, directional firing range, and ATI for HD cells recorded in lesioned and control animals. As shown in the table, there were no obvious differences between lesioned animals and controls on measures of background firing rate and directional information content. This was confirmed by nonsignificant independent sample t tests for the two measures (t(74) = 1.22 and −0.069 for background firing rate and directional information content, respectively; p > 0.05). IPN lesions did, however, significantly reduce the mean peak firing rate of HD cells by 21% relative to controls (t(74) = 2.0; p = 0.049). Interestingly, previous work has shown that the removal of normal motor cues by passively rotating the animals through the preferred directions of the cells have generally shown that the firing rate of HD cells is markedly attenuated and, in many cases, completely abolished (Taube et al., 1990b; Knierim et al., 1995; Taube, 1995). Because these studies used a restraint protocol in which an animal is tightly wrapped in a towel, it was possible that the reduction in firing rate may have resulted from several potential confounds, including stress and body pressure. To avoid these confounds, Zugaro et al. (2001) substantially reduced motor cues instead by passively moving the animal on a wheeled cart and demonstrating that HD cells reduced their peak firing rate by as much as 27%. Our findings are consistent with the results of this latter study, suggesting that the IPN may be involved in setting the gain of the directional signal in the ADN, possibly through the network of movement-sensitive neurons found throughout the IPN (Sharp et al., 2006).
Table 2.
ADN HD cell parameters in IPN-lesioned and control animals
| Parameter | Control | IPN lesioned |
|---|---|---|
| Peak firing rate (spikes/s) | 44.4 ± 3.42 | 35.3 + 3.02* |
| Background firing rate (spikes/s) | 1.62 ± 0.223 | 1.27 + 0.186 |
| Directional information content (bits/spike) | 1.28 ± 0.102 | 1.27 + 0.087 |
| Directional firing range (°) | 101.8 ± 4.45 | 122.2 + 4.87** |
| ATI (ms) | 32.4 ± 6.96 | 64.7 + 8.32** |
*p < 0.05;
**p < 0.01.
Additional analysis revealed that animals with IPN lesions had wider directional firing ranges than control rats (t(74) = −3.08; p = 0.003). The larger directional firing range in IPN-lesioned rats could arise from drift in the preferred firing direction of the cell during the standard 1 session. Moreover, a drift in the preferred firing direction could have contributed to the reduced peak firing rates described above. To address this issue, we compared the absolute angular shift in the preferred firing direction between the first and last 2 min of the standard 1 session for control and lesioned animals. This analysis failed to reveal a statistically significant difference between the populations (t(74) = 1.41; p > 0.05). Thus, because the preferred directions are similar between the first and last 2 min of the standard session, it is unlikely that drift in the preferred directions contributed to the wider directional firing ranges found in IPN-lesioned animals.
Five HD cells from the IPN lesion group and three HD cells from the control group were removed from the ATI analysis because of contamination by a second cell (this contamination did not alter the firing properties described above). Figure 5 shows a histogram of the ATI values of HD cells from both groups of animals. Note that the ATI values from IPN-lesioned animals generally fell on the right side of the histogram, whereas the ATI values from control animals fell on the left side. The ATI analysis revealed that animals with IPN lesions had HD cells that anticipated the animals future head position by a significantly greater amount than control rats (t(66) = −2.96; p = 0.004). Indeed, the ATI values of IPN-lesioned animals (64.7 ms) more than doubled that of the control animals (32.4 ms), a result that is similar to previous reports in which HD cells were recorded while animals were passively moved through their preferred firing direction, thereby removing normal motor cues (Bassett et al., 2005, their Table 1). The increase in ATI values is consistent with two other lesions studies: after bilateral lesions of the postsubiculum (Goodridge and Taube, 1997) and after unilateral lesions of the LMN (Blair et al., 1999). In each case, lesions of the postsubiculum or LMN led to greater anticipation from recordings in the rat ADN. In the case of the postsubiculum lesions, HD cell anticipation doubled that of controls, a result that mirrors our results. Nonetheless, the greater anticipation observed in the present study may be attributable to the larger firing range of HD cells in IPN-lesioned rats, because previous studies have shown that directional firing range values are positively correlated with ATI values (Blair et al., 1997; Goodridge and Taube, 1997; Taube and Muller, 1998).
Figure 5.

Histogram showing the ATI values (milliseconds) for HD cells recorded in the control (open bars) and IPN-lesioned (filled bars) groups. Notice that the many of the HD cells from lesioned rats have greater ATI values than those recorded in control animals.
Landmark rotation test
A total of 29 HD cells from IPN-lesioned animals and 33 HD cells from control rats were recorded in the landmark rotation test. Twenty-two of the 33 control cells were drawn from a previous study using identical procedures (Taube, 1995; Calton et al., 2008). Because the results obtained from landmark rotation testing did not differ between the two control groups, we pooled the data for statistical comparisons with the lesioned animals. Moreover, the results of landmark rotation testing did not indicate differences between the neurotoxic (n = 19) and electrolytic (n = 10) lesion groups (t(27) = 0.305 and −0.763 for landmark rotation and returns, respectively; p values > 0.05); thus, for simplicity, we pooled the data for these animals. Figure 6A presents polar plots of the angular shift between the standard 1 and rotation sessions, and Figure 6B presents the shift between standard 1 and standard 2 sessions for each cell in control and IPN-lesioned groups. The plots in Figure 6A show that cells from control animals (left panel) demonstrate reliable shifts of the preferred direction in the expected direction and amount as the cue card, whereas HD cells recorded from IPN-lesioned animals (right panel) fail to show similar reliable shifts. On average, HD cells from IPN-lesioned animals had greater absolute deviations from the expected 90° (mean absolute deviation from expected, 65.2 ± 13.0°) compared with cells recorded in control animals (mean absolute deviation from expected, 11.1 ± 1.79°). This difference in mean absolute deviation was significantly different (t(60) = 4.38; p < 0.001), however, a Rayleigh test revealed that both groups had significantly nonrandom distributions (IPN lesion: mean vector lengths, (r) = 0.452, p = 0.0015; control: r = 0.969, p < 0.001).
Figure 6.

A, Polar plots showing the angular shift in the preferred firing direction between the standard 1 and rotation sessions for control (left) and IPN-lesioned (right) rats. Each dot on the periphery represents the magnitude of the shift in the preferred firing direction for one HD cell. For the control group, the gray circles represent the shift values for animals included in the present study, and the black circles represent shift values from previous studies. For the IPN-lesioned group, the white circles represent the shift values for electrolytic lesioned animals, and the black circles represent the shift values from neurotoxic lesioned rats. The black arrow denotes the observed mean vector angle, and the broken line denotes the expected 90° vector if the angular shift values are perfectly predicted by the cue card. Mean vector length values (r) are indicated within the plot and are depicted by the length of the solid arrow. The length of r represents the variability in the shift angles for the group, with values of 1.0 indicating an absence of variability. Asterisks mark r values that tested significantly nonrandom as indicated by the Rayleigh test (**p < 0.01; ***p < 0.001). For both groups, most cells exhibited a change in the preferred firing direction after the cue card rotation. Note that, although the variability in the shifts is much greater in IPN-lesioned rats, the shifts were distributed nonrandomly for both groups. B, Polar plots showing the angular shift in the preferred firing direction between the standard 1 and standard 2 sessions for control (left) and IPN-lesioned (right) rats. The 0° point indicates the expected vector if the shift values are perfectly predicted by the cue card rotation. Again, the shifts for IPN-lesioned rats are more variable but are distributed nonrandomly.
The nonrandomness of the distribution of angular shifts for IPN-lesioned animals may stem from the fact that the preferred firing directions shifted in the expected direction (23 times) more frequently than the unexpected direction (six times). This result indicates that the cue card had some control over the preferred firing directions. One possibility is that the control exerted by the visual landmark may have improved after repeated exposure to the cylinder/cue card during screening and recording sessions. To investigate this possibility, we calculated the total number of screening/recording sessions that each animal experienced before recording an HD cell in the landmark rotation test and correlated these values with the absolute angular deviation from the expected 90°. We predicted that, if the cue card gradually gained control of the preferred firing direction as the lesioned animal had more exposure to the cylinder/cue card, we would find a negative correlation between the number of sessions and the absolute angular deviation scores. Although a trend toward a negative relationship was observed between the number of sessions and absolute shift scores (r = −0.16), this relationship failed to reach significance (p > 0.05). This result suggests that the small amount of cue control observed in IPN-lesioned animals is unlikely to stem from repeated exposure to the cylinder and cue card.
Because of poor isolation during the standard 2 session, three HD cells from IPN-lesioned animals and five HD cells from intact animals were not recorded during the subsequent standard 2 sessions. The plots in Figure 6B show the angular shift scores between the standard 1 and standard 2 sessions. The right plot indicates that the preferred firing directions of HD cells in IPN-lesioned animals did not always return to the standard 1 orientation. An independent sample t test confirms this observation by showing that IPN-lesioned rats had much greater absolute shift values between standard 1 and standard 2 sessions (43.4 ± 9.73°) than those obtained from control rats (7.07 ± 1.31°; t(52) = 3.84; p < 0.001). Nonetheless, a Rayleigh analysis revealed that both groups had nonrandom distributions (IPN lesion, r = 0.598, p < 0.001; control, r = 0.986, p < 0.001), showing again that the cue card has some control over the preferred firing directions in lesioned rats.
The top panel of Figure 7 presents a representative HD cell recorded in an intact animal in which the preferred firing direction shifted in the correct direction and amount when the cue card was rotated 90° CCW. The bottom panel of Figure 7 shows an example of a cell recorded in an IPN-lesioned rat in which the preferred firing direction shifted in the opposite direction after a 90° CCW cue card rotation. However, when the cue card was returned, the preferred direction shifted back to its original orientation.
Figure 7.

Responses of HD cells from representative control (top) and IPN-lesioned (bottom) rats during the landmark rotation sessions. The dash–dot lines indicate the standard 1 sessions, the solid lines indicate the standard 2 sessions, and the dashed lines represent the rotation session. For both animals, the cue card was rotated 90° CCW. Note that the preferred firing direction of the cell from the control animal shifted in the correct direction and amount. In contrast, the preferred firing direction of the cell recorded in the IPN-lesioned rat shifted in the wrong direction (CW) during the rotation session but followed the cue card back to its original angular location during the standard 2 session.
On a final note, although there were no significant differences in the mean deviation from expected scores between electrolytic and neurotoxic lesioned animals, there were some qualitative differences between the groups. Specifically, electrolytic lesioned animals had more cells that displayed preferred directions that under-rotated or shifted in the opposite direction in response to cue rotations. In contrast, many more cells from neurotoxic lesioned rats over-rotated in response to cue card rotations. We evaluated whether this difference was significant using a Pearson's χ2 and found that the type of lesion was significantly associated with whether or not the preferred directions of HD cells over-rotated (χ2(1) = 8.6; p = 0.003). It is unclear why HD cells in electrolytic and neurotoxic lesioned rats would show different responses in this testing condition, although it is possible that this result is attributable to chance because there were fewer cells recorded from electrolytic lesioned animals (10 vs 19 in neurotoxic animals) and because there were no significant or qualitative differences between the lesion groups when the cue card was returned to the standard location. Alternatively, it is possible that this difference is the result of damaged fibers of passage after electrolytic lesions but not in neurotoxic lesioned rats. One possible fiber tract that may have been damaged is the mammillotegmental tract, which is located dorsal to the IPN at its most rostral extent (Hayakawa and Zyo, 1989). The mammillotegmental tract contains axons connecting the LMN and DTN, both of which are essential for normal HD cell activity in the ADN (Blair et al., 1999; Bassett et al., 2007). However, it is unclear why damage to this tract would result in differences in the landmark rotation test but no significant differences in the cells firing properties or their response to other cue manipulations (see below).
Together, the results of the cue rotation sessions demonstrate that the cue card was less capable of exerting control over the preferred firing direction of ADN HD cells in IPN-lesioned animals. Nonetheless, the significantly nonrandom distributions when the cue card was rotated suggest that some cue control was still present. The loss of cue card control over HD cells in IPN-lesioned animals is milder than in studies in which rats were given neurotoxic lesions of the postsubiculum (Goodridge and Taube, 1997). For instance, cells in postsubiculum-lesioned animals rotated in the expected direction less frequently (27 of 61 sessions, 44%) than the cells reported for IPN-lesioned animals (23 of 29 sessions, 79%). Furthermore, Goodridge and Taube (1997) reported higher mean absolute shift values for postsubiculum-lesioned animals in the cue rotation sessions (standard 1 to rotation, 76.4 ± 11.7°; standard 1 to standard 2, 65.6 ± 10.6°) compared with the means reported in the present study for IPN-lesioned rats (standard 1 to rotation, 65.2 ± 13.0°; standard 1 to standard 2, 48.4 ± 9.73°).
Dark test
We recorded 25 HD cells from IPN-lesioned animals and 17 cells from control rats in the cylindrical enclosure with the cue card removed and the room lights turned off. Three HD cells from IPN-lesioned rats and one cell from the control group were not recorded in the third standard session because of poor isolation. Because there were no significant differences in the amount of drift in the dark tests between neurotoxic (n = 18) and electrolytic (n = 7) lesion groups (F(1,66) = 0.767; p > 0.05), we pooled the data for statistical comparisons with intact animals. Figure 8 shows the directional correlates of an HD cell from a control (top panel) and IPN-lesioned (bottom panel) animal during the standard 2, dark test, and standard 3 sessions. Each circle in the plot represents the animal's HD and time (resolution = of a second) in which a recorded HD cell fired at a rate ≥50% of its peak firing rate (obtained from the overall firing rate vs HD plot). With open circles representing the standard 2 (0–8 min) and standard 3 (16–24 min) sessions and the filled circles indicating the dark test (8–16 min), the stability of the preferred firing directions of HD cells can be monitored across sequential sessions. This figure clearly illustrates that the control animal displays stable activity clustered within a narrow range of directions across the three sessions, a result consistent with previous reports showing that HD cells can maintain their preferred directions in the dark for brief periods of time (Goodridge et al., 1998; Knierim et al., 1998; Golob and Taube, 1999; Calton et al., 2008). In contrast, although the IPN-lesioned animal shows stable directional activity during the standard 2 and standard 3 sessions, the preferred firing direction of the cell drifts significantly across the 8 min dark session.
Figure 8.
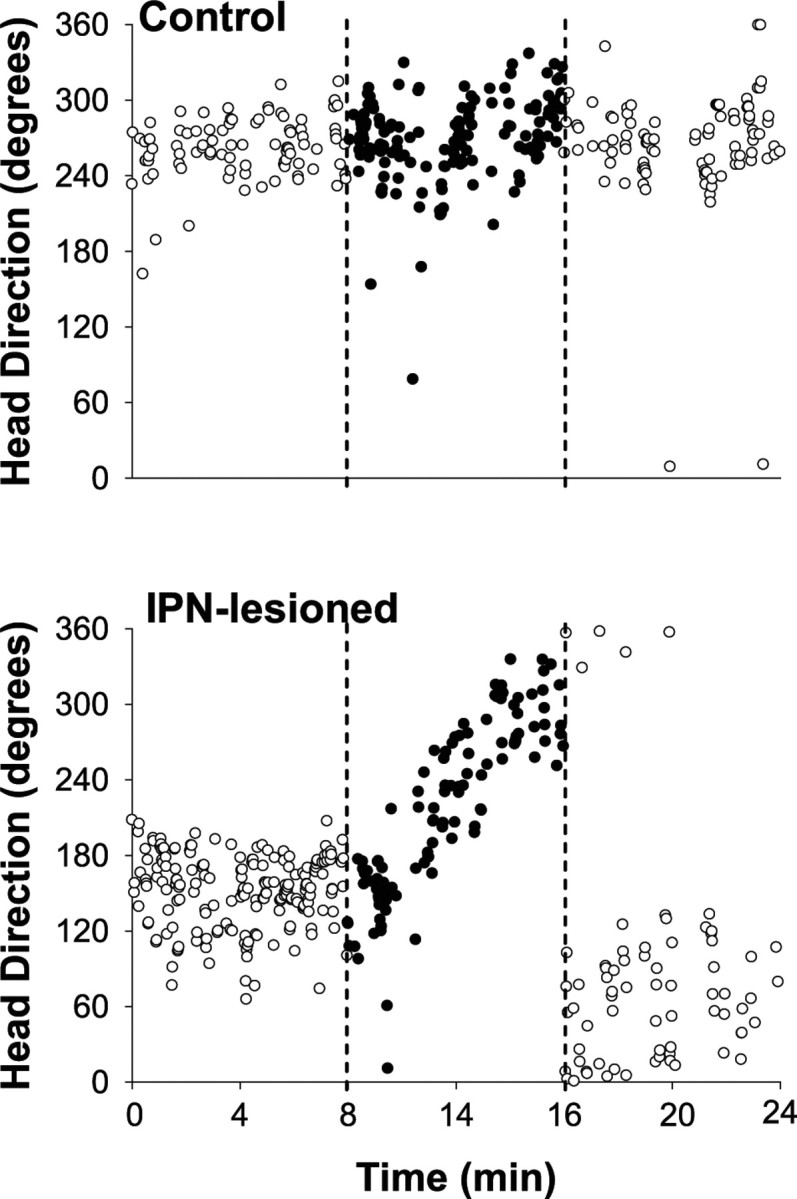
HD versus time plots of a representative HD cell from a control (top) and an IPN-lesioned (bottom) rat during the standard 2, dark, and standard 3 sessions. Each circle represents the direction and time in which the HD cell fired at a rate ≥50% of its average peak firing rate. Open circles represent the standard 2 (0–8 min) and standard 3 (16–24 min) sessions. The filled circles represent the dark test (8–16 min). Broken lines further demarcate each session. For the control animal, the preferred firing direction showed little to no fluctuation throughout the standard 2, dark, and standard 3 sessions. Notice, however, that for the IPN-lesioned animal the preferred firing direction showed substantial drift during the dark test but not during standard 2 and 3 sessions.
To quantify the amount of drift in the preferred direction, we computed an HD by time plot for each recorded cell during each standard 2, dark, and standard 3 sessions. We then performed a regression to fit the HD by time data and then used the resulting slope coefficient (in degrees per second) as an estimate of the amount of drift in the preferred firing direction. The resulting absolute slope values were multiplied by 480 s (8 min) to obtain the total intrasession drift for each cell. Figure 9A plots the average intrasession drift for IPN-lesioned and control rats during each testing session. On average, HD cells in IPN-lesioned rats had a greater amount of drift in their preferred directions than control rats during the dark test (IPN: dark test intrasession drift, 77.9 ± 8.07°; control: dark test intrasession drift, 23.3 ± 9.78°) but not during the standard 2 and 3 sessions (IPN: standard 2 intrasession drift, 25.9 ± 8.07°; standard 3 intrasession drift, 35.7 ± 8.58°; control: standard 2 intrasession drift, 27.4 ± 9.78°; standard 3 intrasession drift, 22.7 ± 10.1°). This result was confirmed by an ANOVA indicating a significant group × session interaction (F(2,116) = 5.25; p = 0.007). Follow-up comparisons further confirmed that the groups differed significantly in the dark (t(40) = 3.14, p = 0.003) but not during the standard sessions (standard 2 and 3, respectively: t(40) = −0.149 and t(36) = 1.45; p > 0.05).
Figure 9.

A, The mean and the SE for the intrasession drift (degrees) obtained for IPN-lesioned and control rats during standard 2, dark, and standard 3 testing sessions. Note that the statistical comparisons indicate a significant difference during the dark test but not for the standard sessions. B, Polar plots showing the angular shift in the preferred firing direction between the standard 2 and standard 3 sessions for control (left) and IPN-lesioned (right) rats. Cells from IPN-lesioned rats had larger angular shifts than control animals but were distributed nonrandomly (**p < 0.01; ***p < 0.001).
Although not statistically significant, one interesting observation was that the cells in lesioned animals had a higher average drift in their preferred directions during the standard 3 session (Fig. 9A). It is possible that the dark test disoriented the animals, resulting in a slow drift across the standard 3 session. Alternatively, the preferred directions may have been slowly returning back to their original orientation after they had drifted in the dark test. This latter interpretation would suggest that the visual landmark had some control over the preferred directions of the cells. Given these considerations, we were interested in whether the landmark generally returned the preferred firing directions to their original orientation after they had drifted in darkness. To test this issue, we computed the absolute angular shift in the preferred firing direction between the standard 2 and standard 3 sessions for HD cells in the control and IPN-lesions groups. Figure 9B plots the angular shift scores between the standard 2 and standard 3 sessions. An independent sample t test indicated that cells in IPN-lesioned animals had much greater absolute shift values between the standard 2 and standard 3 sessions (54.6 ± 11.6°) than those obtained from control rats (21.9 ± 6.82°; t(37) = −2.24; p = 0.03). Nonetheless, a Rayleigh analysis revealed that both groups had nonrandom distributions (IPN lesion, r = 0.489, p = 0.003; control, r = 0.837, p < 0.001), suggesting that the landmark had some control over the cells.
Related to the present experiment, Knierim et al. (1998) reported that ADN HD cells in intact animals rarely returned to their original preferred directions if they drifted ≥45° during darkness testing. However, if the cells drifted <45°, they returned to their original orientation ∼50% of the time. Consistent with these findings, we found that, in the lesioned animals, 4 of the 12 cells (33%) that drifted ≥45° in the dark returned to within 30° of their original preferred firing directions during the standard 3 session. In comparison, 5 of 10 cells (50%) in the lesioned animals returned to their original orientation after drifting <45° during the dark test. For control animals, none of the preferred firing directions of the cells exceeded 45° of drift during dark testing, perhaps because of the brief duration of the session. In fact, only 4 of the 16 control cells exceeded 30° of drift. However, inspection of the control data show that 11 of the 16 cells (69%) returned to within 30° of their previous orientation during standard session 3. Considering the results of both groups, these findings suggest that the landmark can exert some control over the preferred direction if the drift in the preferred direction is small. However, if the drift is larger, then the landmarks have weaker control over the preferred firing directions of the cells. Thus, it is possible that the poor landmark control in the lesioned animals can be attributed to the large drift during darkened testing.
To summarize, HD cells in IPN-lesioned animals were unable to maintain their preferred firing orientation during the 8 min dark session but were capable of maintaining it during the standard sessions in which the landmark cue was visible. The fact that cells in IPN-lesioned animals had large directional deviations during the dark test but not during other sessions supports the notion that the lesions interfere with the animal's ability to use idiothetic cues for stabilizing the preferred firing direction. The finding that HD cells were stable during the standard 2 and 3 sessions suggests that the visual landmark was capable of controlling the activity of cells in IPN-lesioned animals. Finally, HD cells in lesioned animals rarely returned to their original orientation after dark testing and may be linked to the amount of drift in the preferred firing direction during the dark tests.
Dual-chamber test
A total of 13 HD cells from control animals and 10 HD cells from IPN-lesioned rats were monitored in the dual-chamber apparatus. Seven of the 13 control cells were obtained from two previous studies using identical procedures and equipment (Taube and Burton, 1995; Calton et al., 2008). The results from both control groups did not differ significantly when tested in the dual-chamber apparatus and were therefore pooled into one group. In general, cells from control rats typically exhibited stable preferred directions when locomoting from the familiar cylindrical enclosure to the novel rectangular enclosure, strongly suggesting that intact animals used idiothetic cues to maintain a stable preferred firing direction when locomoting into a novel environment. A representative firing rate versus head direction function from the familiar cylinder (cylinder 1) and the novel rectangular compartment (rectangle) conditions of the dual-chamber apparatus are shown for a control and IPN-lesioned animal in Figure 10. Compared with control rats, cells from IPN-lesioned animals exhibited less stable preferred firing directions when the animal walked from the cylinder to the rectangle. There was a trend toward greater angular shift values between the cylinder and the rectangle for electrolytic (n = 4) lesioned animals compared with neurotoxic (n = 6) lesioned rats; however, this trend did not reach statistical significance (t(3.4) = −2.39; p > 0.05), possibly because of the small number of cells in each group. Thus, for statistical comparisons with control rats, we pooled the results of both lesion groups. An independent sample t test comparing the absolute angular shift of cells from IPN-lesioned and control animals confirmed that the absolute angular shifts were greater in lesioned rats (t(21) = 3.9; p < 0.001), and the variability in the directional shifts (concentration parameter) was greater for lesioned animals than for controls (F(1,21) = 17.96; p < 0.001). Thus, whereas cells from IPN-lesioned rats showed an average absolute angular shift of 60.0 ± 13.7° between the two enclosures, cells from control rats had much smaller values (12.5 ± 2.2°).
Figure 10.

Representative firing rate versus HD tuning curves for HD cells from representative control (top) and IPN-lesioned (bottom) animals in the dual-chamber apparatus. The solid line indicates the cylinder 1 session, and the broken lines represent the rectangle session. Note that the cell from the control rat maintains a similar preferred direction during the transition from the familiar cylinder to the novel rectangle. In contrast, the tuning curve for the IPN-lesioned rat demonstrated a large 54° CCW shift.
Figure 11A shows polar plots of the angular shift between the familiar cylinder and the rectangle for each cell in control (left panel) and IPN-lesioned (right panel) groups. Rayleigh tests were conducted on these angular shift values to determine whether they were distributed nonrandomly, an expected outcome if the animals were using idiothetic cues. The Rayleigh analysis indicated that angular shift values were distributed randomly in rats with IPN lesions (r = 0.483; p = 0.10), whereas shift values were found to be nonrandom in control animals (r = 0.971; p < 0.001). This latter analysis suggests that IPN-lesioned animals were unable to use idiothetic cues effectively to maintain the same preferred firing direction between the two compartments. It should be noted, however, that many of the HD cells (8 of 10) in the lesioned group had angular shift values <90°, suggesting that some updating by idiothetic cues was maintained. Nonetheless, the results are consistent with the findings of Stackman et al. (2003) who reported a similar distribution of shift values and Rayleigh scores after removal of normal motor cues (Stackman et al., 2003, their Fig. 3).
Figure 11.

A, Polar plots showing the angular shift in the preferred firing direction between the cylinder 1 and rectangle sessions for control (left) and IPN-lesioned (right) rats. The plots reveal that the IPN-lesioned animals had larger angular shifts than the cells from control animals and were distributed randomly (***p < 0.001). B, Polar plots showing the angular shift in the preferred firing direction between the cylinder 1 and cylinder 2 sessions for control (left) and IPN-lesioned (right) rats. Cells from IPN-lesioned rats had larger angular shifts than control animals but were distributed nonrandomly (**p < 0.01; ***p < 0.001). For the control group, the gray circles represent the shift values for animals included in the present study, and the black circles represent shift values from previous studies. For the IPN-lesioned group, black and white circles show values from neurotoxic lesioned and electrolytic lesioned animals, respectively.
Figure 11B shows the angular shift scores between the original cylinder (cylinder 1) and return-cylinder (cylinder 2) sessions for cells in IPN-lesioned (right panel) and control (left panel) groups. The preferred firing directions of cells from control animals generally returned to the directions established in the original cylinder sessions (mean shift, 8.30 ± 1.45°). On average, cells from IPN-lesioned rats had higher absolute angular shift scores (mean shift, 31.8 ± 10.7°), suggesting that some cells adopted new preferred firing directions when the animals returned to the cylinder. Although an independent sample t test on the absolute angular shift values indicated a significant difference (t(21) = 2.48; p = 0.022), a Rayleigh analysis indicated that angular shift values were distributed nonrandomly for cells in both groups (IPN lesion, r = 0.752, p = 0.002; control, r = 0.986, p < 0.001). Thus, the Rayleigh test suggests that familiar cylinder landmarks can exert some control on the preferred firing direction of cells in IPN-lesioned rats. It is interesting to note that, of the cells in lesioned rats that rotated their preferred firing directions ≥45° in the novel rectangle, two of six preferred firing directions (33.3%) returned to within 30° of their original orientation when the animal walked back to the familiar rectangle. In contrast, four of four cells that had directional shift values <45° in the novel rectangle shifted their preferred directions back to the original orientation within the familiar cylinder. None of the cells in intact rats exhibited preferred directional shifts >45° when locomoting into the novel rectangle, and all of their tuning curves returned to their original orientation when the animal returned to the familiar cylinder. Together, the observation of large shifts in the preferred firing directions may explain the poor landmark control after the lesioned animals returned to the familiar cylinder.
To summarize, HD cells from IPN-lesioned animals were unable to maintain their preferred firing direction when the animal entered the novel rectangular section of the dual-chamber apparatus, suggesting that the animals were impaired at using self-movement cues for preferred firing direction stability. Thus, this finding supports the notion that the IPN is important for relaying motor cues into HD cell circuitry. In addition, when returning to the familiar environment, cells in IPN-lesioned animals displayed slightly larger angular shift scores than control cells. Although this latter finding did not lead to randomly distributed shift scores, the results suggest that IPN lesions can create mild disturbances in the ability of familiar visual landmarks to control the preferred directions.
Discussion
The present study examined the role of the IPN in generating and maintaining direction-specific firing in HD cells from the ADN. Although large lesions of the IPN did not abolish direction-specific activity of ADN HD cells, inspection of their firing characteristics revealed several major differences compared with controls. IPN lesions reduced the overall peak firing rate, increased the directional firing range, and increased the amount cell firing anticipated future directional heading. Furthermore, tests in lesioned rats revealed that the preferred firing directions of the cells were less influenced by a salient visual landmark. Finally, HD cells in IPN-lesioned rats exhibited larger shifts in their preferred firing direction than control animals when foraging in a darkened environment and when locomoting from a familiar environment to a novel one. The results suggest that the IPN serves a broad role in the generation and maintenance of the HD cell signal in the ADN. We suggest that, because of its strong connectivity with brain regions linked to processing motor information (Morley, 1986; Klemm, 2004) and the finding of movement sensitive neurons in the IPN (Sharp et al., 2006), its function is related to the signaling of idiothetic motor cues to HD cell circuitry.
IPN and idiothetic control of HD cell preferred directions
The finding that lesions of the IPN reduce the stability of HD cells during idiothetic-based tests is consistent with the proposal that the IPN is involved in the signaling of movement-related cues. Stackman et al. (2003) examined the degree to which motor cues contribute to preferred direction stability by passively transporting rats on a wheeled cart from a familiar chamber to a novel enclosure in the dual-chamber apparatus. Under these conditions, the preferred firing directions of ADN HD cells shifted significantly more than rats that self-locomoted to the novel environment, suggesting an important role for normal volitional movements in updating the preferred direction under conditions that most likely require path integration mechanisms. Our results were consistent with these findings as the preferred directions drifted significantly when the IPN-lesioned animals locomoted into the novel rectangular environment. An interesting correlation between the results of lesioned animals in the present study and the passively transported rats in the study by Stackman et al. (2003) is that the angular shift values of the preferred firing direction between the familiar cylinder and novel rectangle rarely exceeded 90° (two cells in each study). This result implies that other idiothetic cues, such as vestibular or even other sources of motor information, may have had some residual control over the preferred firing directions of the cells. Nonetheless, additional testing revealed that IPN lesions induced a large amount of drift in the preferred directions when the rats foraged for food under darkened conditions. These findings suggest an important role for the IPN in the idiothetic control of HD cell activity.
The idiothetic or path integration-based control of HD cells likely involves a number of processes, including, but not limited to, (1) the establishment of an initial direction, (2) the monitoring of idiothetic signals, and (3) the computation of the current heading direction based on an initial orientation and subsequent self-movement signals (Skaggs et al., 1995; McNaughton et al., 1996; Redish et al., 1996; Zhang, 1996; Song and Wang, 2005). Although it is possible that IPN lesions may have disrupted any one of these processes, we suggest that the structure is at least involved in conveying motor-related signals to HD cell circuitry (Sharp et al., 2006), likely through its reciprocal relationship with the DTN and its connections with the lateral habenula, which also projects to the DTN (Fig. 1) (Contestabile and Flumerfelt, 1981; Liu et al., 1984; Hayakawa and Zyo, 1985; Groenewegen et al., 1986). Lateral habenula neurons are sensitive to running speed and angular head velocity (Sharp et al., 2006), suggesting that information about self-movements is also generated in this structure. Motor/proprioceptive cues may alternatively be integrated into the HD cell circuit as early as the vestibular nucleus (Angelaki and Cullen, 2008). Evidence for this view stems from studies in monkeys showing that the activity of vestibular neurons is diminished during active angular head movements but not during passive movements (Roy and Cullen, 2004). Nonetheless, this finding is difficult to reconcile with the fact that angular head velocity cells in the DTN respond more robustly to active than passive head movements (Sharp et al., 2001b).
IPN and landmark control of HD cell preferred directions
The finding that the visual landmark exerted poor control over the preferred directions of lesioned animals was surprising given the absence of direct inputs from brain regions involved in visuospatial processing (Morley, 1986; Klemm, 2004). As shown in Figure 1, the processing of landmark cues is generally thought to occur in a circuit that includes the postsubiculum (Goodridge and Taube, 1997), a major recipient of projections from the visual cortex (Vogt and Miller, 1983), and several other brain regions involved in visuospatial processing, including the retrosplenial and entorhinal cortices (van Groen and Wyss, 1990; Burwell, 2000; Kerr et al., 2007). Nonetheless, it is possible that at least some of the poor landmark control in lesioned animals was the direct result of the large angular shifts in the preferred direction during the idiothetic tests (dark test and dual-chamber apparatus). Similar observations were made by Stackman et al. (2003) when rats were passively wheeled from the cylinder to the novel rectangle and then allowed to walk back to the familiar cylinder compartment. In this case, if the amount of shift was large when entering the novel environment, the preferred directions of HD cells did not return to their original orientations when the rats walked back to the familiar cylinder. Knierim et al. (1998) found a similar effect in darkened conditions. Interestingly, in the present study, the average absolute angular shift of HD cell preferred directions in both idiothetic tests was ∼70° for lesioned animals, whereas the average shift in both tests was ∼17° for control animals. These differences in shift magnitude during the idiothetic tests may have contributed to the moderate landmark control deficits observed in lesioned animals.
The explanation above does not explain the poor control over HD cell tuning in lesioned rats when the landmark was shifted 90° during the cue rotation tests. One possible explanation is that the IPN lesions produced attentional disturbances, perhaps by altering the ability to detect the degree of landmark rotation. An attentional hypothesis, however, does not account for the stable preferred directions of HD cells during the standard testing sessions versus the drift observed during dark testing, unless the attentional deficit has a greater impact on idiothetic cue control and has a milder influence on landmark information. Furthermore, during the landmark rotation series, the preferred directions rotated in the correct direction 79% of the time, suggesting that the animals detected changes in the landmark location. An attentional hypothesis is also difficult to reconcile with the results of a preliminary study showing that animals with lesions of the IPN can readily navigate to a standard cued platform in the Morris water maze but not to the hidden platform in a spatial variant of the task (Clark and Taube, 2009). Such findings suggest that the lesioned animals can continuously attend to cues directly associated with a goal location but are impaired at learning the spatial relationship of the goal with the distal landmark cues. This result suggests that the IPN plays a more fundamental role in spatial navigation.
A second explanation for the moderate loss of landmark control is that the impairments might be secondary to the loss of idiothetic information. Recent theoretical work suggests that a stable spatial framework based on idiothetic information is required for visual cue learning in HD and hippocampal place cell networks (McNaughton et al., 1996; Samsonovich and McNaughton, 1997). For example, Knierim et al. (1995) showed that landmark control over HD cell and place cell activity was weaker in animals that were disoriented before each recording session (but see Dudchenko et al., 1997). Complete removal of vestibular information abolishes directional activity in the ADN and place cell activity in the hippocampus, despite the presence of familiar cues (Stackman and Taube, 1998; Stackman et al., 2003). Moreover, the removal of normal motor cues significantly reduces the spatial resolution of hippocampal place cells and reduces the control exerted by visual cues in a familiar environment (Foster et al., 1989; Terrazas et al., 2005). Together, these findings suggest that landmark information is learned in relation to idiothetic information and thus might account for the loss of landmark control in the present study.
IPN and behavior
The IPN has been implicated in a variety of functions, including homeostasis, olfactory behavior, stress, sleep, nociception, and learning (for review, see Morley, 1986; Klemm, 2004). Despite the wide range of behaviors linked to the IPN, there has not been a similar investigation of its role in navigation. Recent findings from our laboratory show that IPN lesions impair performance in both path integration and landmark-dependent spatial tasks (Clark and Taube, 2009). Other studies report similar landmark navigation impairments when the habenula is electrolytically damaged (Lecourtier et al., 2004). Given that the IPN and its related circuitry are one of the major links between limbic forebrain, striatum, and brainstem structures (Sutherland, 1982; Klemm, 2004; Lecourtier and Kelly, 2007), future work should be directed at elucidating the precise role of this circuitry in spatial navigation and memory.
Footnotes
This work was supported by National Institutes of Health Grant NS053907 (J.S.T.) and a PGS-D postgraduate scholarship from the National Sciences and Engineering Research Council of Canada (B.J.C.). We thank Jeffrey Calton for contributing some data from control animals and Jennifer Rilling for technical assistance.
References
- Aggleton JP, Vann SD. Testing the importance of the retrosplenial navigation system: lesion size but not strain matters: a reply to Harker and Whishaw. Neurosci Biobehav Rev. 2004;28:525–531. doi: 10.1016/j.neubiorev.2004.08.003. [DOI] [PubMed] [Google Scholar]
- Angelaki DE, Cullen KE. Vestibular system: the many facets of a multimodal sense. Annu Rev Neurosci. 2008;31:125–150. doi: 10.1146/annurev.neuro.31.060407.125555. [DOI] [PubMed] [Google Scholar]
- Bassett JP, Taube JS. Neural correlates for angular head velocity in the rat dorsal tegmental nucleus. J Neurosci. 2001;21:5740–5751. doi: 10.1523/JNEUROSCI.21-15-05740.2001. [DOI] [PMC free article] [PubMed] [Google Scholar]
- Bassett JP, Zugaro MB, Muir GM, Golob EJ, Muller RU, Taube JS. Passive movements of the head do not abolish anticipatory firing properties of head direction cells. J Neurophysiol. 2005;93:1304–1316. doi: 10.1152/jn.00490.2004. [DOI] [PubMed] [Google Scholar]
- Bassett JP, Tullman ML, Taube JS. Lesions of the tegmento-mammillary circuit in the head direction system disrupts the head direction signal in the anterior thalamus. J Neurosci. 2007;27:7564–7577. doi: 10.1523/JNEUROSCI.0268-07.2007. [DOI] [PMC free article] [PubMed] [Google Scholar]
- Batschelet E. Circular statistics in biology. New York: Academic; 1981. [Google Scholar]
- Biazoli CE, Jr, Goto M, Campos AM, Canteras NS. The supragenual nucleus: a putative relay station for ascending vestibular signs to head direction cells. Brain Res. 2006;1094:138–148. doi: 10.1016/j.brainres.2006.03.101. [DOI] [PubMed] [Google Scholar]
- Blair HT, Sharp PE. Anticipatory head direction signals in anterior thalamus: evidence for a thalamocortical circuit that integrates angular head motion to compute head direction. J Neurosci. 1995;15:6260–6270. doi: 10.1523/JNEUROSCI.15-09-06260.1995. [DOI] [PMC free article] [PubMed] [Google Scholar]
- Blair HT, Cho J, Sharp PE. Role of the lateral mammillary nucleus in the rat head direction circuit: a combined single-unit recording and lesion study. Neuron. 1998;21:1387–1397. doi: 10.1016/s0896-6273(00)80657-1. [DOI] [PubMed] [Google Scholar]
- Blair HT, Lipscomb BW, Sharp PE. Anticipatory time intervals of head-direction cells in the anterior thalamus of the rat: implications for path integration in the head-direction circuit. J Neurophysiol. 1997;78:145–159. doi: 10.1152/jn.1997.78.1.145. [DOI] [PubMed] [Google Scholar]
- Blair HT, Cho J, Sharp PE. The anterior thalamic head-direction signal is abolished by bilateral but not unilateral lesions of the lateral mammillary nucleus. J Neurosci. 1999;19:6673–6683. doi: 10.1523/JNEUROSCI.19-15-06673.1999. [DOI] [PMC free article] [PubMed] [Google Scholar]
- Brown JE, Card JP, Yates BJ. Polysynaptic pathways from the vestibular nuclei to the lateral mammillary nucleus of the rat: substrates for vestibular input to head direction cells. Exp Brain Res. 2005;161:47–61. doi: 10.1007/s00221-004-2045-4. [DOI] [PubMed] [Google Scholar]
- Burwell RD. The parahippocampal region: corticocortical connectivity. Ann N Y Acad Sci. 2000;911:25–42. doi: 10.1111/j.1749-6632.2000.tb06717.x. [DOI] [PubMed] [Google Scholar]
- Calton JL, Turner CS, Cyrenne DL, Lee BR, Taube JS. Landmark control and updating of self-movement cues are largely maintained in head direction cells after lesions of the posterior parietal cortex. Behav Neurosci. 2008;122:827–840. doi: 10.1037/0735-7044.122.4.827. [DOI] [PMC free article] [PubMed] [Google Scholar]
- Clark BJ, Taube JS. Deficits in lardmark navigation and path integration after lesions of the interpeduncular nucleus. Behav Neurosci. 2009 doi: 10.1037/a0015477. in press. [DOI] [PMC free article] [PubMed] [Google Scholar]
- Contestabile A, Flumerfelt BA. Afferent connections of the interpeduncular nucleus and the topographic organization of the habenulo-interpeduncular pathway: an HRP study in the rat. J Comp Neurol. 1981;196:253–270. doi: 10.1002/cne.901960206. [DOI] [PubMed] [Google Scholar]
- Dudchenko PA, Goodridge JP, Taube JS. The effects of disorientation on visual landmark control of head direction cell orientation. Exp Brain Res. 1997;115:375–380. doi: 10.1007/pl00005707. [DOI] [PubMed] [Google Scholar]
- Foster TC, Castro CA, McNaughton BL. Spatial selectivity of rat hippocampal neurons: dependence on preparedness for movement. Science. 1989;244:1580–1582. doi: 10.1126/science.2740902. [DOI] [PubMed] [Google Scholar]
- Frohardt RJ, Bassett JP, Taube JS. Path integration and lesions within the head direction cell circuit: comparison between the roles of the anterodorsal thalamus and dorsal tegmental nucleus. Behav Neurosci. 2006;120:135–149. doi: 10.1037/0735-7044.120.1.135. [DOI] [PubMed] [Google Scholar]
- Golob EJ, Taube JS. Head direction cells in rats with hippocampal or overlying neocortical lesions: evidence for impaired angular path integration. J Neurosci. 1999;19:7198–7211. doi: 10.1523/JNEUROSCI.19-16-07198.1999. [DOI] [PMC free article] [PubMed] [Google Scholar]
- Goodridge JP, Taube JS. Interaction between postsubiculum and anterior thalamus in the generation of head direction cell activity. J Neurosci. 1997;17:9315–9330. doi: 10.1523/JNEUROSCI.17-23-09315.1997. [DOI] [PMC free article] [PubMed] [Google Scholar]
- Goodridge JP, Dudchenko PA, Worboys KA, Golob EJ, Taube JS. Cue control and head direction cells. Behav Neurosci. 1998;112:749–761. doi: 10.1037//0735-7044.112.4.749. [DOI] [PubMed] [Google Scholar]
- Groenewegen HJ, Van Dijk CA. Efferent connection of the dorsal tegmental region in the rat, studied by means of anterograde transport of the lectin phaseolus vulgari-leucoagglutinin (PHA-L) Brain Res. 1984;304:367–371. doi: 10.1016/0006-8993(84)90341-x. [DOI] [PubMed] [Google Scholar]
- Groenewegen HJ, Ahlenius S, Haber SN, Kowall NW, Nauta WJH. Cytoarchitecture, fiber connections, and some histochemical aspects of the interpeduncular nucleus in the rat. J Comp Neurol. 1986;249:65–102. doi: 10.1002/cne.902490107. [DOI] [PubMed] [Google Scholar]
- Harker KT, Whishaw IQ. A reaffirmation of the retrosplenial contribution to rodent navigation: reviewing the influences of lesion, strain, and task. Neurosci Biobehav Rev. 2004;28:485–496. doi: 10.1016/j.neubiorev.2004.06.005. [DOI] [PubMed] [Google Scholar]
- Hayakawa T, Zyo K. Comparative anatomical study of the tegmentomammillary projections in some mammals: a horseradish peroxidase study. Brain Res. 1984;300:335–349. doi: 10.1016/0006-8993(84)90844-8. [DOI] [PubMed] [Google Scholar]
- Hayakawa T, Zyo K. Afferent connections of Gudden's tegmental nuclei in the rabbit. J Comp Neurol. 1985;235:169–181. doi: 10.1002/cne.902350203. [DOI] [PubMed] [Google Scholar]
- Hayakawa T, Zyo K. Retrograde double-labeling study of the mammillothalamic and the mammillotegmental projections in the rat. J Comp Neurol. 1989;284:1–11. doi: 10.1002/cne.902840102. [DOI] [PubMed] [Google Scholar]
- Hemmendinger LM, Moore RY. Interpeduncular nucleus organization in the rat: cytoarchitecture and histochemical analysis. Brain Res Bull. 1984;13:163–179. doi: 10.1016/0361-9230(84)90018-2. [DOI] [PubMed] [Google Scholar]
- Kerr KM, Agster KL, Furtak SC, Burwell RD. Functional neuroanatomy of the parahippocampal region: the lateral and medial entorhinal areas. Hippocampus. 2007;17:697–708. doi: 10.1002/hipo.20315. [DOI] [PubMed] [Google Scholar]
- Klemm WR. Habenular and interpeduncularis nuclei: shared components in multiple-function networks. Med Sci Monit. 2004;10:RA261–RA273. [PubMed] [Google Scholar]
- Knierim JJ, Kudrimoti HS, McNaughton BL. Place cells, head direction cells, and the learning of landmark stability. J Neurosci. 1995;15:1648–1659. doi: 10.1523/JNEUROSCI.15-03-01648.1995. [DOI] [PMC free article] [PubMed] [Google Scholar]
- Knierim JJ, Kudrimoti HS, McNaughton BL. Interactions between idiothetic cues and external landmarks in the control of place cells and head direction cells. J Neurophysiol. 1998;80:425–446. doi: 10.1152/jn.1998.80.1.425. [DOI] [PubMed] [Google Scholar]
- Kubie JL. A driveable bundle of microwires for collecting single-unit data from freely-moving rats. Physiol Behav. 1984;32:115–118. doi: 10.1016/0031-9384(84)90080-5. [DOI] [PubMed] [Google Scholar]
- Lecourtier L, Kelly PH. A conductor hidden in the orchestra? Role of the habenular complex in monoamine transmission and cognition. Neurosci Biobehav Rev. 2007;31:658–672. doi: 10.1016/j.neubiorev.2007.01.004. [DOI] [PubMed] [Google Scholar]
- Lecourtier L, Neijt HC, Kelly PH. Habenula lesions cause impaired cognitive performance in rats: implications for schizophrenia. Eur J Neurosci. 2004;19:2551–2560. doi: 10.1111/j.0953-816X.2004.03356.x. [DOI] [PubMed] [Google Scholar]
- Liu R, Chang L, Wickern G. The dorsal tegmental nucleus: an axoplasmic transport study. Brain Res. 1984;310:123–132. doi: 10.1016/0006-8993(84)90015-5. [DOI] [PubMed] [Google Scholar]
- McNaughton BL, Barnes CA, Gerrard JL, Gothard K, Jung MW, Knierim JJ, Kudrimoti H, Qin Y, Skaggs WE, Suster M, Weaver KL. Deciphering the hippocampal polyglot: the hippocampus as a path integration system. J Exp Biol. 1996;199:173–185. doi: 10.1242/jeb.199.1.173. [DOI] [PubMed] [Google Scholar]
- Morley BJ. The interpeduncular nucleus. Int Rev Neurobiol. 1986;28:157–182. doi: 10.1016/s0074-7742(08)60108-7. [DOI] [PubMed] [Google Scholar]
- Morris RG, Garrud P, Rawlins JN, O'Keefe J. Place navigation impaired in rats with hippocampal lesions. Nature. 1982;297:681–683. doi: 10.1038/297681a0. [DOI] [PubMed] [Google Scholar]
- Parron C, Save E. Evidence for entorhinal and parietal cortices involvement in path integration in the rat. Exp Brain Res. 2004;159:349–359. doi: 10.1007/s00221-004-1960-8. [DOI] [PubMed] [Google Scholar]
- Paxinos G, Watson C. The rat brain in stereotaxic coordinates. Ed 4. San Diego: Academic; 1998. [DOI] [PubMed] [Google Scholar]
- Redish AD, Elga AN, Touretzky DS. A coupled attractor model of the rodent head direction system. Network Comput Neural Syst. 1996;7:671–685. [Google Scholar]
- Roy JE, Cullen KE. Dissociating self-generated from passively applied head motion: neural mechanisms in the vestibular nuclei. J Neurosci. 2004;24:2102–2111. doi: 10.1523/JNEUROSCI.3988-03.2004. [DOI] [PMC free article] [PubMed] [Google Scholar]
- Samsonovich A, McNaughton BL. Path integration and cognitive mapping in a continuous attractor neural network model. J Neurosci. 1997;17:5900–5920. doi: 10.1523/JNEUROSCI.17-15-05900.1997. [DOI] [PMC free article] [PubMed] [Google Scholar]
- Save E, Guazzelli A, Poucet B. Dissociation of the effects of bilateral lesions of the dorsal hippocampus and parietal cortex on path integration in the rat. Behav Neurosci. 2001;115:1212–1223. doi: 10.1037//0735-7044.115.6.1212. [DOI] [PubMed] [Google Scholar]
- Sharp PE, Blair HT, Cho J. The anatomical and computational basis of the rat head-direction cell signal. Trends Neurosci. 2001a;24:289–294. doi: 10.1016/s0166-2236(00)01797-5. [DOI] [PubMed] [Google Scholar]
- Sharp PE, Tinkelman A, Cho J. Angular velocity and head direction signals recorded from the dorsal tegmental nucleus of Gudden in the rat: implications for path integration in the head direction cell circuit. Behav Neurosci. 2001b;115:571–588. [PubMed] [Google Scholar]
- Sharp PE, Turner-Williams S, Tuttle S. Movement related correlates of single cell activity in the interpeduncular nucleus and habenula of the rat during a pellet-chasing task. Behav Brain Res. 2006;166:55–70. doi: 10.1016/j.bbr.2005.07.004. [DOI] [PubMed] [Google Scholar]
- Skaggs WE, McNaughton BL, Gothard KM, Markus EJ. An information-theoretic approach to deciphering the hippocampal code. In: Hanson SJ, Cowan JD, Giles CL, editors. Advances in neural information processing systems. Vol 5. San Mateo, CA: Morgan Kaufmann; 1993. pp. 1030–1037. [Google Scholar]
- Skaggs WE, Knierim JJ, Kudrimoti HS, McNaughton BL. A model of the neural basis of the rat's sense of direction. In: Tesauro G, Touretzky DS, Leen TK, editors. Advances in neural information processing systems. Vol 7. Cambridge, MA: MIT; 1995. pp. 173–180. [PubMed] [Google Scholar]
- Song P, Wang XJ. Angular path integration by moving “hill of activity”: a spiking neuron model without recurrent excitation of the head-direction system. J Neurosci. 2005;25:1002–1014. doi: 10.1523/JNEUROSCI.4172-04.2005. [DOI] [PMC free article] [PubMed] [Google Scholar]
- Stackman RW, Taube JS. Firing properties of rat lateral mammillary single units: head direction, head pitch, and angular head velocity. J Neurosci. 1998;18:9020–9037. doi: 10.1523/JNEUROSCI.18-21-09020.1998. [DOI] [PMC free article] [PubMed] [Google Scholar]
- Stackman RW, Golob EJ, Bassett JP, Taube JS. Passive transport disrupts directional path integration by rat head direction cells. J Neurophysiol. 2003;90:2862–2874. doi: 10.1152/jn.00346.2003. [DOI] [PubMed] [Google Scholar]
- Sutherland RJ. The dorsal diencephalic conduction system: a review of the anatomy and functions of the habenular complex. Neurosci Biobehav Rev. 1982;6:1–13. doi: 10.1016/0149-7634(82)90003-3. [DOI] [PubMed] [Google Scholar]
- Taube JS. Head direction cells recorded in the anterior thalamic nuclei of freely moving rats. J Neurosci. 1995;15:70–86. doi: 10.1523/JNEUROSCI.15-01-00070.1995. [DOI] [PMC free article] [PubMed] [Google Scholar]
- Taube JS. The head direction signal: origins and sensory-motor integration. Annu Rev Neurosci. 2007;30:181–207. doi: 10.1146/annurev.neuro.29.051605.112854. [DOI] [PubMed] [Google Scholar]
- Taube JS, Bassett JP. Persistent neural activity in head direction cells. Cereb Cortex. 2003;13:1162–1172. doi: 10.1093/cercor/bhg102. [DOI] [PubMed] [Google Scholar]
- Taube JS, Burton HL. Head direction cell activity monitored in a novel environment and during a cue conflict situation. J Neurophysiol. 1995;74:1953–1971. doi: 10.1152/jn.1995.74.5.1953. [DOI] [PubMed] [Google Scholar]
- Taube JS, Muller RU. Comparisons of head direction cell activity in the postsubiculum and anterior thalamus of freely moving rats. Hippocampus. 1998;8:87–108. doi: 10.1002/(SICI)1098-1063(1998)8:2<87::AID-HIPO1>3.0.CO;2-4. [DOI] [PubMed] [Google Scholar]
- Taube JS, Muller RU, Ranck JB., Jr Head-direction cells recorded from the postsubiculum in freely moving rats. I. Description and quantitative analysis. J Neurosci. 1990a;10:420–435. doi: 10.1523/JNEUROSCI.10-02-00420.1990. [DOI] [PMC free article] [PubMed] [Google Scholar]
- Taube JS, Muller RU, Ranck JB., Jr Head-direction cells recorded from the postsubiculum in freely moving rats. II. Effects of environmental manipulations. J Neurosci. 1990b;10:436–447. doi: 10.1523/JNEUROSCI.10-02-00436.1990. [DOI] [PMC free article] [PubMed] [Google Scholar]
- Taube JS, Sarma A, Clark BJ. Lesions of the interpeduncular nucleus do not abolish head direction cell activity, but disrupt stability of the preferred firing direction. Soc Neurosci Abstr. 2006;33:68–24. [Google Scholar]
- Terrazas A, Krause M, Lipa P, Gothard KM, Barnes CA, McNaughton BL. Self-motion and the hippocampal spatial metric. J Neurosci. 2005;25:8085–8096. doi: 10.1523/JNEUROSCI.0693-05.2005. [DOI] [PMC free article] [PubMed] [Google Scholar]
- Vanderwolf CH. Hippocampal electrical activity and voluntary movement in the rat. Electroencephalogr Clin Neurophysiol. 1969;26:407–418. doi: 10.1016/0013-4694(69)90092-3. [DOI] [PubMed] [Google Scholar]
- van der Kooy D, Carter DA. The organization of the efferent projections and striatal afferents of the entopeduncular nucleus and adjacent areas in the rat. Brain Res. 1981;211:15–36. doi: 10.1016/0006-8993(81)90064-0. [DOI] [PubMed] [Google Scholar]
- van der Meer MA, Knierim JJ, Yoganarasimha D, Wood ER, van Rossum MC. Anticipation in the rodent head direction system can be explained by an interaction of head movements and vestibular firing properties. J Neurophysiol. 2007;98:1883–1897. doi: 10.1152/jn.00233.2007. [DOI] [PubMed] [Google Scholar]
- van Groen T, Wyss JM. The postsubicular cortex in the rat: characterization of the fourth region of the subicular cortex and its connections. Brain Res. 1990;529:165–177. doi: 10.1016/0006-8993(90)90824-u. [DOI] [PubMed] [Google Scholar]
- Vann SD, Aggleton JP. Testing the importance of the retrosplenial guidance system: effects of different sized retrosplenial cortex lesions on heading direction and spatial working memory. Behav Brain Res. 2004;155:97–108. doi: 10.1016/j.bbr.2004.04.005. [DOI] [PubMed] [Google Scholar]
- Vogt BA, Miller MW. Cortical connections between rat cingulate cortex and visual, motor, and postsubicular cortices. J Comp Neurol. 1983;216:192–210. doi: 10.1002/cne.902160207. [DOI] [PubMed] [Google Scholar]
- Wiener SI, Taube JS. Head direction cells and the neural mechanisms of spatial orientation. Cambridge, MA: MIT; 2005. [Google Scholar]
- Zhang K. Representation of spatial orientation by the intrinsic dynamics of the head-direction cell ensemble: a theory. J Neurosci. 1996;16:2112–2126. doi: 10.1523/JNEUROSCI.16-06-02112.1996. [DOI] [PMC free article] [PubMed] [Google Scholar]
- Zugaro MB, Tabuchi E, Fouquier C, Berthoz A, Wiener SI. Active locomotion increases peak firing rates of anterodorsal thalamic head direction cells. J Neurophysiol. 2001;86:692–702. doi: 10.1152/jn.2001.86.2.692. [DOI] [PubMed] [Google Scholar]