

Abstract
Aging induces morphological changes of the kidney and reduces renal function. We analyzed the low molecular weight urinary proteome of 324 healthy individuals from 2-73 years of age to gain insight on renal aging in humans. We observed age-related modification of secretion of 325 out of 5000 urinary peptides. The majority of these changes was associated with renal development before and during puberty, while 49 peptides were related to aging in adults. Of these 49 peptides, the majority were also markers of chronic kidney disease, suggesting high similarity between aging and chronic kidney disease. Blinded evaluation of samples from healthy volunteers and patients with diabetic nephropathy confirmed both the correlation of biomarkers with age and with renal disease. The identification of a number of these age-related peptides indicates modified proteolytic activity and modified uromodulin targeting being involved in human renal aging. Finally, among the 324 supposedly healthy individuals, some had urinary age-related peptide excretion patterns typical of an individual significantly older than their actual age. In conclusion, the age-related biomarkers identified here may allow non-invasive detection of renal lesions in healthy persons, suggest new mechanisms of human aging and show high resemblance between human aging and human chronic kidney disease.
Introduction
The kidney shows a quantifiable decrease in function with age (1). The glomerular filtration rate declines with 20-25% from 40 to 80 years of age. Furthermore, the capacity of the kidney to concentrate urine reduces progressively with age (2). This has been linked, using kidney tissue obtained before transplantation and on autopsies of subjects not known to have a renal disease, to a significant increase with age of the number of sclerotic glomeruli and the amount of interstitial tissue (3-5). Furthermore, microarray analysis of gene expression has shown that out of 447 age-regulated genes, 49 specifically encode protein components of the extracellular matrix, corroborating these histological observations (6). It is important to understand and detect changes in renal function and structure that normally occur with aging, and to distinguish these changes from alterations that take place with disease. A better understanding of factors associated with the development of age related changes in the kidney may provide insight into factors important in the pathogenesis of chronic renal failure. The major drawback of the above mentioned studies is that data on age-related changes in renal structure and gene-expression could only be obtained from biopsies and therefore cannot be extended or applied to the general ‘healthy’ population.
Since the very first clinical observation of kidney diseases, it has been suspected that the urinary protein content can reflect the pathophysiological changes in the kidney. Therefore, detailed analysis of the urinary proteome might also be informative on the physiological changes in the aging kidney. However, detailed high resolution analysis of urinary proteins and peptides has become possible only recently. The analysis of the urinary proteome by mass spectrometry aiming at the discovery of biomarkers useful in clinical settings is now a rapidly advancing field of research (7, 8). This type of translational research has already lead to the discovery and validation of diagnostic or prognostic panels of biomarkers in renal disease (9, 10), but also in non-renal disease such as urothelial cancer (11), prostate cancer (12), and graft versus host-disease (13). We have used capillary electrophoresis coupled to mass spectrometry (CE-MS) to study the low molecular weight urinary proteome and define peptide markers for a variety of human renal diseases including diabetic nephropathy, IgA-nephropathy, obstructive uropathy, acute tubulointerstitial rejection, focal-segmental glomerulosclerosis, membraneous glomerulonephritis, systemic lupus erythematosus, and minimal change disease (7, 9, 10, 14-18) and the above mentioned non-renal diseases (11-13). In these studies, age-matched controls were used yielding biomarker peptides that are disease specific but may be applicable only in the age-range for which these studies were designed.
In the current study, we have investigated age-related changes of the low molecular weight urinary human proteome in 324 healthy individuals ranging from 2-73 years to obtain insight on renal aging in humans. The most important observation was the high similitude of urinary markers of aging with urinary markers of chronic renal disease. Furthermore, this analysis led us to propose two potential new processes involved in ageing: modified proteolytic activity and modified uromodulin targeting. Finally we observed the presence of supposedly healthy individuals with urinary age-related peptide secretion patterns that were older than their natural biological age.
Results
We obtained urine samples from 324 supposedly healthy individuals ranging from ages between 2-73 years. These individuals were divided into six age groups (Figure 1). CE-MS analysis was used to study the low molecular weight urinary proteome of each individual. CE-MS analysis coupled to software solutions allows assignment of a reproducible migration time and a precise mass to each detectable urinary peptide without the necessity of peptide sequence information (11, 15, 19, 20), creating the possibility of inter-individual comparisons. The individual, with MosaVisu (21) preprocessed and matched against our database, CE-MS export data files for every sample in the study are accessible at http://www.mosaiques-diagnostics.com/AgeingCEMSdata.rar (the password to extract the data is MosaAR08). These individual urinary peptide data were compiled into the six age-groups (Figure 2). Upon visual inspection, no clear differences between the age groups are apparent. However, statistical analysis using an ANOVA model (see Materials and Methods) allowed the selection of 325 peptides that were related to age (Supplementary Table I). The secretion patterns of these 325 peptides showed an overall tendency of decreased abundance with increasing age. This is better observed upon color coding of the abundance of these 325 peptides in all individuals included in the study, yielding a molecular profile of kidney aging (Figure 3). Upon examination of this heatmap, the largest changes can be observed in the age-range between 11 and 18 years. Before the age of 11, the levels of the different peptides appear comparable. However, in the next age group (11 to 18), distinct changes in abundance are observed. Around the age of 19, the secretion levels are again changing and appear to remain stable until the age of 60. These sudden changes in urinary polypeptide composition before the age of 19 might be related to puberty. This suggests that these early changes in the urinary proteome originate merely from (kidney) development rather than from renal aging. Furthermore these pronounced changes in the urinary proteome of the adolescent might mask more subtle, aging induced, changes in the older population. This led us to examine the 218 individuals from the 19-73 age groups separately from the juvenile. Using the same ANOVA model as for the analysis of the entire age range, we obtained a separate set of 49 biomarkers (Figure 4, Supplementary Table II) that significantly changed with age in the age range from 19 to 73. The most striking observation is absence of a number of peptides in the very old individuals (Figure 4, in blue at the left of the figure), although this tendency was already visible in the heatmap of the entire age range (Figure 3). Examination of this heatmap suggests the existence of some outliers with unusual secretion profiles (Figure 4). For example, individuals x and y seem to have urinary proteomes which depicts them older than their natural ages, as their secretion profiles shows significantly reduced levels of several peptides (blue) in comparison to neighboring individuals. This thus suggests that in the supposedly healthy population without apparent disease, some individuals have kidneys with a renal age that is significantly older than their actual biological age. This observation was not completely unexpected as upon transcriptional profiling of the aging kidney of a population of 74 individuals from 27 to 92 years, outliers, i.e. patients with older expression profiles than their biological age have also been observed (6).
Figure 1. Age distribution and gender of the different individuals included in the study.
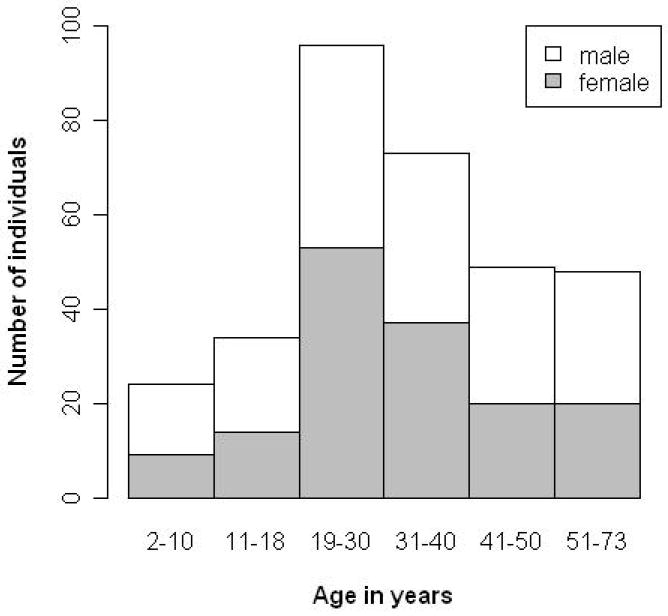
324 randomly selected supposedly healthy individuals (no known history of (chronic) disease) were included in the study. As can be seen from the figure, distribution of individuals and gender is not even, but analysis of an age and gender balanced population did not modify the selection of age-related peptides.
Figure 2. 3D patterns of digitally compiled CE-MS data for urinary peptides from different age groups.
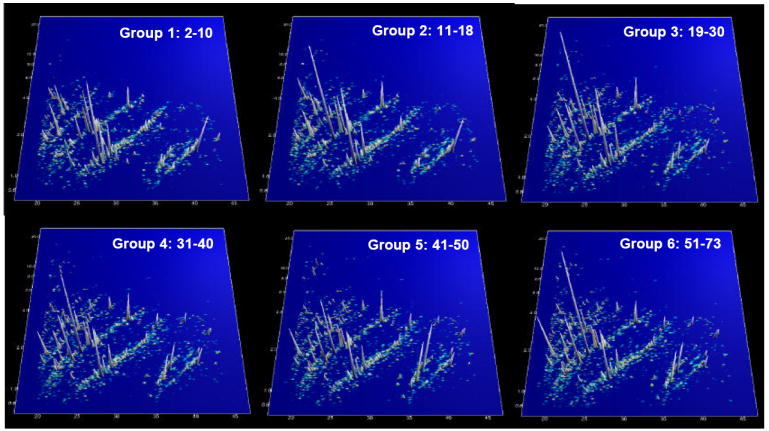
CE-MS analysis was used to study the low molecular weight urinary proteome of each of the 324 individuals. Each detectable urinary peptide was assigned a reproducible migration time and a precise molecular mass without the necessity to know the underlying peptide sequence. The graphs represent the compilation of the urinary polypeptide secretion of all individuals in a specific age group. No apparent differences can be observed upon visible inspection, the data appear very similar at first sight. However, closer examination using an ANOVA model revealed that the secretion of 325 peptides was modified during aging (see supplementary Table I).
Figure 3. Secretion of the 325 age related urinary peptides as a function of age.
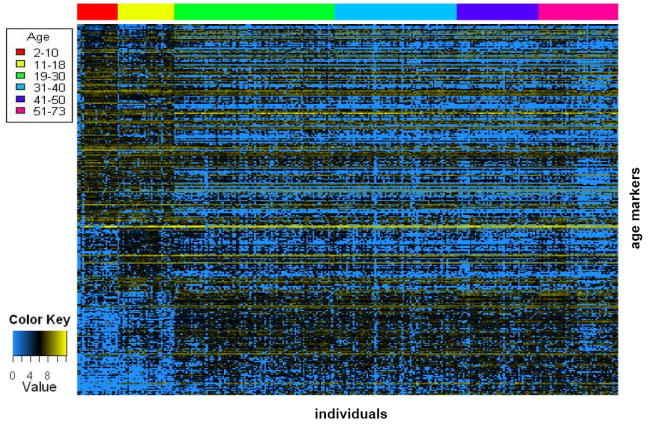
Rows correspond to the age-regulated peptides that are ordered from the highest to the least expressed in the young. Columns correspond to individual patients, ordered from the youngest to the oldest. A color code at the top of the figure is used to identify the different age groups of the study. The largest changes in secretion are observed in the age-range between 11 and 18 years. This led us to examine the 19-73 age groups separately from the youthful as the changes in the youthful might mask more subtle changes in the remaining groups (see Figure 4, for this analysis)
Figure 4. Secretion of 49 age related urinary peptides in the 19-73 age range.
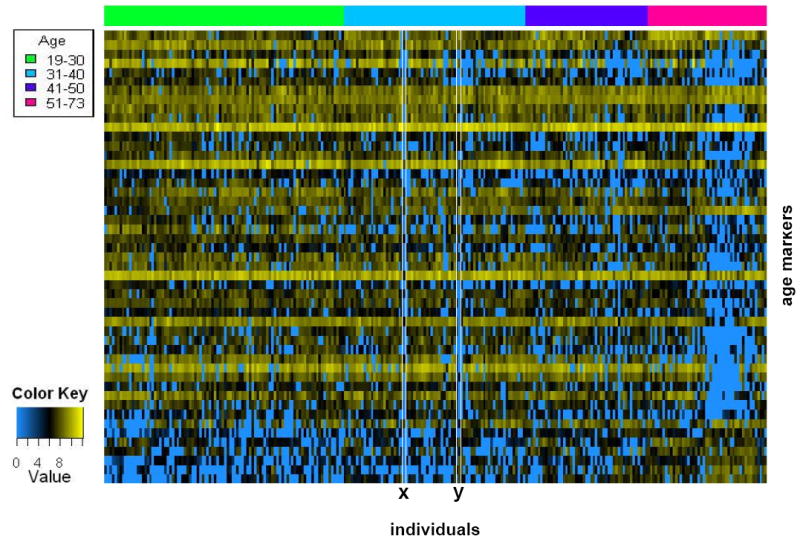
Applying the ANOVA model on 19-73 age groups identified 49 age related markers (supplementary Table II). These age markers and their secretion in the 218 individuals are displayed as described in the legend of Figure 3. Visual inspection suggests the existence of outliers (x, y).
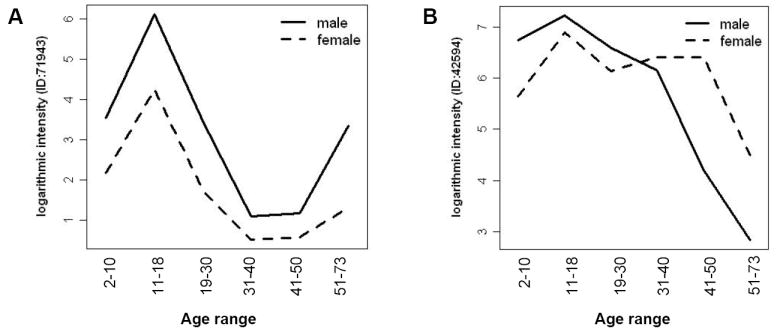
Although CE-MS analysis allows assignment of a reproducible migration time and a precise mass to each detectable urinary peptide (11, 15, 19, 20), it does not give information on the underlying molecular changes of aging. We therefore sequenced a number of the age related peptides from both the complete 2-73 and the 19-73 age range analyses (Supplementary Table I and II) using tandem mass spectrometry. The profiles of some of these sequenced peptides from the 2-73 age range are displayed in Figure 5. Interestingly, the majority of the identified peptides are fragments of collagen α1 type I and uromodulin. The urinary secretion of these collagen type I fragments is decreasing with age (see Figure 5A for typical examples of these secretion profiles). This was also observed for the 19-73 age range (Supplementary Table II). In contrast to these collagen type I fragments, the urinary secretion of the different uromodulin fragments increased with age (Figure 5B).
Figure 5. Examples of secretion profiles of identified urinary age-markers over the 2-73 year age range.

(A) Modification of secretion of collagen α1 type I fragments with age. Overall, urinary collagen type I fragment secretion (Supplementary Table I) decreased with age. Collagen type I secretion profiles were similar in 19-73 age-range analysis. (B) Three age-related peptides were identified as uromodulin fragments. Their secretion increased with age. Uromodulin fragments were not sequenced among the age-related peptides of the 19-73 age-range analysis. The mean ± SEM logarithmic intensities are given.
As the age-induced changes in the kidney might resemble those observed in a number of chronic kidney diseases (CKD), we determined which of the 49 age-related peptides obtained from the 19-73 age range analysis were also markers of CKD, which were defined in previous studies (14, 16-18, 22-24). The CKDs included vasculitis, minimal change disease (MCD), diabetic nephropathy, IgA-nephropathy (IgAN), focal-segmental glomerulosclerosis (FSGS) and membranous glomerulonephritis (MGN). Interestingly, we found that between 4.1% (IgAN), and 22.4% (diabetic nephropathy) of the age-related peptides were also markers of CKD (Table I). In total, 73% of the age related biomarker peptides were also markers of CKD suggesting the existence of similar mechanisms in the aging and pathological process.
Table I.
The percentage of age-related biomarkers (supplementary Table II) that were also markers of chronic renal disease (CKD).
| Disease | % of age markers | mean age | SD | Patient number |
|---|---|---|---|---|
| Diabetic nephropathy | 22.4 | 51.4 | 7.92 | 29 |
| IgAN | 4.1 | 54.6 | 9.47 | 18 |
| FSGS | 14.3 | 59.6 | 13.06 | 19 |
| MGN | 8.2 | 53.45 | 11.40 | 21 |
| Vasculitis | 8.2 | 66.5 | 6.73 | 22 |
| MCD | 16.3 | 55.75 | 12.67 | 16 |
This striking similarity between age- and disease-markers, especially diabetic nephropathy, led us to develop a urinary biomarker-based model to estimate “renal” age in diabetic patients independently from real biological age. The model was developed by evaluating the proteome data of urine samples from 96 healthy individuals between 19-30 years old in comparison to those from 48 healthy individuals between 51-73 years old. This resulted in the tentative identification of 180 potential biomarkers of high statistical significance (p<0.05 after adjustment for multiple testing). A number of these biomarkers have been sequenced and are shown in supplementary Table III. As the number of potential age-related biomarkers used in our models for age assessment by far exceeded the number of samples in the available training set, we sought to reduce the number of such potential biomarkers by only accepting biomarkers that showed a monotone distribution when examining all 4 age groups. This resulted in a list of 87 remaining peptides. To further reduce the number of peptides used for this classification purposes, we employed a take-one-out procedure. This resulted in a list of 13 peptides (indicated in bold in supplementary Table III). Transformed and calibrated logarithmic amplitudes of these 13 peptides were combined to a linear model as described (25). The model was evaluated by examining the intermediate age groups and allowed correct positioning of the training groups (Figure 6A). Subsequently, this model was further validated on independent test sets of apparently healthy individuals with a mean age of 50 and 75 years (Control_1 and Control_2), and individuals with diabetes mellitus (DM), either normoalbuminuric (Normo_DM) or macroalbuminuric (Macro_DM) (Figure 6B). Control group_1 and both DM patient groups (normoalbuminuric (Normo_DM) and macroalbuminuric (Macro_DM)) have comparable mean real ages (Figure 6B, inset, p-values of 0.3429 and 0.4818). However, when using the model for renal age, the macro_DM group scored significantly differently from the Control_1 and Normo_DM groups (p=0.0165 and 0.003, respectively). This suggests that diabetic individuals with macroalbuminuria have kidneys significantly “older” than their real biological age, corresponding to the renal lesions generally observed in diabetic macroalbuminuric patients. Interestingly, the normoalbuminuric diabetic patients scored comparable to their real age (p=0.6869 for the comparison Control_1 and Normo_DM) suggesting that the differences observed between normo- and macroalbuminuric-diabetic patients originate from the progression of the renal damage and not from the diabetes mellitus. This “old” renal age of macroalbuminuric DM patients is further confirmed as these individuals score in the same way as older people (Control_2 group (mean age 75.3 year)). These two groups showed a p-value of <0.0001 as to their real age, but are not significantly different as to their renal age (p=0.5969). This masked assessment of renal age in diabetic patients thus further suggests that lesions in renal disease, at least in diabetic nephropathy, are similar to age-induced renal modifications.
Figure 6. Estimation of renal age using a linear classification model.

(A) The model was built using the age groups 19-30 and 51-73 and validated over the complete 19-73 age range (training set). (B) The linear model was subsequently validated on two independent healthy control populations (Control _1 (mean age 50) and Control_2 (mean age 75.3)) and used to predict the renal age of normoalbuminuric and macroalbuminuric diabetic patients (test set). The linear model yields a weighted value of the renal age of each individual; this is displayed in the box-and-whisker-plots for a particular group. This allows comparison of the distribution of the estimated renal age of the individuals between the different age- or disease-groups. The inset shows the result of the statistical analysis of the independent masked test set using a Mann-Whitney analysis. This show that the linear model allows correct classification of the independent control groups. The Control_1 group was estimated to be similar to the Normo_DM group, which are indeed similar in natural age (p-value 0.6869). In contrast, the Control_2 group was estimated as “old” by the linear model corresponding to its natural age. Interestingly, the macroalbuminuric diabetic group scored significantly older then its natural biological age.
Finally, in order to analyze how the gender factor may confound our definition of the age markers, we considered the full 2-73 age-range model, adopting a balanced design (see Materials and Methods). Eleven of 209 (out of the initially defined 325 markers; the reduction in numbers is due to the decrease of statistical power as a result of the balanced design) age-related peptides were found to be significantly different between females and males without interaction between these two factors (age and gender). Thirteen of the 209 age-related peptides investigated showed a significant interaction between age and gender, but no significant modification with gender only (Supplementary Table IV). No significant gender effect on the other 185 peptides could be observed.
Discussion
The main observations in this study are the high similitude of urinary markers of aging with urinary markers of chronic renal disease, the identification of two potential new processes involved in human aging, and the presence of supposedly healthy individuals with urinary age-related peptide secretion patterns that were older than their natural biological age. In addition, this analysis will also allow better definition of potential biomarkers of disease not masked by age-effects on the biomarker distribution. Under physiological conditions, it has been estimated that the urinary protein content originates approximately 70% from the kidney and the urinary tract, while 30% is derived from plasma (26). Therefore, the changes in the composition of urinary protein fragments observed with increasing age in our study most probably mainly reflect the changes in the kidney.
Of 209 peptides that were modified with age, only a minority (eleven) were also modified by gender and only thirteen showed an interaction between gender and age. This limited effect of gender on the presence of age-related modification of the urinary proteome is mirroring the absence of differences between men and women during aging on the lesions observed on kidney biopsies (4, 5) or on glomerular size (27).
Age-effects on urinary collagen fragment secretion
The main histological observations that accompany the fall in glomerular filtration rate in the aging population are glomerular sclerosis and increases in interstitial tissue (2-5), i.e. expansion of the extra cellular matrix (ECM). Under physiological conditions, the ECM is thought to be maintained by an equilibrium of synthesis and degradation which is disturbed during (chronic) renal disease (28). We observed that age is modifying the occurance of a number of urinary fragments of collagen α1 type I. As these peptides are naturally occurring collagen fragments, i.e. not generated artificially by trypsin digestion, these urinary peptides represent the proteolytic activity in the kidney (29). We propose that the decrease in urinary collagen type I fragments with increasing age reflects a decrease in the activity of the renal proteolytic enzymes that is accompanied with increased renal ECM accumulation in the elderly. A number of matrix metalloproteinases (MMP) have been described to be expressed both under physiological and pathological conditions in the kidney (30, 31). Modification of the expression and activity of these proteolytic enzymes, MMPs, has been observed in animal models of aging (32-36) accompanied by increases in ECM deposition in the kidney (35, 37-39). More specifically, it was shown that the expression of membrane type-1-MMP, a collagen type I degrading MMP is reduced in the aging rat (34). Furthermore, in the aging rat it was shown that collagen type I mRNA was increased and MMP-1 (a collagen type degrading enzyme) protein decreased (35). In addition, studies on autopsy kidneys from individuals ranging from 19-92 years have shown increased collagen type I deposition, but no modification of collagen type I mRNA levels with increasing age (40) suggesting the reduction of the activity of ECM degrading enzymes. These studies and our current report thus propose that reduced proteolytic activity for collagen type I in the elderly human population leads to increased renal ECM accumulation, but to a reduction in urinary collagen type I fragments.
In contrast to the decrease of urinary collagen type I fragments, we observed an increase of urinary uromodulin fragments in the aging population. These fragments are located in the C-terminal region of uromodulin (“pep-uromod”) that is cleaved-off upon transformation of membrane bound-uromodulin to free uromodulin (“prot-uromod”, detected as a 80 kDa protein in urine) (41). The amount of urinary prot-uromod was observed to be decreased with age (42, 43) and in renal disease (44, 45). The difference between urinary prot-uromod and pep-uromod in aging might be explained by differences in targeting of uromodulin to either the apical or basolateral membranes of the epithelial cells in the thick ascending limb, as it has been shown that mutations of uromodulin in familial juvenile hyperuricemic nephropathy (FJHN) can lead to increased plasma prot-uromod levels and decreased urinary excretion (46). In analogy we hypothesize that increased secretion of uromodulin during aging and modified targeting of the free prot-uromod leads to increased urinary pep-uromod and decreased prot-uromod. This modified intracellular targeting of free prot-uromod might contribute to the establishment of renal lesions in aging similarly to FJHN, although this remains to be established.
In conclusion, sequencing of age-related urinary peptides has allowed to identify two potential processes in human renal aging; modified proteolytic activity and modified uromodulin targeting.
Age-related urinary polypeptides are also urinary markers of chronic kidney disease
(Renal) disease is often exacerbated in the elderly (47, 48) and the decline in renal function with age is frequently without clinical significance until an acute or chronic illness further impairs the functional reserve (1, 48). This is also observed in animal models of aging. For example, in the context of the expansion of the ECM as described above, membrane type-1 metalloproteinase (MT1-MMP) expression is reduced in kidneys of old rats and its expression is even lower in old long-term diabetic animals which is associated to thickening of the glomerular basement membrane in long term diabetic animals (34). Therefore, the age-induced changes in the kidney might resemble, or even be identical, to those observed in a number of renal diseases, which may be viewed as “amplified aging” under pathological conditions. We support this hypothesis with our current analysis of the low molecular weight human urinary proteome of both supposedly healthy individuals and patients with CKD, as we observed that 73% of the age-related peptides were also markers of chronic renal disease. Diabetic nephropathy accounted for the highest number of disease peptides in common with aging (22%, Table I). This led us to estimate the renal age of patients with diabetic nephropathy using the urinary age-markers. Diabetic nephropathy patients scored significantly older in this blinded assessment than the apparently healthy and non macroalbuminuric diabetic individuals. This further supports the above hypothesis that age-related changes are highly similar to disease related changes.
The field of urinary biomarkers in kidney disease is expanding rapidly (7, 26), and most studies that were setup to detect these urinary markers used age-matched controls. This makes these biomarkers suitable for the detection of a specific disease in the selected age range, but does not automatically allow for application of such marker in a larger population, as our results showed that more than 73% of the age-related peptides were also markers of chronic renal disease. This is especially true for diabetic nephropathy, as 22% of the age-markers were markers of diabetic nephropathy (Table I). Therefore, as the incidence of type II diabetic nephropathy, long reserved for the older population, is currently also rising in the young (49), urinary biomarkers of diabetic nephropathy (50) need to be validated over the whole age range. The combination of the current study on aging in the healthy population and the availability of a database (24) of low molecular weight urinary markers of a variety of renal diseases already allows to distinguish between age- and disease-induced urinary biomarkers using the CE-MS technology.
Outliers
When displaying the levels of age-related markers in all the supposedly healthy individuals included in this study, we observed that some of them do not have a urinary polypeptide secretion profile that correlated with their natural age (Figure 4). For example, individuals x and y in Figure 4 fell in the 31-40 age-range, but had a secretion profile as though these individuals were older. This suggests that these supposedly healthy individuals have accumulated a degree of renal lesions not corresponding to their real biological age. These types of discrepancies between an individual’s age and the individual’s kidney-age was also observed in a transcriptional analysis of the aging human kidney performed on transplantation biopsies or nephrectomy patients (6). In this study, these age discrepancies correlated with the presence of renal lesions determined by histological analysis. Therefore, similar discrepancies seen in our urinary proteome analysis might also reflect the presence of renal lesions. As we have chosen random samples for this study, supposedly healthy individuals with no medical history, we do not have biopsies to verify the presence of renal lesion in these individuals. We are currently setting up a study on a large number of living renal transplant donors to verify this hypothesis and compare the degree of renal lesions (histology using transplantation biopsy) with the presence of urinary markers of aging.
The obvious advantage in routine medicine of a urinary based analysis compared to the transcript analysis on biopsies is the easy and non-invasive availability of urine. Therefore, if we confirm that the urinary proteome is indicative of the renal age and thus health status of the kidney, a first application might be in the field of living donor kidney transplantation. As the number of older kidney donors is increasing, not necessarily leading to increased survival of the recipients when comparing to non transplanted ESRD patients (51), it becomes important to evaluate non-invasively the health status of the kidney of these donors. This is not only of capital importance for the recipient, but also for the donor as uninephrectomy of patients that already have substantial kidney damage may hasten the aging process in the remaining kidney (48). So, analysis of the urinary proteome before transplantation, complementing the current panel of analyses, might comfort the decision to donate a kidney or refrain from donation. Another issue where non-invasive analysis of the kidney health status in the aging population might useful is before administration of drugs with nephrotoxic side-effects such as (radio contrast media, aminoglycosides, certain chemotherapies, etc.) that can lead to acute renal failure (ARF, (52)). In the older population, the incidence of ARF is increased, favored by the above mentioned histological and functional changes of the aging kidney, reduced capability of metabolizing drugs, and high prevalence of systemic diseases like diabetes mellitus, hypertension, and heart failure (53). This reduced functional reserve might not be detectable nor with great functional consequence in the general elderly population, but might make these individuals prone to the effects of drugs which are known to be nephrotoxic. As we have shown that we are able to detect age-markers that are also markers of CKD, urinary proteome analysis might also be able to detect the individuals with substantial kidney damage, reduced functional reserve and therefore prone to ARF when on potential nephrotoxic drugs.
In conclusion, this low molecular weight urinary proteome profile of human aging can provide clues on the mechanisms of aging, strongly suggests high similarity between aging and disease, will be the basis for the definition of age-independent urinary markers of renal disease, and might allow in the near future to non-invasively detect the presence of renal lesions in the healthy population and therefore detect an individuals’ suitability to donate a kidney or predict its response to nephrotoxic drug treatment.
Methods
Sample collection
All samples for CE-MS analysis were from spontaneously voided midstream of the second morning urine and were stored at -20°C until analysis. 324 apparently healthy individuals (no known history of (chronic) disease) were included in the study. Consent was obtained from all individuals or from their parents. Figure 1 shows the number of individuals in each group and the gender distribution. The data were divided in 6 different age groups (group 1: 2-10 years (n=24), group 2: 10-18 years (n=34), group 3: 19-30 years (n=96), group 4: 31-40 years (n=73), group 5: 41-50 years (n=49), and group 6: >51 years (n=48)).
Sample preparation
For proteomic analysis, a 0.7 mL aliquot was thawed immediately before use and diluted with 0.7 mL 2 M urea, 10 mM NH4OH containing 0.02 % SDS. To remove proteins of higher molecular mass, the sample was filtered with Centrisart ultracentrifugation filter devices (20 kDa molecular weight cut-off; Sartorius, Germany) at 3,000 g until 1.1 ml of filtrate was obtained. The filtrate was then applied onto a PD-10 desalting column (Amersham Bioscience, Sweden) equilibrated in 0.01% NH4OH in HPLC-grade water to remove urea, electrolytes and salts. Finally, all samples were lyophilized, stored at 4°C, and resuspended in HPLC-grade water shortly before CE-MS analysis, as described (11). The re-suspension volume was adjusted to 0.8 μg/μL, according to the polypeptide content of the sample as measured by BCA assay (Interchim, Montlucon, France).
CE-MS analysis and data processing
CE-MS analysis was performed with a P/ACE MDQ capillary electrophoresis system (Beckman Coulter, USA) coupled online to a Micro-TOF MS (Bruker Daltonic, Germany) as described (11). Performance of the analytical method has been validated and described in detail (11, 54). Mass spectral ion peaks representing identical molecules at different charge states were deconvoluted into single masses using MosaiquesVisu software (11) (www.proteomiques.com). MosaiquesVisu employs a probabilistic clustering algorithm and uses both isotopic distribution as well as conjugated masses for charge-state determination of polypeptides. CE-migration time and ion signal intensity were normalized based on reference signals of 200 abundant “housekeeping” polypeptides generally present in urine, which serve as internal standards (11, 12) These “internal standards” were present in at least 90% of all urine samples with a relative standard deviation less than 100%. For calibration, a weighted regression was performed. The resulting peak list characterizes each polypeptide by its molecular mass [Da], normalized CE migration time [min], and normalized signal intensity.
Statistical analysis
To identify markers showing statistically significant changes in abundance with age and/or gender, we used an ANOVA model. We opted for ANOVA rather than a linear regression model because it was not plausible from the data that the change in the abundance of the markers follows a linear model with age. We divided the individuals into six groups and used a fixed effect model ANOVA: Aijk= μ + aik + ßik + (aß)ijk + eijk. On the left hand of this equation Aijk represents the logarithmic expression of the marker k, i = 1 .. 6 is the number of levels of the age factor and j=0,1 are the levels of the gender factor. On the right hand side of the equation, μ stands for the overall mean effect, aik is the effect of the level i of the age factor on the marker k, ßjk is the one corresponding to the effect of the level j of the gender factor on the marker k, (aß)ijk is the interaction term between these two factors, and eijk is the term accounting for the random error. We refer to this model as the full one. For a general definition of an age marker, a sub model where the gender information is blinded has been considered. In this sub model, the number of subjects per group was allowed to change. In the full model, we opted for a balanced design in the six groups in order to insure total decomposition of the sum of squares. We checked that resulting balanced design did not result in major decrease in statistical power.
To verify that the ANOVA model assumptions are not violated, we tested for variance equality between the six groups using the Levene-Test and checked that the error distributions were not highly skewed (Supplementary Table I). P-values of this test that are smaller than 0.05 suggest the rejection of the equal variance hypothesis across the groups. Simulation studies, however, show that the ANOVA inferences are still valid as soon as the ratio of the largest treatment variance to the lowest one does not exceed 3 (a condition that holds for all the age markers). To test if the deviation from normality did alter significantly the defined age markers set, we checked out the Van Der Waerden normal score test results and found that it leads to a similar group of age related markers. Note that the advantage of the Van Der Waerden test is that it is equivalent to standard ANOVA when normality assumptions hold and provides the robustness of the Kruskal-Wallis test when the normality assumptions are violated.
To account for multiple testing inherent to this kind of biological analysis, adjustments according to the maxT resampling procedure of Westfall and Young have been performed. This procedure allows for strong control of the family-wise error rate. From the 5010 different markers in the CE-MS database, a valid age-related marker was defined as one that is present in at least 80% of samples within one of the six groups and with an adjusted p-value of p < 0.05.
Establishing of models for age-assessment and sample classification
To identify potential biomarkers for age-assessment, we compared directly the mean of the markers between two groups (group_1 (control_19-30) and group_2 (control_51-73)). Multiple testing adjusted p-values of the t-statistics using two different statistical procedures (Benjamini-Hochberg and Benjamini-Yakutieli (55, 56)) were employed. Additional age groups (control_31-40 and control_41-50) were used as test sets for the validation of the model. Further reduction of the number of variables (potential biomarkers) was achieved by utilizing a take-one-out cross validation procedure (23).
For classification, amplitude values below 1 were substituted with a value of 1 to avoid negative values. The average signal intensity for a specific biomarker in one group was compared to the average intensity for the same biomarker in the other group. To avoid artificial weighting of specific biomarkers in the set due to the difference in observed signal intensities for the two groups investigated, the relative distance between the two averages (e.g. group_1 (control_19-30) and group_2 (control_51-73)) was compared, with the distance between these averages always being set to two. This relative distance of signal intensities between the two groups was calibrated using the formula: , where Aki is the log-transformed signal intensity of the ith biomarker in the kth sample, meanaverages is the average of the mean intensity of all potential markers, x̄group _ 1 represents the mean observed signal intensity of the potential biomarker from all samples in one group and x̄group _ 2 represents the mean signal intensity of the potential biomarker in the other group.
Sequencing of polypeptides
Candidate biomarkers and other native peptides from urine were sequenced using an Ultimate 3000 nanoflow system (Dionex/LC Packings, USA) connected to an LTQ Orbitrap hybrid mass spectrometer (Thermo Fisher Scientific, Germany) equipped with a nanoelectrospray ion source. The mass spectrometer was operated in data-dependent mode to automatically switch between MS and MS/MS acquisition. Survey full-scan MS spectra (from m/z 300–2,000) were acquired in the Orbitrap. Ions were sequentially isolated for fragmentation in the linear ion trap using collisionally induced dissociation. General mass spectrometric conditions were: electrospray voltage, 1.6 kV; no sheath and auxiliary gas flow; ion transfer tube temperature, 225 °C; collision gas pressure, 1.3 mT; normalized collision energy, 32% for MS2. Ion selection threshold was 500 counts for MS/MS.
Samples were also analyzed using Electron Transfer Dissociation (ETD) (57, 58). Peptides were separated by nRP-HPLC (Agilent 1100; flow split by tee to ~60 nL/min) and introduced into an ETD-capable Finnigan LTQ quadrupole linear ion trap via nESI, using previously established reaction parameters (59).
All resulting MS/MS data were submitted to MASCOT (www.matrixscience.com) for a search against human entries in the MDSB Protein Database. Accepted parent ion mass deviation was 50 ppm; accepted fragment ion mass deviation was 500 ppm. All search results with a MASCOT peptide score better than 20, depending on the ion coverage as related to the main spectra features. Data files coming from ETD experiments were also searched against the NCBI human non-redundant database using the Open Mass Spectrometry Search Algorithm (OMSSA), with an e-value cut-off of 0.01. The number of basic and neutral polar amino acids of obtained peptide sequences was utilized to correlate peptide sequencing data to CE-MS data as described earlier (20).
Supplementary Material
Figure 7. Gender differences in the secretion of aging markers.
(A) Both aging and gender contribute to differences in urinary secretion of this peptide. p=0.0091 for gender, p=0.0013 for age groups, and p=0.88 for the interaction between gender and age. (B) Secretion of this urinary peptide is differentially modified with age in males and females. p=0.33 for gender, p=9.5e-06 for age groups and p=0.005 for the interaction between gender and age. This analysis was based on an age and gender balanced population (see Materials and Methods). See also supplementary Table IV.
Acknowledgments
This work was supported in part by grant #0312939 from BioProfil ‘Funktionelle Genomanalyse’, by grant #203.19-32329-5-461 from the Lower Saxony Ministry of Economy, by grant #ETB-2006-016 to the Urosysteomics consortium (www.urosysteomics.com), and by grants #LSHM-CT-2005-018733 (PREDICTIONS) and #LSHM-CT-2006-037093 (InGenious HyperCare) from the European Union. The work of JPS was supported by Inserm, the “Direction Régional Clinique” (CHU de Toulouse, France) under the Interface program and by the Fondation pour la Recherche Médicale. The work of SD was sponsored by the Inserm Interface program. DMG gratefully acknowledges support from a pre-doctoral fellowship, the Biotechnology Training Program (NIH 5 T32 GM08349). JJC acknowledges the financial support from the University of Wisconsin, the Beckman Foundation, Eli Lilly, and the NIH (1R01GM080148).
References
- 1.Martin JE, Sheaff MT. Renal ageing. J Pathol. 2007;211:198–205. doi: 10.1002/path.2111. [DOI] [PubMed] [Google Scholar]
- 2.Hoang K, Tan JC, Derby G, Blouch KL, Masek M, Ma I, Lemley KV, Myers BD. Determinants of glomerular hypofiltration in aging humans. Kidney Int. 2003;64:1417–1424. doi: 10.1046/j.1523-1755.2003.00207.x. [DOI] [PubMed] [Google Scholar]
- 3.Nyengaard JR, Bendtsen TF. Glomerular number and size in relation to age, kidney weight, and body surface in normal man. Anat Rec. 1992;232:194–201. doi: 10.1002/ar.1092320205. [DOI] [PubMed] [Google Scholar]
- 4.Kasiske BL. Relationship between vascular disease and age-associated changes in the human kidney. Kidney Int. 1987;31:1153–1159. doi: 10.1038/ki.1987.122. [DOI] [PubMed] [Google Scholar]
- 5.Kappel B, Olsen S. Cortical interstitial tissue and sclerosed glomeruli in the normal human kidney, related to age and sex A quantitative study. Virchows Arch A Pathol Anat Histol. 1980;387:271–277. doi: 10.1007/BF00454830. [DOI] [PubMed] [Google Scholar]
- 6.Rodwell GE, Sonu R, Zahn JM, Lund J, Wilhelmy J, Wang L, Xiao W, Mindrinos M, Crane E, Segal E, et al. A transcriptional profile of aging in the human kidney. PLoS Biol. 2004;2:e427. doi: 10.1371/journal.pbio.0020427. [DOI] [PMC free article] [PubMed] [Google Scholar]
- 7.Fliser D, Novak J, Thongboonkerd V, Argiles A, Jankowski V, Girolami MA, Jankowski J, Mischak H. Advances in urinary proteome analysis and biomarker discovery. J Am Soc Nephrol. 2007;18:1057–1071. doi: 10.1681/ASN.2006090956. [DOI] [PubMed] [Google Scholar]
- 8.Thongboonkerd V. Practical Points in Urinary Proteomics. J Proteome Res. 2007;6:3881–3890. doi: 10.1021/pr070328s. [DOI] [PubMed] [Google Scholar]
- 9.Decramer S, Wittke S, Mischak H, Zurbig P, Walden M, Bouissou F, Bascands JL, Schanstra JP. Predicting the clinical outcome of congenital unilateral ureteropelvic junction obstruction in newborn by urinary proteome analysis. Nat Med. 2006;12:398–400. doi: 10.1038/nm1384. [DOI] [PubMed] [Google Scholar]
- 10.Julian BA, Wittke S, Haubitz M, Zurbig P, Schiffer E, McGuire BM, Wyatt RJ, Novak J. Urinary biomarkers of IgA nephropathy and other IgA-associated renal diseases. World J Urol. 2007;25:467–476. doi: 10.1007/s00345-007-0192-5. [DOI] [PubMed] [Google Scholar]
- 11.Theodorescu D, Wittke S, Ross MM, Walden M, Conaway M, Just I, Mischak H, Frierson HF. Discovery and validation of new protein biomarkers for urothelial cancer: a prospective analysis. Lancet Oncol. 2006;7:230–240. doi: 10.1016/S1470-2045(06)70584-8. [DOI] [PubMed] [Google Scholar]
- 12.Theodorescu D, Fliser D, Wittke S, Mischak H, Krebs R, Walden M, Ross M, Eltze E, Bettendorf O, Wulfing C, et al. Pilot study of capillary electrophoresis coupled to mass spectrometry as a tool to define potential prostate cancer biomarkers in urine. Electrophoresis. 2005;26:2797–2808. doi: 10.1002/elps.200400208. [DOI] [PubMed] [Google Scholar]
- 13.Weissinger EM, Schiffer E, Hertenstein B, Ferrara JL, Holler E, Stadler M, Kolb HJ, Zander A, Zurbig P, Kellmann M, et al. Proteomic patterns predict acute graft-versus-host disease after allogeneic hematopoietic stem cell transplantation. Blood. 2007;109:5511–5519. doi: 10.1182/blood-2007-01-069757. [DOI] [PubMed] [Google Scholar]
- 14.Haubitz M, Wittke S, Weissinger EM, Walden M, Rupprecht HD, Floege J, Haller H, Mischak H. Urine protein patterns can serve as diagnostic tools in patients with IgA nephropathy. Kidney Int. 2005;67:2313–2320. doi: 10.1111/j.1523-1755.2005.00335.x. [DOI] [PubMed] [Google Scholar]
- 15.Wittke S, Mischak H, Walden M, Kolch W, Radler T, Wiedemann K. Discovery of biomarkers in human urine and cerebrospinal fluid by capillary electrophoresis coupled to mass spectrometry: towards new diagnostic and therapeutic approaches. Electrophoresis. 2005;26:1476–1487. doi: 10.1002/elps.200410140. [DOI] [PubMed] [Google Scholar]
- 16.Meier M, Kaiser T, Herrmann A, Knueppel S, Hillmann M, Koester P, Danne T, Haller H, Fliser D, Mischak H. Identification of urinary protein pattern in type 1 diabetic adolescents with early diabetic nephropathy by a novel combined proteome analysis. J Diabetes Complications. 2005;19:223–232. doi: 10.1016/j.jdiacomp.2004.10.002. [DOI] [PubMed] [Google Scholar]
- 17.Mischak H, Kaiser T, Walden M, Hillmann M, Wittke S, Herrmann A, Knueppel S, Haller H, Fliser D. Proteomic analysis for the assessment of diabetic renal damage in humans. Clin Sci. 2004;107:485–495. doi: 10.1042/CS20040103. [DOI] [PubMed] [Google Scholar]
- 18.Rossing K, Mischak H, Parving HH, Christensen PK, Walden M, Hillmann M, Kaiser T. Impact of diabetic nephropathy and angiotensin II receptor blockade on urinary polypeptide patterns. Kidney Int. 2005;68:193–205. doi: 10.1111/j.1523-1755.2005.00394.x. [DOI] [PubMed] [Google Scholar]
- 19.Schiffer E, Mischak H, Novak J. High resolution proteome/peptidome analysis of body fluids by capillary electrophoresis coupled with MS. Proteomics. 2006;6:5615–5627. doi: 10.1002/pmic.200600230. [DOI] [PubMed] [Google Scholar]
- 20.Zurbig P, Renfrow MB, Schiffer E, Novak J, Walden M, Wittke S, Just I, Pelzing M, Neususs C, Theodorescu D, et al. Biomarker discovery by CE-MS enables sequence analysis via MS/MS with platform-independent separation. Electrophoresis. 2006;27:2111–2125. doi: 10.1002/elps.200500827. [DOI] [PubMed] [Google Scholar]
- 21.Neuhoff N, Kaiser T, Wittke S, Krebs R, Pitt A, Burchard A, Sundmacher A, Schlegelberger B, Kolch W, Mischak H. Mass spectrometry for the detection of differentially expressed proteins: a comparison of surface-enhanced laser desorption/ionization and capillary electrophoresis/mass spectrometry. Rapid Commun Mass Spectrom. 2004;18:149–156. doi: 10.1002/rcm.1294. [DOI] [PubMed] [Google Scholar]
- 22.Weissinger EM, Wittke S, Kaiser T, Haller H, Bartel S, Krebs R, Golovko I, Rupprecht HD, Haubitz M, Hecker H, et al. Proteomic patterns established with capillary electrophoresis and mass spectrometry for diagnostic purposes. Kidney Int. 2004;65:2426–2434. doi: 10.1111/j.1523-1755.2004.00659.x. [DOI] [PubMed] [Google Scholar]
- 23.Rossing K, Mischak H, Dakna M, Zürbig P, Novak J, Julian BA, Good DM, Coon JJ, Tarnow L, Rossing P. Proteomic discovery and evaluation of uninary biomarkers for diabetes and chronic renal disease. J Am Soc Nephrol. 2008 doi: 10.1681/ASN.2007091025. in press. [DOI] [PMC free article] [PubMed] [Google Scholar]
- 24.Coon JJ, Zurbig P, Dakna M, Dominiczak AF, Decramer S, Fliser D, Frommberger M, Golovko I, Good DM, Herget-Rosenthal S, et al. CE-MS analysis of the human urinary proteome for biomarker discovery and disease diagnostics. Proteomics Clin Appl. 2008 doi: 10.1002/prca.200800024. submitted. [DOI] [PMC free article] [PubMed] [Google Scholar]
- 25.Zimmerli LU, Schiffer E, Zurbig P, Good DM, Kellmann M, Mouls L, Pitt AR, Coon JJ, Schmieder RE, Peter K, et al. Urinary proteomic biomarkers in coronary artery disease. Mol Cell Proteomics. 2007;7:290–298. doi: 10.1074/mcp.M700394-MCP200. [DOI] [PubMed] [Google Scholar]
- 26.Thongboonkerd V, Malasit P. Renal and urinary proteomics: current applications and challenges. Proteomics. 2005;5:1033–1042. doi: 10.1002/pmic.200401012. [DOI] [PubMed] [Google Scholar]
- 27.Li M, Nicholls KM, Becker GJ. Glomerular size and global glomerulosclerosis in normal Caucasian donor kidneys: effects of aging and gender. J Nephrol. 2002;15:614–619. [PubMed] [Google Scholar]
- 28.Liu Y. Renal fibrosis: new insights into the pathogenesis and therapeutics. Kidney Int. 2006;69:213–217. doi: 10.1038/sj.ki.5000054. [DOI] [PubMed] [Google Scholar]
- 29.Good DM, Thongboonkerd V, Novak J, Bascands JL, Schanstra JP, Coon JJ, Dominiczak A, Mischak H. Body Fluid Proteomics for Biomarker Discovery: Lessons from the Past Hold the Key to Success in the Future. J Proteome Res. 2007;6:4549–4555. doi: 10.1021/pr070529w. [DOI] [PubMed] [Google Scholar]
- 30.Catania JM, Chen G, Parrish AR. Role of matrix metalloproteinases in renal pathophysiologies. Am J Physiol. 2007;292:F905–911. doi: 10.1152/ajprenal.00421.2006. [DOI] [PubMed] [Google Scholar]
- 31.Lenz O, Elliot SJ, Stetler-Stevenson WG. Matrix metalloproteinases in renal development and disease. J Am Soc Nephrol. 2000;11:574–581. doi: 10.1681/ASN.V113574. [DOI] [PubMed] [Google Scholar]
- 32.Feng Z, Plati AR, Cheng QL, Berho M, Banerjee A, Potier M, Jy WC, Koff A, Striker LJ, Striker GE. Glomerular aging in females is a multi-stage reversible process mediated by phenotypic changes in progenitors. Am J Pathol. 2005;167:355–363. doi: 10.1016/S0002-9440(10)62981-1. [DOI] [PMC free article] [PubMed] [Google Scholar]
- 33.Maric C, Sandberg K, Hinojosa-Laborde C. Glomerulosclerosis and tubulointerstitial fibrosis are attenuated with 17beta-estradiol in the aging Dahl salt sensitive rat. J Am Soc Nephrol. 2004;15:1546–1556. doi: 10.1097/01.asn.0000128219.65330.ea. [DOI] [PubMed] [Google Scholar]
- 34.Boucher E, Mayer G, Londono I, Bendayan M. Expression and localization of MT1-MMP and furin in the glomerular wall of short- and long-term diabetic rats. Kidney Int. 2006;69:1570–1577. doi: 10.1038/sj.ki.5000316. [DOI] [PubMed] [Google Scholar]
- 35.Gagliano N, Arosio B, Santambrogio D, Balestrieri MR, Padoani G, Tagliabue J, Masson S, Vergani C, Annoni G. Age-dependent expression of fibrosis-related genes and collagen deposition in rat kidney cortex. J Gerontol A Biol Sci Med Sci. 2000;55:B365–372. doi: 10.1093/gerona/55.8.b365. [DOI] [PubMed] [Google Scholar]
- 36.Ma LJ, Nakamura S, Whitsitt JS, Marcantoni C, Davidson JM, Fogo AB. Regression of sclerosis in aging by an angiotensin inhibition-induced decrease in PAI-1. Kidney Int. 2000;58:2425–2436. doi: 10.1046/j.1523-1755.2000.00426.x. [DOI] [PubMed] [Google Scholar]
- 37.Abrass CK, Adcox MJ, Raugi GJ. Aging-associated changes in renal extracellular matrix. Am J Pathol. 1995;146:742–752. [PMC free article] [PubMed] [Google Scholar]
- 38.Cruz CI, Ruiz-Torres P, del Moral RG, Rodriguez-Puyol M, Rodriguez-Puyol D. Age-related progressive renal fibrosis in rats and its prevention with ACE inhibitors and taurine. Am J Physiol. 2000;278:F122–129. doi: 10.1152/ajprenal.2000.278.1.F122. [DOI] [PubMed] [Google Scholar]
- 39.Peleg I, Greenfeld Z, Cooperman H, Shoshan S. Type I and type III collagen mRNA levels in kidney regions of old and young rats. Matrix. 1993;13:281–287. doi: 10.1016/s0934-8832(11)80023-5. [DOI] [PubMed] [Google Scholar]
- 40.Eikmans M, Baelde HJ, de Heer E, Bruijn JA. Effect of age and biopsy site on extracellular matrix mRNA and protein levels in human kidney biopsies. Kidney Int. 2001;60:974–981. doi: 10.1046/j.1523-1755.2001.060003974.x. [DOI] [PubMed] [Google Scholar]
- 41.Fukuoka S, Kobayashi K. Analysis of the C-terminal structure of urinary Tamm-Horsfall protein reveals that the release of the glycosyl phosphatidylinositol-anchored counterpart from the kidney occurs by phenylalanine-specific proteolysis. Biochem Biophys Res Commun. 2001;289:1044–1048. doi: 10.1006/bbrc.2001.6112. [DOI] [PubMed] [Google Scholar]
- 42.Calzada-Garcia JA, Perez Gonzalez MN, Benito-Andres FJ, Morales Garcia LJ, Cabezas JA, Sanchez-Bernal C. Evaluation of patterns of urinary proteins by SDS-PAGE in rats of different ages. Mech Ageing Dev. 1996;87:1–13. doi: 10.1016/0047-6374(96)01693-4. [DOI] [PubMed] [Google Scholar]
- 43.Reinhart HH, Obedeanu N, Robinson R, Korzeniowski O, Kaye D, Sobel JD. Urinary excretion of Tamm-Horsfall protein in elderly women. J Urol. 1991;146:806–808. doi: 10.1016/s0022-5347(17)37926-0. [DOI] [PubMed] [Google Scholar]
- 44.Lynn KL, Marshall RD. Excretion of Tamm-Horsfall glycoprotein in renal disease. Clin Nephrol. 1984;22:253–257. [PubMed] [Google Scholar]
- 45.Torffvit O, Jorgensen PE, Kamper AL, Holstein-Rathlou NH, Leyssac PP, Poulsen SS, Strandgaard S. Urinary excretion of Tamm-Horsfall protein and epidermal growth factor in chronic nephropathy. Nephron. 1998;79:167–172. doi: 10.1159/000045020. [DOI] [PubMed] [Google Scholar]
- 46.Jennings P, Aydin S, Kotanko P, Lechner J, Lhotta K, Williams S, Thakker RV, Pfaller W. Membrane targeting and secretion of mutant uromodulin in familial juvenile hyperuricemic nephropathy. J Am Soc Nephrol. 2007;18:264–273. doi: 10.1681/ASN.2006020158. [DOI] [PubMed] [Google Scholar]
- 47.Baylis C, Corman B. The aging kidney: insights from experimental studies. J Am Soc Nephrol. 1998;9:699–709. doi: 10.1681/ASN.V94699. [DOI] [PubMed] [Google Scholar]
- 48.Epstein M. Aging and the kidney. J Am Soc Nephrol. 1996;7:1106–1122. doi: 10.1681/ASN.V781106. [DOI] [PubMed] [Google Scholar]
- 49.Pinhas-Hamiel O, Zeitler P. Acute and chronic complications of type 2 diabetes mellitus in children and adolescents. Lancet. 2007;369:1823–1831. doi: 10.1016/S0140-6736(07)60821-6. [DOI] [PubMed] [Google Scholar]
- 50.Merchant ML, Klein JB. Proteomics and diabetic nephropathy. Semin Nephrol. 2007;27:627–636. doi: 10.1016/j.semnephrol.2007.09.003. [DOI] [PubMed] [Google Scholar]
- 51.Ruggenenti P, Perico N, Remuzzi G. Ways to boost kidney transplant viability: a real need for the best use of older donors. Am J Transplant. 2006;6:2543–2547. doi: 10.1111/j.1600-6143.2006.01519.x. [DOI] [PubMed] [Google Scholar]
- 52.Evenepoel P. Acute toxic renal failure. Best Pract Res Clin Anaesthesiol. 2004;18:37–52. doi: 10.1016/j.bpa.2003.09.007. [DOI] [PubMed] [Google Scholar]
- 53.Musso CG, Liakopoulos V, Ioannidis I, Eleftheriadis T, Stefanidis I. Acute renal failure in the elderly: particular characteristics. Int Urol Nephrol. 2006;38:787–793. doi: 10.1007/s11255-006-0084-4. [DOI] [PubMed] [Google Scholar]
- 54.Frommberger M, Zürbig P, Jantos J, Krahn T, Mischak H, Pich A, Jus I, Schmitt-Kopplin P, Schiffer E. Peptidomic analysis of rat urine using capillary electrophoresis coupled to mass spectrometry. Proteomics Clin Appl. 2007;1:650–660. doi: 10.1002/prca.200700195. [DOI] [PubMed] [Google Scholar]
- 55.Benjamini Y, Hochberg Y. Controlling the false discovery rate: a practical and powerful approach to multiple testing. J Royal Stat Soc (Series B: Methodological) 1995;57:289–300. [Google Scholar]
- 56.Reiner A, Yekutieli D, Benjamini Y. Identifying differentially expressed genes using false discovery rate controlling procedures. Bioinformatics. 2003;19:368–375. doi: 10.1093/bioinformatics/btf877. [DOI] [PubMed] [Google Scholar]
- 57.Coon JJ, Shabanowitz J, Hunt DF, Syka JE. Electron transfer dissociation of peptide anions. J Am Soc Mass Spectrom. 2005;16:880–882. doi: 10.1016/j.jasms.2005.01.015. [DOI] [PubMed] [Google Scholar]
- 58.Syka JE, Coon JJ, Schroeder MJ, Shabanowitz J, Hunt DF. Peptide and protein sequence analysis by electron transfer dissociation mass spectrometry. Proc Natl Acad Sci U S A. 2004;101:9528–9533. doi: 10.1073/pnas.0402700101. [DOI] [PMC free article] [PubMed] [Google Scholar]
- 59.Good DM, Wirtala M, McAlister GC, Coon JJ. Performance characteristics of electron transfer dissociation mass spectrometry. Mol Cell Proteomics. 2007;6:1942–1951. doi: 10.1074/mcp.M700073-MCP200. [DOI] [PubMed] [Google Scholar]
Associated Data
This section collects any data citations, data availability statements, or supplementary materials included in this article.