Abstract
The ability to pattern small molecules and proteins on artificial surfaces is of importance for the development of new tools including tissue engineering, cell-based drug screening, and cell-based sensors. We describe here a novel “caged” thiol-mediated strategy for the fabrication of planar substrates patterned with biomolecules using photolithography. A thiol-bearing phosphoramidite (3-(2’-nitrobenzyl)thiopropyl (NBTP) phosphoramidite) was synthesized and coupled to a hydroxyl-terminated amorphous carbon substrate. A biocompatible oligo(ethylene glycol) spacer was used to resist nonspecific adsorption of protein and DNA and enhance flexibility of attached biomolecules. Thiol functionalities are revealed by UV irradiation of NBTP-modified surfaces. Both the surface coupling and photodeprotection were monitored by Polarization Modulation Fourier Transform Infrared Reflection Absorption Spectroscopy (PM-FTIRRAS) and X-ray Photoelectron Spectroscopy (XPS) measurements. The newly exposed thiols are chemically very active and react readily with a wide variety of groups. A series of molecules including biotin, DNA, and proteins were attached to the surfaces with retention of their biological activities, demonstrating the utility and generality of the approach.
INTRODUCTION
Over the last decade the use of surface patterning techniques to investigate biological systems has become an increasingly active area of research.1 The ability to pattern small molecules and proteins on surfaces is of importance in areas such as tissue engineering, cell-based drug screening, and cell-based sensors.2–4 Photolithography is the most widely used approach for patterning of small molecules and proteins. The light is used to produce a desired pattern of reactive functional groups on the surface, which provide attachment sites for molecules or biomolecules of interest. There are three basic strategies for generating these functional groups: direct immobilization of functional group-containing molecules;5 photoconversion reactions on the surface to produce the functional group;6–9 or by use of “caged” functional groups, where a desired functional group is “caged” by a light-cleavable protecting group. The latter strategy has been widely used in light-directed oligonucleotide synthesis and transferred to surface patterning of small molecules, proteins, nanoparticles, and even cells over the last decades. A wide variety of functional groups such as hydroxyl,10 amine,10 oxyamine,11, 12 carboxyl,13, 14 and hydroquinone15 have been “caged” by different protecting groups including tert-butyl carbamate,11 nitroveratryloxylcarbonyl,12 nitrophenylpropyloxycarbonyl,9 and nitrobenzyl groups.10, 13, 14 Selective surface activation has been accomplished by electrochemically induced oxidation,16, 17 electrochemically generated acids,11 or UV illumination.9, 10, 12–15
One particularly versatile functional group is the thiol. Due to the large dipole moment, nucleophilicity and vacancy in the d orbital of the sulfur atom in thiol groups, thiols are chemically very active and react readily with a wide variety of groups including alkyl halides, maleimide, free thiols, disulfides, and many of the amine-reactive reagents.18 Thiols can also react with alkenes under UV irradiation or in the presence of a radical initiator to create a thioether.19, 20 However, in spite of these many desirable characteristics, thiol chemistry on surfaces has not been extensively employed.10, 16 In the present work, we describe the development of a versatile and simple chemistry for photopatterning and coupling reactions of thiols on surfaces, based upon the use of a photoprotected thiol phosphoramidite, and demonstrate its utility and generality by fabricating a variety of biomolecule-patterned surfaces.
Experimental Section
Reagents and Materials
All reagents were purchased from Sigma Aldrich and used without further purification.
3-(2’-Nitrobenzyl)thiopropanol 2
A mixture of 3-mercaptopropanol (0.47 g, 5.1 mmol), 2-nitrobenzyl bromide 1 (1.08 g, 5.0 mmol), and K2CO3 (0.69 g, 5.0 mmol) in 40 mL of dry acetone was refluxed at 80°C for 10 h under nitrogen. Ethyl acetate (100 mL) was added to the concentrated reaction mixture, and the precipitate was removed by filtration. The solvent was removed to leave a yellow oil. Purification by silica gel chromatography (2:1 ethyl acetate:hexane) gave 2 as yellow oil (0.85 g, 75%). 1H NMR (δH, 300 MHz, CDCl3, TMS) 1.81 (2H, m, CH2CH2CH2), 2.60 (2H, t, CH2CH2S), 3.74 (2H, q, HOCH2CH2), 4.10 (2H, m, SCH2Ph), 7.40–7.58 (3H, m, 4, 5, 6-Ph), 7.98–8.01 (1H, d, 3-Ph); m/z (ESI) for C10H13O3NS found 228.2 [M + H]+, 250.2 [M + Na]+, 477.4 [2M + Na]+.
3-(2’-Nitrobenzyl)thiopropyl Phosphoramidite 3
To a solution of 2 (0.445 g, 2.0 mmol) in anhydrous acetonitrile (60 mL, Glen Research, Sterling, VA) was added diisopropylethylamine (0.775 g, 6.0 mmol) and 2-cyanoethyl N,N-diisopropylchlorophosphoramidite (0.710 g, 3.0 mmol). The solution was stirred at room temperature for 24 h. Then, dichloromethane (250 mL) was added, and the solution was washed with saturated NaHCO3 solution (2 × 250 mL), and brine (2 × 250 mL). The organic phase was dried over Na2SO4 and solvent was removed. The product was purified by silica gel chromatography (column was pre-saturated with 3% triethylamine) (2:1 ethyl acetate:hexane). Purified fractions were evaporated to yield a yellow oil (0.53 g, 62%). 1H NMR (δH, 300 MHz, CDCl3, TMS) 1.15 (12H, m, CH(CH3)2), 1.83 (2H, m, CH2CH2CH2), 2.56 (2H, t, CH2CH2CN), 2.63 (2H, t, CH2CH2S), 3.60 (2H, m, CH(CH3)2), 3.74 (2H, m, OCH2CH2CN), 4.10 (2H, m, SCH2Ph), 7.40–7.58 (3H, m, 4, 5, 6-Ph), 7.95–7.98 (1H, d, 3-Ph); m/z (ESI) for C19H30O4N3SP found 428.3 [M + H]+, 450.3 [M + Na]+.
Preparation of Oligoethylene Glycol-modified Surfaces
The amorphous carbon substrates were prepared on standard glass slides (VWR, West Chester, PA). Prior to use, glass substrates were extensively rinsed with deionized water and methanol and dried under a nitrogen stream. A chromium layer (2.0 nm) followed by a gold layer (100 nm) was applied to the substrates using an Angstrom Engineering Åmod metal evaporator (Cambridge, ON). After metal deposition, amorphous carbon thin films (15 nm) were applied to the surfaces by DC magnetron sputtering (Denton Vacuum, Moorestown, NJ). Prior to photochemical functionalization, each amorphous carbon surface was hydrogen-terminated in a 13.56 MHz inductively coupled hydrogen plasma for 12 min (10 Torr H2, room temperature) to remove nitrogen and oxygen species from the amorphous carbon thin films.21 A volume of 40 µL of tetraethyleneglycol monoallylether (EG)4 (synthesized according to previous literature22) was placed directly onto the surfaces coated with amorphous carbon and covered with a quartz coverslip. The surfaces were irradiated under N2 purge with a low-pressure mercury vapor quartz grid lamp (λ = 254 nm, 0.35 mW/cm2) for 12 h. After the photoreaction, the surfaces were extensively rinsed with ethanol and deionized water, dried under nitrogen, and stored in a desiccator until use.
Preparation of NBTP-modified Surfaces
To a solution of 3 (10 µL 3 in 100 µL of anhydrous acetonitrile) was added 100 µL of activator solution (4, 5-dicyanoimidazole or 5-benzylthio-1H-tetrazole (0.25 M) in anhydrous acetonitrile, Glen Research). The mixture was placed onto the (EG)4-modified surfaces. The surfaces were incubated in the dark for up to 30 min. After phosphoramidite coupling, the surfaces were rinsed with acetonitrile and then oxidized by 0.02 M I2 in THF/Pyidine/H2O (Glen Research). After 3 min oxidation, the surfaces were extensively rinsed with ethanol, dried under nitrogen, and stored in a desiccator in dark until use.
Surface Characterization
(EG)4 and NBTP-modified substrates before and after photoirradiation were characterized with PM-FTIRRAS and XPS.23 The presence of the metal sublayer enhanced the reflectance of the sample for IR measurements and provided a conductive surface for XPS measurements. IR spectra in the 800–4000 cm−1 region were collected with a Bruker PMA 50 spectrometer with real-time interferogram sampling electronics (GWC Technologies, Madison, WI). 64 scans at 4 cm−1 resolution were collected for both the background and the sample. XP spectra were collected on a Perkin Elmer PHI5400 ESCA spectrometer with a magnesium Kα (1253.6 eV) source. Atomic area ratios were determined by fitting the raw data after Shirley baseline correction and applying predetermined atomic sensitivity factors using the CasaXPS software.
Surface Photodeprotection
Photodeprotection of NBTP-modified substrates was performed using a Maskless Array Synthesizer (MAS).24 A 350 watt mercury arc lamp (Newport, Stratford, CT) (90 mW/cm2 at 365 nm) was used as the light source and a Digital Micromirror Device (DMD) (Texas Instruments, TX) programmed with the desired locations of illumination was used to generate “virtual” masks. The DMD is a 1.7 cm × 1.3 cm electronic “chip” containing an array of 1024 × 768 tiny mirrors, each of which can be controlled independently. Photodeprotection was conducted in exposure solvent (Roche NimbleGen, Madison, WI) unless otherwise stated, which was kept flowing through the flow cell at 250 µL/min during illumination. Following irradiation, the substrates were washed with acetonitrile and dried with argon.
Immobilization and Detachment of ssDNA
Oligonucleotides used in these experiments were synthesized by Integrated DNA Technologies (Coralville, IA). A 3’-thiol-modified oligonucleotide (5’-CCA CTG TTG CAA AGT TAT T-(T)15-CH2CH2CH2S-S CH2CH2CH2OH-3’) was deprotected for 30 min in a solution of 100 mM triethanolamine (TEA), pH 7.0 containing 100 mM dithiothreitol (DTT) and purified using a NAP-10 column (GE Healthcare, Piscataway, NJ) immediately prior to use. The purified oligonucleotide was dried in vacuum and reconstituted in 100 mM TEA buffer, pH 7.0 to a final concentration of 0.5 mM (determined by adsorption at 260 nm (HP8453 UVVIS, Santa Clara, CA). A NBTP-modified surface was deprotected by 10 min of irradiation to yield a thiol-terminated surface. Freshly prepared thiol-terminated oligonucleotide solution was placed directly on the surface and incubated overnight at room temperature. After the disulfide coupling, the surface was thoroughly rinsed, and the probe oligonucleotide was hybridized by incubation with 50 µL of a 1 µM solution of its fluorescent complement (5’-AAT AAC TTT GCA ACA GTG G-FAM-3’) in 1× SSPE (10 mM NaH2PO4, 150 mM NaCl, 1 mM EDTA, pH 7.4) for 30 min in a humid chamber. Excess complement was removed by incubation of the surface in 1× SSPE buffer for 10 min at 37 °C. The fluorescence intensities were measured with a Genomic Solutions GeneTAC UC 4 × 4 scanner (Ann Arbor, MI). The surface was incubated in 8 M urea solution at room temperature for 30 min to dehybridize the probe oligonucleotide, thoroughly rinsed with water, and incubated with 200 mM DTT in TEA buffer to reduce the disulfide bonds. Cleavage of the disulfide bonds and release of ssDNA were monitored by the disappearance of hybridization fluorescence signal. Oligonucleotide surface density was estimated by quantifying the eluted ssDNA using Quant-iT OliGreen ssDNA assay kit (Invitrogen, Carlsbad, CA)
Immobilization of Maleimide-Biotin
N-Biotinoyl-N′-(6-maleimidohexanoyl)hydrazide was dissolved in dimethyl sulfoxide to make 10 mg/mL stock solution. A volume of 10 µL of stock solution was diluted in 500 µL of 100 mM TEA buffer, pH 7.0 to make a 0.4 mM maleimide-biotin solution, which was then placed directly onto a newly photodeprotected surface. After 3 h of incubation at room temperature, the surface was extensively rinsed with water and ethanol, dried under nitrogen, and incubated with fluorescently-tagged avidin (Invitrogen) (2.5 µg/mL in PBS buffer (150 mM NaCl, 1.5 mM KH2PO4, 2.7 mM Na2HPO4, pH 7.2)) for 30 min in a humid chamber. The surface was then fluorescently imaged in PBS buffer.
EDC Activation of Biotin
To a solution of biotin (100 mg, 0.41 mmol) in dimethylformamide (DMF) (10 mL) was added 94 mg (0.49 mmol) N-(3-dimethylaminopropyl)-N’-ethylcarbodiimide hydrochloride (EDC) and 12 mg (0.10 mmol) 4, 4-di(methylamino)pyridine (DMAP). After stirring for 15 min, 49 µL (0.49 mmol) triethylamine was added. After 2 h DMF was added to dilute the biotin solution to a desired concentration (see below). The solution was used as exposure solvent for subsequent biotin immobilization without purification.
Surface Patterning and Imaging of Biotin
Photodeprotection of a NBTP-modified surfaces was achieved by UV irradiation as described above except using activated biotin in DMF as exposure solvent. EDC-activated biotin was coupled to newly revealed thiol groups during exposure. After this derivatization reaction, the surface was rinsed with acetonitrile and dried with argon. Biotin patterns were revealed by placing 50 µL of the fluorescently-tagged avidin (2.5 µg/mL in PBS buffer) on the surface, covering with a coverslip, and incubating for 30 min in a humid chamber. The surface was then fluorescently imaged in PBS buffer.
Immobilization of Biotinylated Proteins
Biotin surfaces as described above were soaked in TBS buffer (20 mM Tris, 150 mM NaCl, pH 7.4) containing 10 mg/mL bovine serum albumin (BSA) for 30 min at room temperature. The surfaces were then incubated with 5 µg/mL NeutrAvidin (Pierce, Rockford, IL) in BSA-TBS buffer for 1 h, followed by rinsing with TBS buffer containing 0.1% Tween-20 (TBST) to generate NeutrAvidin surfaces. NeutrAvidin surfaces were then incubated with biotinylated anti-Ulex europaeus agglutinin I (UEA) antibody or biotinylated anti-Wheat Germ agglutinin (WGA) antibody (Vector Laboratories, Burlingame, CA) (5 µg/mL in BSA-TBS buffer) for 1 h to generate anti-UEA or anti-WGA surfaces. Unbound proteins were removed by washing the substrates with TBST buffer. The surfaces were then stained by incubating with fluorescein-labeled UEA or WGA (Vector Laboratories) (5 µg/mL in BSA-TBS buffer) for 1 h and imaged in TBS buffer.
RESULTS AND DISCUSSION
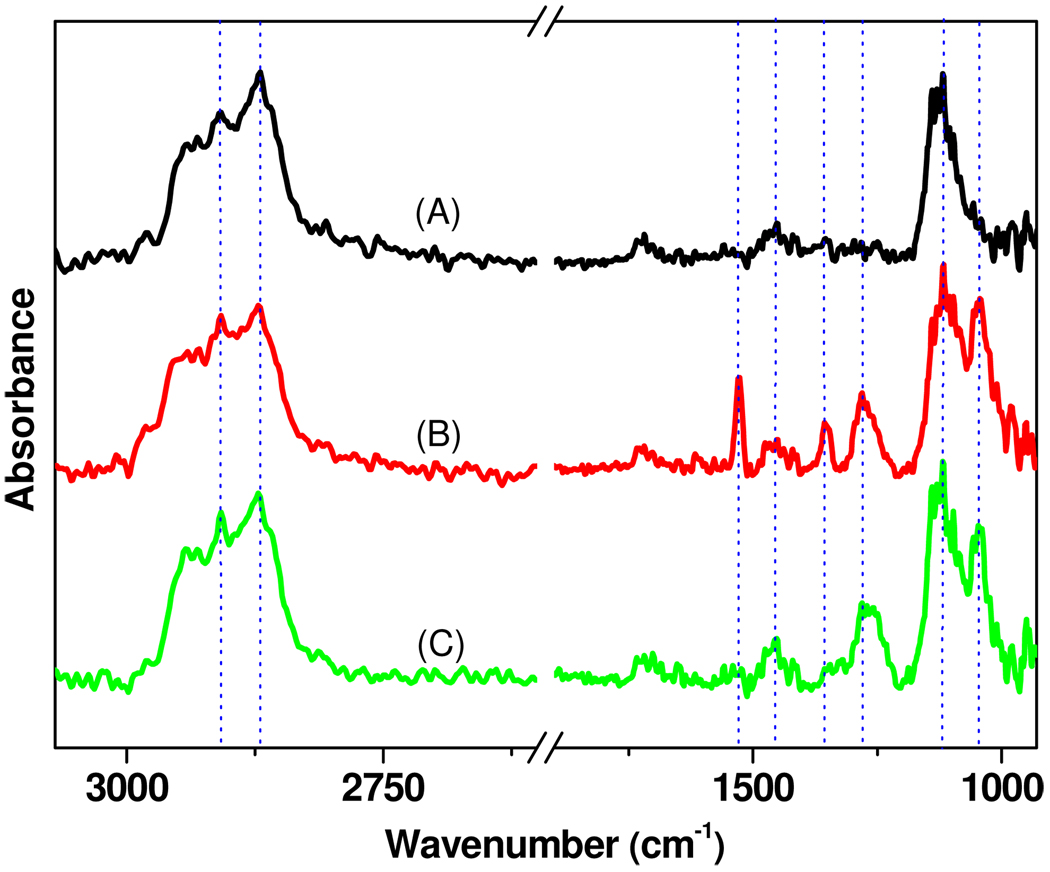
The substrate employed for these studies is a recently described lamellar material comprised of a thin layer (15 nm) of amorphous carbon, deposited on a ~100 nm thick gold film on glass.25 The reflective nature of this substrate facilitates characterization of surface modifications by PM-FTIRRAS. It also provides a conductive surface, alleviating surface charging during XPS measurements. Although this property was not utilized in the present study, the gold film also supports detection by surface plasmon resonance, a label-free detection method.26 Carbon supports are amenable to functionalization by UV light-mediated reactions with alkenes, yielding stable carbon-carbon bonds for attachment of molecules of interest and providing superior stability compared to their glass counterparts under a wide range of conditions. We have attached a variety of different functional groups to carbon in this way, including hydroxyl,27, 28 amine,25 aldehyde,29 and acyl chloride groups.30 In the present work, tetraethylene glycol monoallylether (EG)4 was employed for the preparation of hydroxyl terminated surfaces, the use of which not only largely reduces or even eliminates nonspecific adsorption of proteins,31–33 but also provides a flexible linker moiety for the attachment of small molecules and proteins.34 The UV light-mediated functionalization of the amorphous carbon substrate with the (EG)4 was monitored by PM-FTIRRAS (Figure 1 and Table 1), which showed the appearance of asymmetric (2911 cm−1), and symmetric (2871 cm−1) methylene stretches as well as methylene deformation vibrations (1453 cm−1). The first two peaks are not as sharp as is observed from long hydrocarbon chains, suggesting that the monolayer is relatively disordered.35 A strong peak corresponding to the asymmetric C-O-C stretching vibrations (1120 cm−1) was also observed, indicating the presence of ethylene glycols on the surface. A control experiment with tri(ethylene glycol) monoethyl ether showed none of these spectral features, indicating the covalent attachment of (EG)4 to the substrate.
Figure 1.
IR spectra of (A) tetraethylene glycol functionalized, (B) NBTP protected, (C) UV deprotected amorphous carbon surfaces. Dashed vertical lines correspond to the peak frequencies listed in Table 1.
Table 1.
Peak frequencies from Figure 1.
| Frequencies (cm−1) |
A | B | C | |
|---|---|---|---|---|
| CH2 asymmetric stretching | 2911 | sa | s | s |
| CH2 symmetric stretching | 2871 | s | s | s |
| NO2 asymmetric stretching | 1527 | - | s | - |
| CH2 deformation | 1453 | m | m | m |
| NO2 symmetric stretching | 1351 | - | s | - |
| P=O stretching | 1284 | - | s | s |
| C-O-C stretching | 1120 | s | s | s |
| P-O-C stretching | 1042 | - | s | s |
s = strong, m = medium, w = weak, - = not applicable.
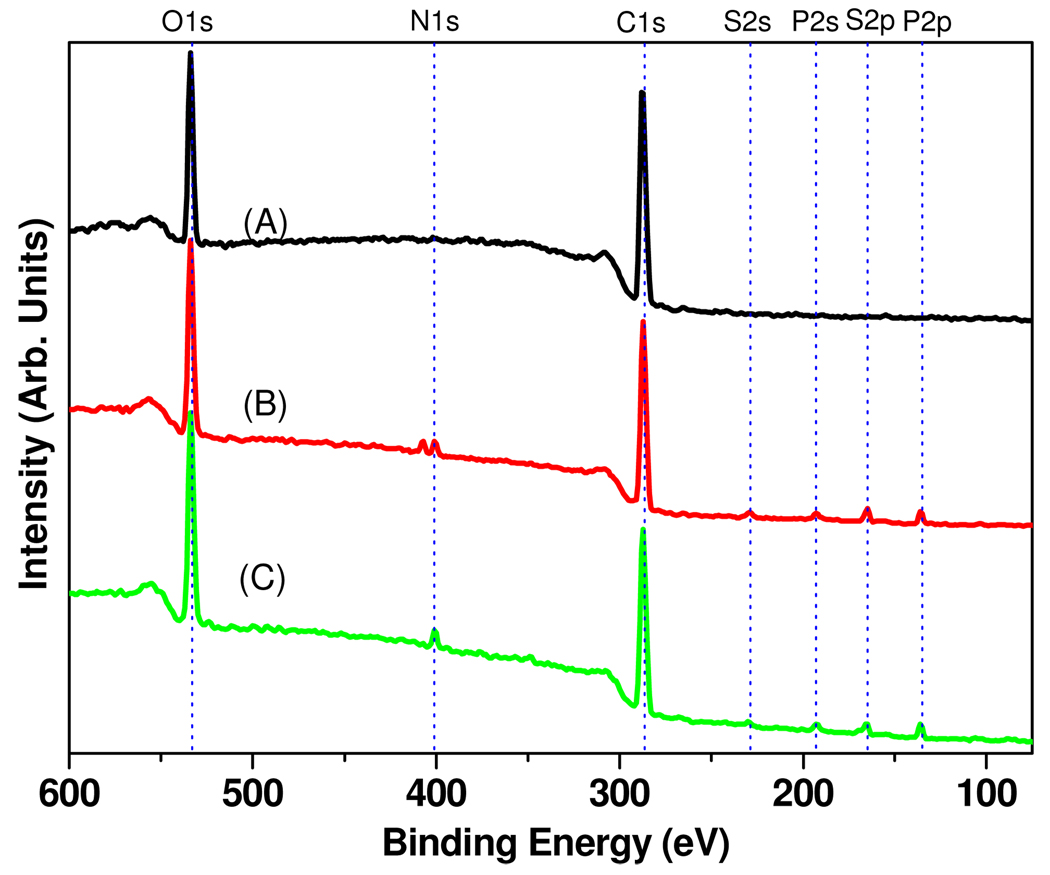
The functionalization of the amorphous carbon substrates with (EG)4 was also analyzed by XPS, which showed the appearance of peaks at 533 and 286 eV, corresponding respectively to O 1s and C 1s (Figure 2A). The ratio of oxygen to carbon for the films after (EG)4 functionalization was 0.76 ± 0.06, ten times higher than that of bare amorphous carbon after hydrogen plasma treatment (0.07 ± 0.01).21 The increase in the oxygen-to-carbon ratio indicates the modification of the substrate with (EG)4. High-resolution XP spectra of the C 1s region exhibited large components due to the carbon in C-C bonds found in all amorphous carbon samples (~40%) and to C-O carbon atoms (~60%), at 284.8 eV and 286.4 eV, respectively (exact spectra not shown). Using a bulk density of 2.0 g·cm−3, an electron attenuation length of 1.4 nm,36 and a value of 9 ether carbon atoms per (EG)4 molecule, yields a density of 2.3 × 10¹⁵ molecules·cm−2.37 This value is higher than the densities of self-assembled alkanethiols on gold (~5 × 10¹⁴ molecules·cm−2),38 suggesting the formation of multiple layers during photofunctionalization. This is likely due to the presence of surface-bound electron acceptors (oxygen atoms in this case) that can enhance the grafting of molecules in directions both normal to the surface and parallel to the surface.39
Figure 2.
XPS survey spectra of (A) tetraethylene glycol functionalized, (B) NBTP protected, (C) UV deprotected amorphous carbon surfaces.
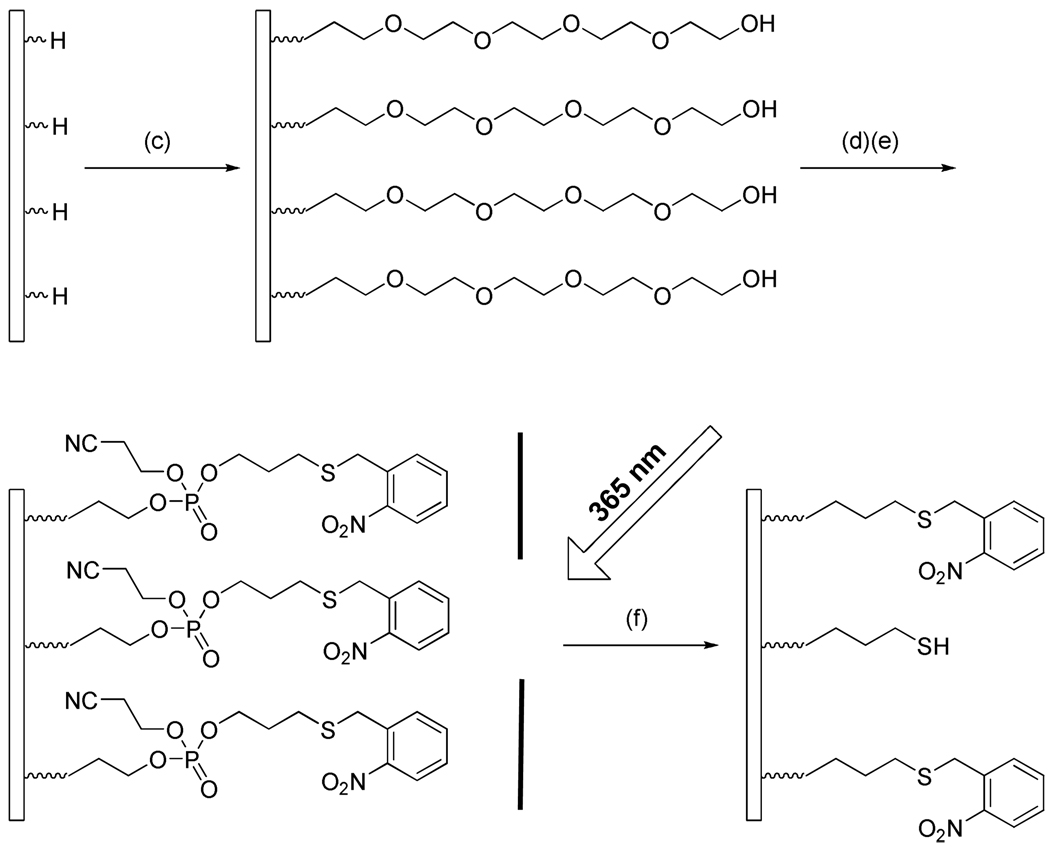
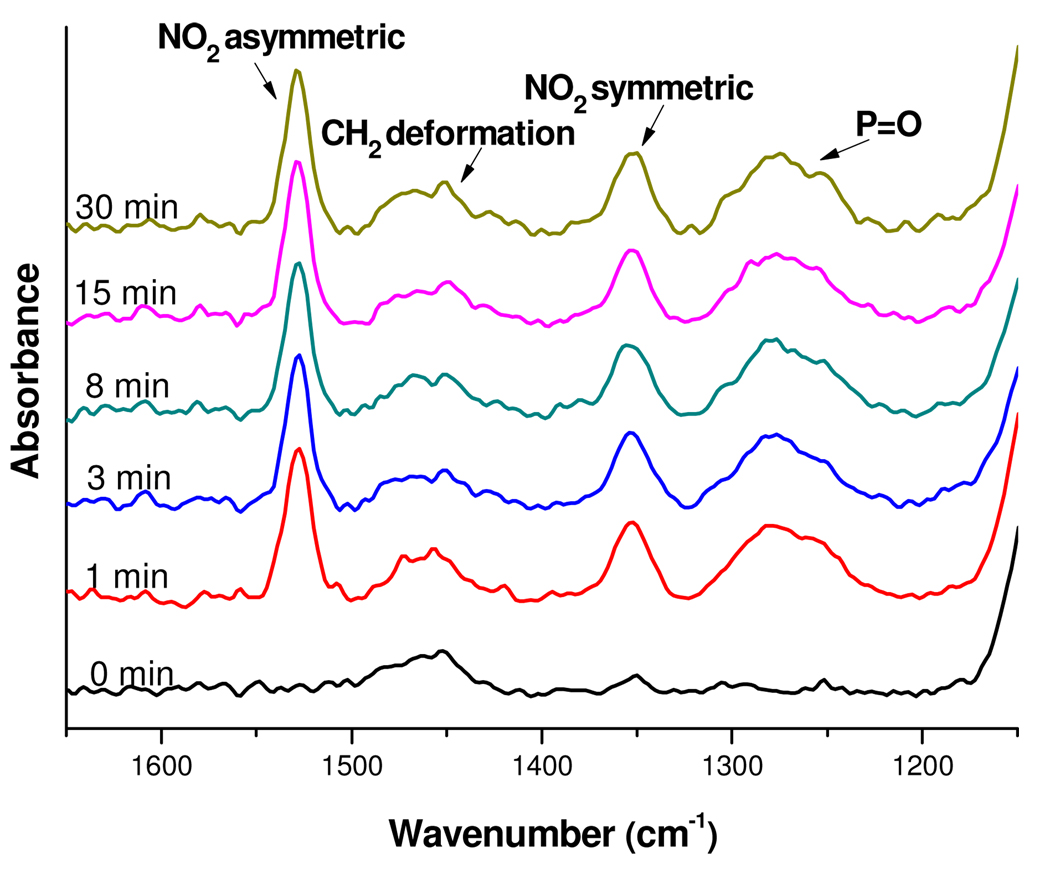
The (EG)4 modified surfaces provide a terminal hydroxyl group which was then functionalized with the NBTP phosphoramidite (Scheme 1–Scheme 2). Phosphoramidite chemistry, which is widely used for solid-phase DNA synthesis, was employed in this work due to its rapid kinetics, high efficiency,40 and compatibility with a variety of substrates.27 The success of the phosphoramidite coupling reaction was confirmed by appearance of the stretching vibrations of the P=O (1284 cm−1) and P-O-C (1042 cm−1) groups in the PM-FTIRRAS spectra, as well as by prominent peaks from the nitro group asymmetric (1527 cm−1) and symmetric stretches (1351 cm−1). A series of (EG)4 modified surfaces were functionalized with the NBTP phosphoramidite for varying amounts of time (1–30 min), and the intensities of the NO2 and P=O stretches were measured. As shown in Figure 3, after the initial rapid appearance of these IR spectral features within the first minute, no further changes in intensity were observed. These measurements are consistent with the known fast kinetics of phosphoramidite surface coupling reactions, in contrast to many other surface coupling reactions which may require hours of reaction time.9, 10
Scheme 1.
Synthesis of 3-(2’-nitrobenzyl)thiopropyl phosphoramidite. Reagents and conditions: (a) 3-mercaptopropanol, K2CO3, acetone, 80°C, 10 h, 75%; (b) 2-Cyanoethyl N,N-diisopropylchlorophosphoramidite, diisopropylethylamine, acetonitrile, room temperature, overnight, 42%
Scheme 2.
Schematic illustration showing the formation of photoactivatable substrates. Reagents and conditions: (c) tetraethyleneglycol monoallylether, 254 nm hv, 12 h; (d) 3-(2’-nitrobenzyl)thiopropyl phosphoramidite, phosphoramidite activator, 30 min; (e) 0.02 M I2 in THF/Pyidine/H2O, 3 min; (f) 365 nm hv, 10 min.
Figure 3.
Variation in the intensity of NO2 and P=O stretches of the IR spectrum as a function of phosphoramidite coupling time. 0 min corresponds to (EG)4 modified surfaces with no phosphoramidite treatment.
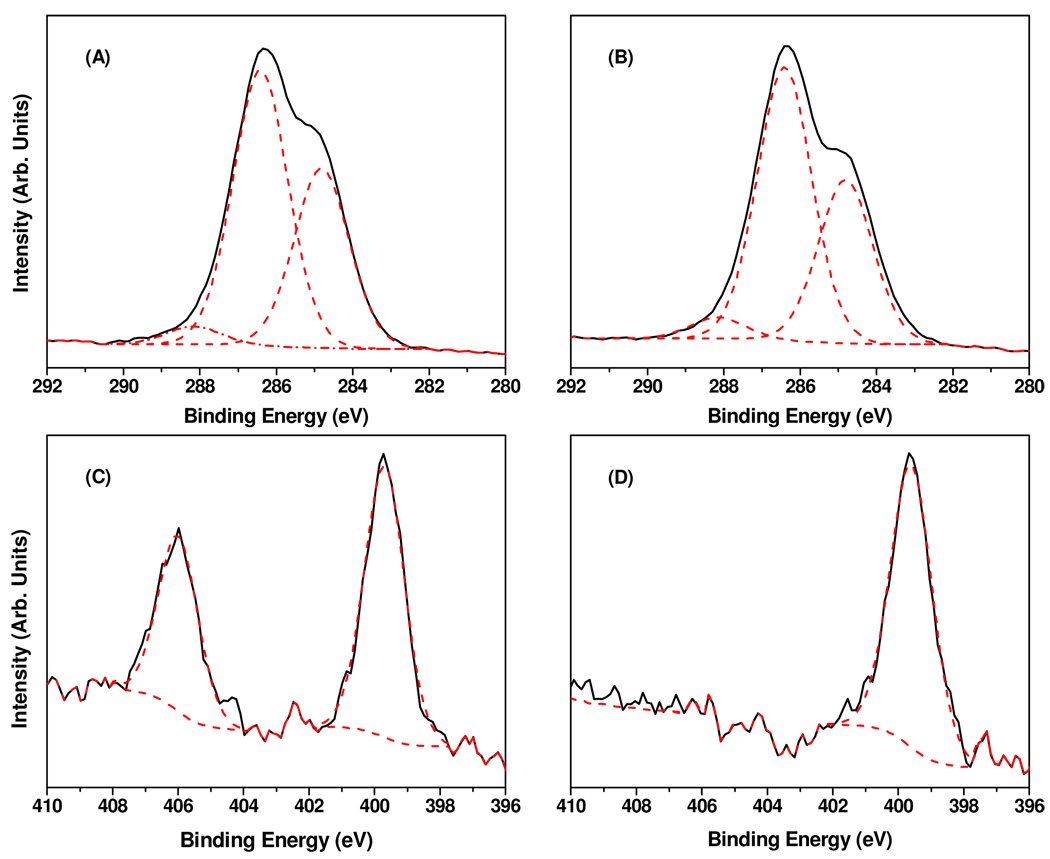
The NBTP-modified films were then characterized by XPS. Survey spectra (Figure 2B) showed peaks at 533, 406/400, 286, 228, 192, 164, and 135 eV, corresponding respectively to O 1s, N 1s, C 1s, S 2s, P 2s, S 2p, and P 2p. High resolution spectra were acquired for the C 1s and N 1s regions (Figure 4A, 4C). The C 1s peak was fit with three components at 284.8, 286.4, and 288.2 eV. The peak at 284.8 eV is attributed to carbon in C-C bonds from both the amorphous carbon material itself and the attached molecules (e.g. the nitrophenyl group). The predominant peak located at 286.4 eV is attributed to carbon in the C-O bonds in (EG)4. A small peak at 288.2 eV corresponds to the carbon in C=O bonds. Two peaks are observed in the N 1s region. The peaks at 406.0 eV and 399.9 eV are assigned to the nitrogen atoms in the nitro and nitrile groups, respectively. Integration of these two peaks gave a ratio of N (406.0 eV) to N (399.9 eV) of ~1:1.5, not 1:1 as expected based on the molecular formula. This is likely due to nitrogen contamination during sample processing and decomposition of the nitrobenzyl group by the X-ray irradiation, causing a decrease in N (406.0 eV) and an increase in N (399.9 eV) from decomposed products of the nitrobenzyl groups that remain on the surface.10
Figure 4.
High-resolution XPS spectra of NBTP protected and UV deprotected amorphous carbon surfaces: (A) C1s spectrum of NBTP protected carbon surface; (B) C1s spectrum of UV deprotected carbon surface; (C) N1s spectrum of NBTP protected carbon surface; (D) N1s spectrum of UV deprotected carbon surface.
The XPS experiments shown in Figure 2B were used to estimate the surface density of NBTP groups. The peak area of S 2s is 2.7% of that of C 1s. Using value for the atomic sensitivity factors of C 1s = 1 and S 2s = 1.43 yielded a value of about 6 × 10¹⁴ molecules·cm−2.41 This value corresponds to ~25% phosphoramidite coupling efficiency.42 The relatively “low” coupling efficiency of phosphoramidite coupling is likely due to low accessibility of the multiple layers of (EG)4.
Deprotection of the NBTP group to yield active surface thiols was accomplished by UV irradiation at 365 nm for 10 min, and is evident from the complete disappearance of the nitro group from the surface (1527 cm−1 and 1351 cm−1 IR peaks, 406.0 eV XPS peak; Figure 1C, Figure 2C, Figure 4D, and Figure 5A). The mechanism of photochemical deprotection has been shown to be via cleavage of the nitrogen-sulfur bond in the UV-induced cyclic benzisothiazole intermediate followed by elimination of o-nitrosobenzaldehyde and release of the free thiol group.43
Figure 5.
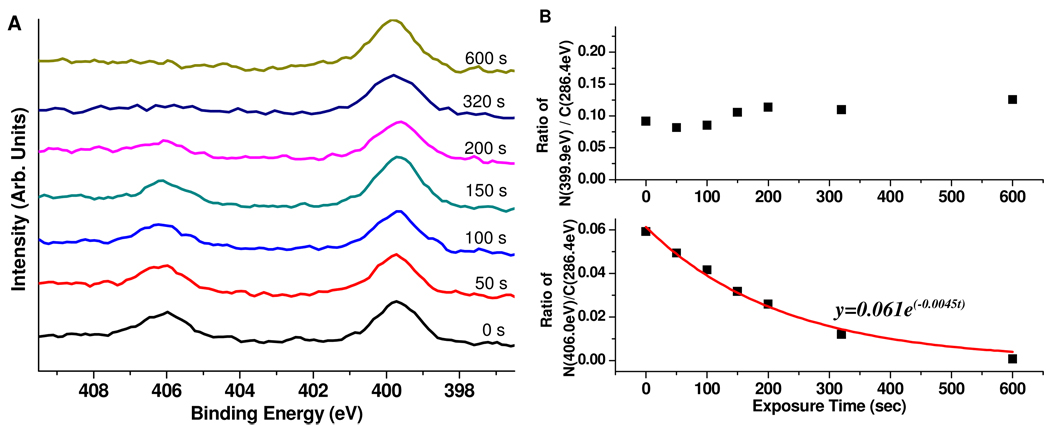
Variation in the N1s region of the XPS spectra (A) and in the ratio of the two nitrogen components (N (399.9eV) and N (406.0eV)) to C (286.4eV) (B) as a function of UV exposure time at a wavelength of 365 nm. The UV irradiation dose is linearly proportional to exposure time, with a conversion factor of 0.09 J/(cm2·s). The data for ratio of N (406.0eV)/C (286.4eV) were fit to the first-order exponential shown in the figure (solid line). The rate constant of 0.0045 s−1 corresponds to a half-life of 154 s.
The kinetics of nitrobenzyl photodeprotection was studied using XPS to monitor the changes in N 1s region as a function of exposure time. Figure 5A shows an example of the results obtained when the UV exposure time is systematically varied from 0 to 600 s. Peak areas of N 1s were normalized to that of C (286.4 eV) which was expected to be a constant under such conditions. As shown in Figure 5B, while normalized intensities of N (399.9 eV) remain unchanged upon UV irradiation, the intensities of N (406.0 eV) are described well by a first-order exponential with a rate constant k of 0.0045 s−1 (half-life of 154 s), as expected for a simple first-order deprotection reaction. A similar result was obtained by integrating the nitro asymmetric stretching peaks of PM-FTIRRAS spectra taken at various UV exposure times (data not shown). The half-life of nitrobenzyl groups upon UV irradiation is longer than previously reported for similar molecules.10 This discrepancy may be due to differences in the lamp sources (power and wavelength), surfaces, and exposure solvents.44
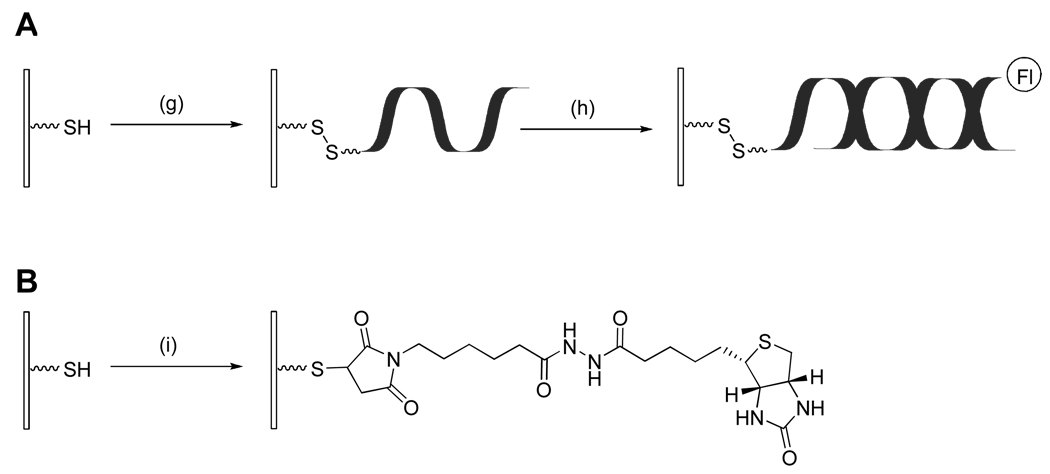
The chemistry described above results in the light-directed generation of reactive surface thiols, which can then serve as sites for attachment of desired molecules in any arbitrary surface pattern, as determined by the incident light. We illustrate here the versatility of this chemistry for the light directed patterning of biomolecules of interest by means of several examples; these examples utilize three distinct coupling reactions, forming disulfide, thioether, or thioester bonds (Scheme 3–Scheme 4); and five distinct biomolecules, namely, biotin, oligodeoxynucleotides, avidin/neutravidin, lectins, and antibodies.
Scheme 3.
Schematic illustration showing the immobilization of DNA via disulfide bonds (A) and biotin via thioether bonds (B). Reagents and conditions: (g) 34 mer 3’-HS-(CH2)3-ssDNA; (h) 19 mer complementary 3’-fluorescein-ssDNA; (i) N-Biotinoyl-N′-(6-maleimidohexanoyl)hydrazide.
Scheme 4.
Schematic illustration showing the immobilization of biotin via thioesterification. Reagents and conditions: (j) EDC, DMAP, DMF, room temperature, 2 h; (k) 365 nm hv, activated biotin in DMF as exposure solvent.
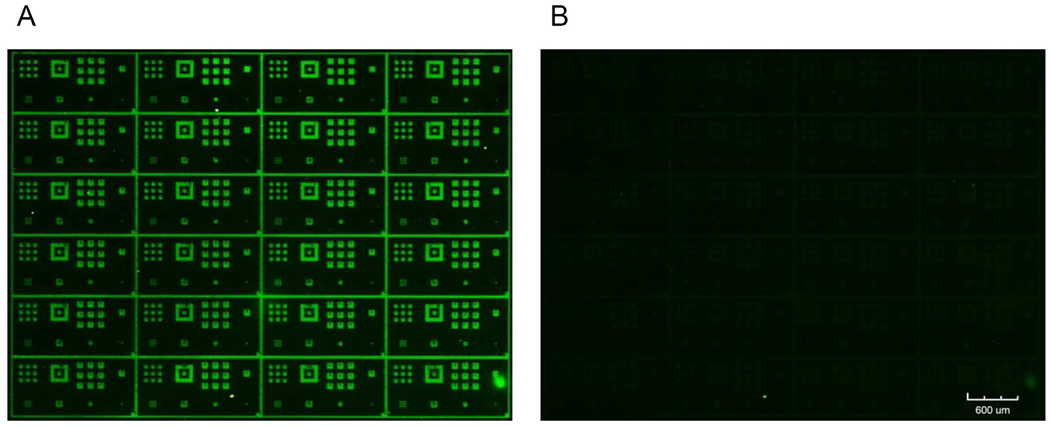
Figure 6A shows a fluorescence image obtained after hybridization of the fluorescently labeled DNA complement to a thiol-modified ssDNA that had been incubated with a photopatterned thiol surface, forming disulfide linkages to the surface (Scheme 3A). The reversibility of the reaction is shown by treatment with dithiothreitol (DTT) to reduce the disulfide linkages and thereby remove the attached DNA, rendering it no longer present for hybridization (Figure 6B). DTT cleaved ssDNA was collected and quantified using a Quant-iT OliGreen ssDNA assay kit, yielding an immobilized oligonucleotide surface density of (1.0 ± 0.1) × 1012 molecules·cm−2. This value is comparable to that obtained for most DNA arrays.21
Figure 6.
Immobilization and detachment of ssDNA monitored by hybridization of fluorescently labeled complement. (A) Fluorescence image of an amorphous carbon substrate after ssDNA immobilization via disulfide linkages followed by hybridization of its fluorescent complement; (B) fluorescence image of the substrate after DTT reduction followed by a second round of hybridization.
Figure 7 shows a pattern generated using Scheme 3B. A biotin-maleimide was reacted with the exposed surface thiols to form stable thioether bonds. Incubation of the surface with fluorescently labeled avidin, followed by washing and fluorescence scanning, yields the observed image.
Figure 7.
Fluorescence image of an amorphous carbon substrate after biotin immobilization via maleimide-thiol reaction followed by staining with fluorescently-tagged avidin.
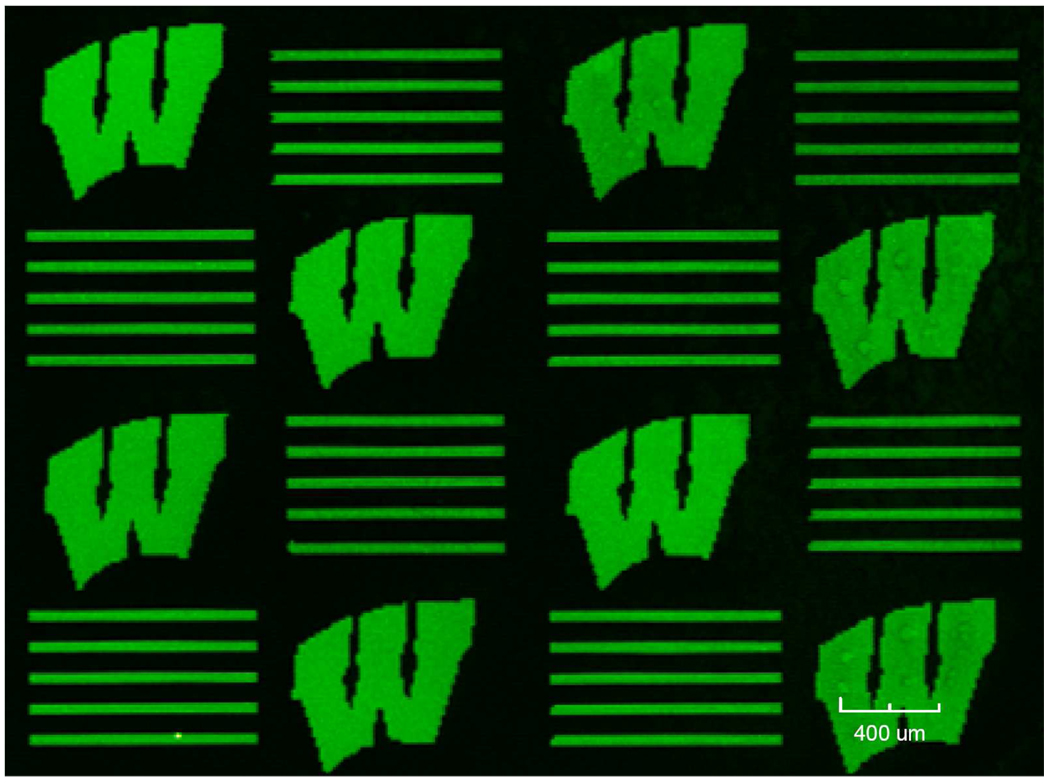
Figure 8 shows an image of a Badger Chemist, also corresponding to fluorescently labeled avidin bound to patterned surface-bound biotin. However in this case the biotin coupling was achieved by means of thioester bond formation as shown in Scheme 4. Biotin dissolved in dimethylformamide (DMF) was first activated by EDC in the presence of DMAP, forming an unstable reactive o-acylisourea ester. The solution with activated biotin was then used as the exposure solvent during surface photodeprotection. The thiol group generated during photoirradiation was immediately coupled (in situ) with EDC-activated biotin, forming the thioester linkage (See supporting information). The concentration of EDC-activated biotin is important as it controls the density of immobilized biomolecules. Concentrations above 10 mM resulted in saturation of the fluorescence intensity of the avidin patterns. When the solution was diluted to 2.5 mM, a slight decrease in fluorescence intensity was observed. Further dilution resulted in lower signals (1 mM) and eventually a disappearance of the avidin patterns (0.25 mM). Increased coupling times also resulted in higher fluorescence signals as saturation occurred at about 5 min. On the basis of these results as well as the 154 s half-life of the NBTP protecting groups under UV irradiation, we concluded that the biotin surface coupling reaction goes nearly to completion with an irradiation/coupling time of 10 min and biotin concentration of 10 mM. Accordingly these conditions were employed for all of the following experiments.
Figure 8.
Fluorescence image of an amorphous carbon substrate after biotin immobilization via thioesterification followed by staining with fluorescently-tagged avidin.
In the above procedure no purification of the reactive intermediate is necessary as photoactivation of the surface and biotin coupling are conducted in the same solution. This “one-pot” reaction greatly simplifies the patterning process, as it eliminates the need for intermediate washing steps. This method is readily amenable to patterning numerous other carboxylic group-containing molecules. For example, molecules with other functional groups such as hydroxyl, and amine groups might be converted to acid derivatives via carbonyldiimidazole treatment for subsequent surface coupling.45
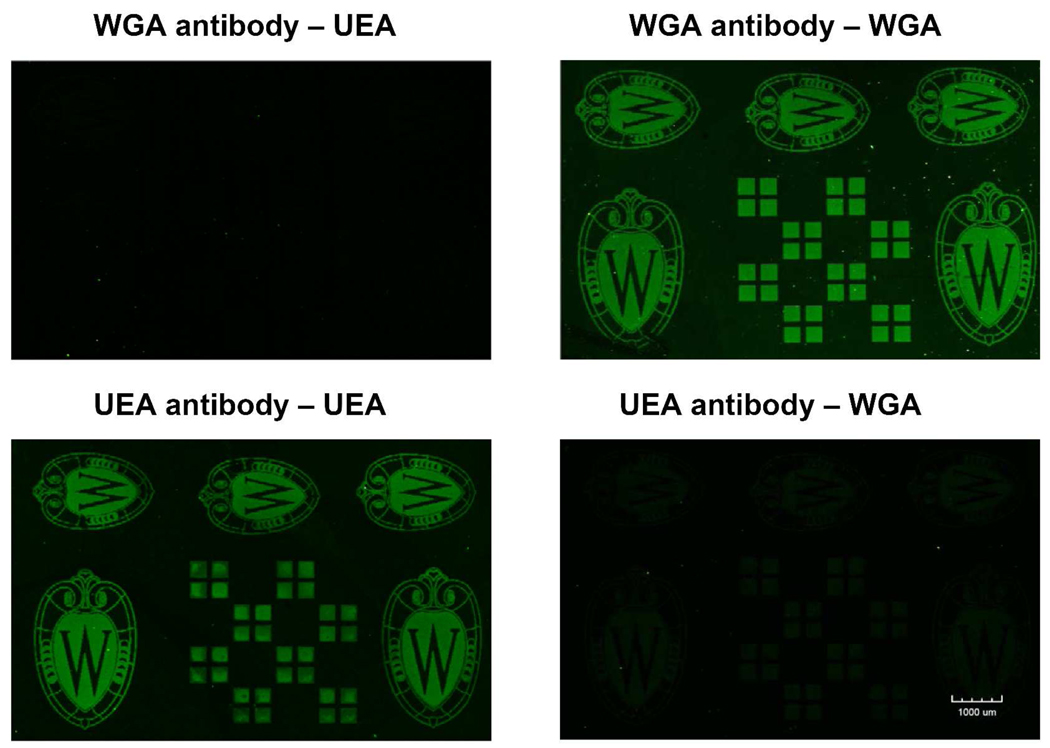
Figure 9 shows fluorescence images produced by means of three successive biomolecule binding reactions to the biotinylated surface produced by Scheme 4. Subsequent to the surface photopatterning and biotin immobilization, successive incubations (with intermediate washing steps) with NeutrAvidin, biotinylated anti- UEA antibody or biotinylated anti- WGA antibody, and the fluorescently labeled lectins UEA or WGA resulted in the images shown. The results show the effective immobilization of the two antibodies on the surface and demonstrate the retention of specific binding activity in these surface-bound antibodies, as anti-UEA only recognizes UEA and anti-WGA only recognizes WGA. This approach could readily be extended to pattern a wide variety of cell-adhesion related ligands, potentially providing a powerful tool for a variety of cell-based studies.46, 47
Figure 9.
Fluorescence images of biotinylated amorphous carbon substrates after successive incubation with NeutrAvidin, biotinylated Anti-UEA antibody or biotinylated AntiWGA antibody, and the fluorescently labeled lectins UEA or WGA.
CONCLUSION
In this report we have described a versatile approach for surface photopatterning on an oligoethylene glycol-based photoactivatable substrate. Thiol functionalities are revealed by UV irradiation of NBTP modified surfaces and a series of molecules including biotin, DNA, and proteins were successfully attached to the surfaces with retention of their biological activities. Although the spatial resolution of the present study is in the micron range, higher spatial resolution could be obtained if desired by using near-field optical microscopy.48 The approach is simple, general and versatile, and provides a powerful new strategy for the fabrication of patterned biomolecule-modified surfaces.
Supplementary Material
ACKNOWLEDGEMENTS
We thank Dr. Michael Shortreed, Justin Carlisle, Matthew Lockett, and Cheng-Hsien Wu for thoughtful discussions, Prof. Robert Hamers for the use of his PM-FTIRRAS instrument, and Dr. John Jacobs and the UW Materials Science Center for access to and usage of the XPS instrument. This work was supported by NIH Grant R01HG002298, NSF Grant CHE-0809095 co-funded by MPS/CHE & BIO/MCB Divisions, and the University of Wisconsin Industrial and Economic Development Research program.
Footnotes
Supporting Information Available: This material is available free of charge via the Internet at http://pubs.acs.org.
REFERENCE
- 1.Khetani SR, Bhatia SN. Curr. Opin. Biotechnol. 2006;17:524–531. doi: 10.1016/j.copbio.2006.08.009. [DOI] [PubMed] [Google Scholar]
- 2.Tsang VL, Chen AA, Cho LM, Jadin KD, Sah RL, DeLong S, West JL, Bhatia SN. FASEB J. 2007;21:790–801. doi: 10.1096/fj.06-7117com. [DOI] [PubMed] [Google Scholar]
- 3.Chen CS, Mrksich M, Huang S, Whitesides GM, Ingber DE. Science. 1997;276:1425–1428. doi: 10.1126/science.276.5317.1425. [DOI] [PubMed] [Google Scholar]
- 4.McBeath R, Pirone DM, Nelson CM, Bhadriraju K, Chen CS. Dev. Cell. 2004;6:483–495. doi: 10.1016/s1534-5807(04)00075-9. [DOI] [PubMed] [Google Scholar]
- 5.Brockman JM, Frutos AG, Corn RM. J. Am. Chem. Soc. 1999;121:8044–8051. [Google Scholar]
- 6.Sun SQ, Mendes P, Critchley K, Diegoli S, Hanwell M, Evans SD, Leggett GJ, Preece JA, Richardson TH. Nano Lett. 2006;6:345–350. doi: 10.1021/nl052130h. [DOI] [PubMed] [Google Scholar]
- 7.Ducker RE, Janusz S, Sun S, Leggett GJ. J. Am. Chem. Soc. 2007;129:14842–14843. doi: 10.1021/ja0749800. [DOI] [PubMed] [Google Scholar]
- 8.Griesser T, Adams J, Wappel J, Kern W, Leggett GJ, Trimmel G. Langmuir. 2008;24:12420–12425. doi: 10.1021/la802382p. [DOI] [PubMed] [Google Scholar]
- 9.Alang Ahmad SA, Wong LS, ul-Haq E, Hobbs JK, Leggett GJ, Micklefield J. J. Am. Chem. Soc. 2009;131:1513–1522. doi: 10.1021/ja807612y. [DOI] [PubMed] [Google Scholar]
- 10.Kikuchi Y, Nakanishi J, Shimizu T, Nakayama H, Inoue S, Yamaguchi K, Iwai H, Yoshida Y, Horiike Y, Takarada T, Maeda M. Langmuir. 2008;24:13084–13095. doi: 10.1021/la8024414. [DOI] [PubMed] [Google Scholar]
- 11.Christman KL, Broyer RM, Tolstyka ZP, Maynard HD. J. Mater. Chem. 2007;17:2021–2027. [Google Scholar]
- 12.Park S, Yousaf MN. Langmuir. 2008;24:6201–6207. doi: 10.1021/la8005663. [DOI] [PubMed] [Google Scholar]
- 13.Nakanishi J, Kikuchi Y, Takarada T, Nakayama H, Yamaguchi K, Maeda M. J. Am. Chem. Soc. 2004;126:16314–16315. doi: 10.1021/ja044684c. [DOI] [PubMed] [Google Scholar]
- 14.Nakanishi J, Kikuchi Y, Inoue S, Yamaguchi K, Takarada T, Maeda M. J. Am. Chem. Soc. 2007;129:6694–6695. doi: 10.1021/ja070294p. [DOI] [PubMed] [Google Scholar]
- 15.Dillmore WS, Yousaf MN, Mrksich M. Langmuir. 2004;20:7223–7231. doi: 10.1021/la049826v. [DOI] [PubMed] [Google Scholar]
- 16.Fresco ZM, Frechet JMJ. J. Am. Chem. Soc. 2005;127:8302–8303. doi: 10.1021/ja052738s. [DOI] [PubMed] [Google Scholar]
- 17.Braunschweig AB, Senesi AJ, Mirkin CA. J. Am. Chem. Soc. 2009;131:922–923. doi: 10.1021/ja809107n. [DOI] [PMC free article] [PubMed] [Google Scholar]
- 18.Shimada K, Mitamura K. J Chrom. B Biomed. Sci. Appl. 1994;659:227–241. doi: 10.1016/0378-4347(93)e0444-u. [DOI] [PubMed] [Google Scholar]
- 19.Jonkheijm P, Weinrich D, Koehn M, Engelkamp H, Christianen PCM, Kuhlmann J, Maan JC, Nuesse D, Schroeder H, Wacker R, Breinbauer R, Niemeyer CM, Waldmann H. Angew. Chem., Int. Ed. 2008;47:4421–4424. doi: 10.1002/anie.200800101. [DOI] [PubMed] [Google Scholar]
- 20.Dondoni A. Angew. Chem., Int. Ed. 2008;47:8995–8997. doi: 10.1002/anie.200802516. [DOI] [PubMed] [Google Scholar]
- 21.Lockett MR, Smith LM. Anal. Chem. 2009;81:6429–6437. doi: 10.1021/ac900807q. [DOI] [PMC free article] [PubMed] [Google Scholar]
- 22.Perret-Aebi LE, von Zelewsky A, Dietrich-Buchecker CD, Sauvage JP. Angew. Chem., Int. Ed. 2004;43:4482–4485. doi: 10.1002/anie.200460250. [DOI] [PubMed] [Google Scholar]
- 23.Barner BJ, Green MJ, Saez EI, Corn RM. Anal. Chem. 1991;63:55–60. [Google Scholar]
- 24.Singh-Gasson S, Green RD, Yue Y, Nelson C, Blattner F, Sussman MR, Cerrina F. Nat. Biotechnol. 1999;17:974–978. doi: 10.1038/13664. [DOI] [PubMed] [Google Scholar]
- 25.Sun B, Colavita PE, Kim H, Lockett M, Marcus MS, Smith LM, Hamers RJ. Langmuir. 2006;22:9598–9605. doi: 10.1021/la061749b. [DOI] [PubMed] [Google Scholar]
- 26.Lockett MR, Weibel SC, Phillips MF, Shortreed MR, Sun B, Corn RM, Hamers RJ, Cerrina F, Smith LM. J. Am. Chem. Soc. 2008;130:8611–8613. doi: 10.1021/ja802454c. [DOI] [PMC free article] [PubMed] [Google Scholar]
- 27.Phillips MF, Lockett MR, Rodesch MJ, Shortreed MR, Cerrina F, Smith LM. Nucleic Acids Res. 2008;36:e7. doi: 10.1093/nar/gkm1103. [DOI] [PMC free article] [PubMed] [Google Scholar]
- 28.Chen S, Phillips MF, Cerrina F, Smith LM. Langmuir. 2009;25:6570–6575. doi: 10.1021/la9000297. [DOI] [PMC free article] [PubMed] [Google Scholar]
- 29.Lockett MR, Shortreed MR, Smith LM. Langmuir. 2008;24:9198–9203. doi: 10.1021/la800991t. [DOI] [PMC free article] [PubMed] [Google Scholar]
- 30.Lockett MR, Carlisle JC, Le DV, Smith LM. Langmuir. 2009;25:5120–5126. doi: 10.1021/la804140r. [DOI] [PMC free article] [PubMed] [Google Scholar]
- 31.Palegrosdemange C, Simon ES, Prime KL, Whitesides GM. J. Am. Chem. Soc. 1991;113:12–20. [Google Scholar]
- 32.Prime KL, Whitesides GM. Science. 1991;252:1164–1167. doi: 10.1126/science.252.5009.1164. [DOI] [PubMed] [Google Scholar]
- 33.Prime KL, Whitesides GM. J. Am. Chem. Soc. 1993;115:10714–10721. [Google Scholar]
- 34.Pils W, Micura R. Nucl. Acids Res. 2000;28:1859–1863. doi: 10.1093/nar/28.9.1859. [DOI] [PMC free article] [PubMed] [Google Scholar]
- 35.Lee S, Shon Y-S, Colorado R, Guenard RL, Lee TR, Perry SS. Langmuir. 2000;16:2220–2224. [Google Scholar]
- 36.Kaye GWCL, TH . Tables of physical and chemical constants. Vol. 1995. Harlow, Essex: Longman; [Google Scholar]
- 37.The underlying assumption in XPS quantification is that the number of electrons recorded is proportional to the number of atoms in a given state. The 60:40 ratio observed indicates that the number of carbon atoms in C-O bonds is 1.5 times that in C-C bonds. The latter was calculated to be 1.4 × 10¹⁶ in an area of 1 cm2 and a depth of 1.4 nm. Therefore the number of the C-O carbon atoms in a 1 cm2 area is 2.1 × 10¹⁶. This corresponds to 2.3 × 10¹⁵ (EG)4 molecules per cm2.
- 38.Nuzzo RG, Allara DL. J. Am. Chem. Soc. 2002;105:4481–4483. [Google Scholar]
- 39.Colavita PE, Streifer JA, Sun B, Wang X, Warf P, Hamers RJ. J. Phys. Chem. C. 2008;112:5102–5112. [Google Scholar]
- 40.Beaucage SL, Iyer RP. Tetrahedron. 1992;48:2223–2311. [Google Scholar]
- 41.The number of the total carbon atoms was ~3.5 × 10¹⁶ in an area of 1 cm2 and a depth of 1.4 nm as calculated above. Using the peak area ratio and atomic sensitivity factors, we calculated the number of the sulfur atoms in 1 cm2 area to be 6 × 10¹⁴. Since there was only one sulfur atom per phosphoramidite molecule, the surface density of NBTP groups is 6 × 10¹⁴ molecules·cm−2.
- 42.Taking the density of NBTP groups divided by the density of (EG)4 yields a phosphoramidite coupling efficiency of 25%.
- 43.Pelliccioli AP, Wirz J. Photochem. Photobiol. Sci. 2002;1:441–458. doi: 10.1039/b200777k. [DOI] [PubMed] [Google Scholar]
- 44.McGall GH, Barone AD, Diggelmann M, Fodor SPA, Gentalen E, Ngo N. J. Am. Chem. Soc. 1997;119:5081–5090. [Google Scholar]
- 45.Gais HJ. Angew. Chem., Int. Ed. Engl. 1977;16:244–247. [Google Scholar]
- 46.Zheng T, Peelen D, Smith LM. J. Am. Chem. Soc. 2005;127:9982–9983. doi: 10.1021/ja0505550. [DOI] [PubMed] [Google Scholar]
- 47.Chen S, Zheng T, Shortreed MR, Alexander C, Smith LM. Anal. Chem. 2007;79:5698–5702. doi: 10.1021/ac070423k. [DOI] [PMC free article] [PubMed] [Google Scholar]
- 48.Pohl DW, Denk W, Lanz M. Appl. Phys. Lett. 1984;44:651–653. [Google Scholar]
Associated Data
This section collects any data citations, data availability statements, or supplementary materials included in this article.


