Abstract
Allele frequency variation at the phosphoglucose isomerase (PGI) locus in Californian populations of the beetle Chrysomela aeneicollis suggests that PGI may be undergoing natural selection. We quantified (i) apparent Michaelis-Menten constant (Km) of fructose 6-phosphate at different temperatures and (ii) thermal stability for three common PGI genotypes (1–1, 1–4, and 4–4). We also measured air temperature (Ta) and beetle body temperature (Tb) in three montane drainages in the Sierra Nevada, California. Finally, we measured 70-kDa heat shock protein (Hsp70) expression in field-collected and laboratory-acclimated beetles. We found that PGI allele 1 predominated in the northernmost drainage, Rock Creek (RC), which was also significantly cooler than the southernmost drainage, Big Pine Creek (BPC), where PGI allele 4 predominated. Allele frequencies and air temperatures were intermediate in the middle drainage, Bishop Creek (BC). Differences among genotypes in Km (1–1 > 1–4 > 4–4) and thermal stability (4–4 > 1–4 > 1–1) followed a pattern consistent with temperature adaptation. In nature, Tb was closely related to Ta. Hsp70 expression in adult beetles decreased with elevation and differed among drainages (BPC > BC > RC). After laboratory acclimation (8 days, 20°C day, 4°C night) and heat shock (4 h, 28–36°C), Hsp70 expression was greater for RC than BPC beetles. In RC, field-collected beetles homozygous for PGI 1–1 had higher Hsp70 levels than heterozygotes or a 4–4 homozygote. These results reveal functional and physiological differences among PGI genotypes, which suggest that montane populations of this beetle are locally adapted to temperature.
Evolutionary biologists have long debated the adaptive significance of genetically based enzyme polymorphisms (allozymes) found in natural populations of many species (1). Some allozymes appear to be neutral to natural selection (2, 3). In other cases, allozymes have been shown to differ functionally and physiologically in ways that affect fitness in nature (4–11). Temperature may act as a crucial selective factor favoring different allozymes in different environments (3, 12, 13). Enzymes from cold-living ectotherms often function more effectively at lower temperatures than homologous enzymes from warm-living ectotherms, but these “cold-adapted” enzymes also unfold more readily at high temperature (14–16). This implies that many enzymes are constrained to function most effectively over a fairly narrow range of temperatures. Ectotherms are particularly susceptible to the physiological effects of environmental temperature variation (17, 18). An effective physiological response to temperature variation may be especially important for small insects, which usually cannot behaviorally thermoregulate as well as larger ectotherms (19).
Stress proteins (heat shock proteins, or Hsps) minimize protein damage by refolding partially unfolded proteins into their functional state (20–23). Temperature extremes often induce Hsps and enhance thermal tolerance (21, 24–26). However, Hsp production can incur a substantial physiological cost (20, 27). One might expect to find that enzyme genotypes differ in Hsp expression under stressful environmental conditions in nature. However, this has not been demonstrated in natural populations of any organism.
The willow beetle Chrysomela aeneicollis (Chrysomelidae) is found throughout northwestern North America. Montane populations in California are at the southernmost edge of its geographic range (28, 29). Population sizes of this beetle have fluctuated dramatically over the last 15 years, suggesting that climatic conditions affect its distribution and abundance (28, 30, 31). In 1988, Rank (31) quantified allozyme variation among populations of C. aeneicollis in three montane drainages in eastern California (Fig. 1). Allele frequency variation for four glycolytic enzymes (adenylate kinase, isocitrate dehydrogenase, mannose phosphate isomerase, phosphoglucomutase) was moderate, but frequency variation for phosphoglucose isomerase (PGI) was much greater. This indicated that natural selection might act on PGI genotypes. PGI is a key enzyme regulating glucose metabolism and catalyzes interconversion between glucose-6 phosphate and fructose-6 phosphate (32, 33). Studies of Colias butterflies found that PGI genotypes differ in kinetic properties and thermal stabilities (6, 32, 34). Thus, genetic variation at PGI in C. aeneicollis may reflect adaptation to local thermal conditions.
Figure 1.
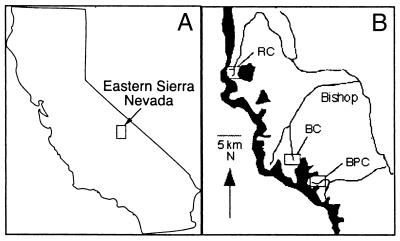
Study populations. (A) Study sites located in the Eastern Sierra Nevada mountains in California. (B) Chrysomela aeneicollis populations in three drainages were investigated: Big Pine Creek (BPC), Bishop Creek (BC), and Rock Creek (RC).
Our present investigation focuses on the relationship between local environmental temperature, functional properties of PGI genotypes, and the expression of 70-kDa-class heat shock proteins. We measured air temperatures in the same three drainages that are known to differ in PGI frequency and determined the relationship between air and body temperature. We also quantified the apparent Michaelis-Menten constant (Km) and thermal stability for three common PGI genotypes. Finally, we measured tissue levels of 70-kDa-class Hsps for field-collected beetles of known body temperature and PGI genotype and for laboratory-acclimated beetles from different drainages.
Methods
Study Sites and PGI Genotype Frequencies.
We quantified PGI genotype frequencies in Big Pine Creek (BPC) (37°7′N, 118°29′ W), Bishop Creek (BC) (37°11′ N, 118°32′W), and Rock Creek (RC) (37°25′ N, 118°24′W) by using starch gel electrophoresis (31). Study sites are shown in Fig. 1. Adult beetles were collected from three localities per drainage in July, 1998 (Table 1). We calculated a common index of genetic differentiation, Fst, by using methods of Weir and Cockerham (35) implemented by the genepop 3.1d program (36). We tested for significant deviations from Hardy Weinberg Equilibrium with exact probabilities (probability test option) in genepop. Finally, we tested for heterogeneity in genotype frequency among populations by using log-likelihood exact tests (37).
Table 1.
Observed and expected genotypic frequencies at the phosphoglucose isomerase locus for Chrysomela aeneicollis individuals collected in three high elevation drainages in the summer of 1998
| Locality | Elevation, meters | n | 1-1, obs/exp | 1-2, obs/exp | 1-3, obs/exp | 1-4, obs/exp | 1-5, obs/exp | 2-4, obs/exp | 4-5, obs/exp | 4-4, obs/exp |
|---|---|---|---|---|---|---|---|---|---|---|
| Big Pine Creek | ||||||||||
| Falls Site | 2,961 | 20 | 0.10/0.07 | ____/____ | ____/____ | 0.35/0.41 | ____/____ | ____/____ | ____/____ | 0.55/0.52 |
| Upper Site | 3,229 | 20 | 0.05/0.06 | ____/____ | ____/____ | 0.40/0.37 | ____/0.01 | ____/____ | 0.05/0.04 | 0.50/0.52 |
| Sixth Lake | 3,332 | 20 | 0.10/0.02 | ____/____ | ____/____ | 0.10/0.25 | ____/____ | ____/0.01 | 0.05/0.04 | 0.75/0.68 |
| Bishop Creek | ||||||||||
| South Lake | 2,996 | 20 | 0.30/0.35 | ____/____ | 0.05/0.03 | 0.55/0.46 | ____/____ | ____/____ | ____/____ | 0.10/0.13 |
| HSC Site | 3,196 | 20 | 0.35/0.38 | ____/____ | ____/____ | 0.50/0.45 | 0.05/0.03 | ____/____ | ____/0.02 | 0.10/0.12 |
| Brown Lake | 3,251 | 19 | 0.47/0.43 | ____/____ | ____/____ | 0.32/0.43 | 0.05/0.04 | ____/____ | ____/0.02 | 0.16/0.09 |
| Rock Creek | ||||||||||
| East Fork | 2,705 | 50 | 0.90/0.88 | 0.02/0.02 | ____/____ | 0.06/0.08 | ____/0.02 | ____/____ | 0.02/____ | ____/____ |
| Heart Lake | 3,179 | 52 | 0.85/0.83 | 0.10/0.09 | ____/____ | 0.04/0.07 | ____/____ | ____/____ | ____/____ | 0.02/____ |
| Ruby Lake | 3,317 | 51 | 0.82/0.81 | 0.06/0.07 | ____/____ | 0.10/0.11 | ____/____ | 0.02/0.00 | ____/____ | ____/____ |
Expected frequencies calculated for each population under the assumption of Hardy-Weinberg equilibrium. obs, observed; exp, expected.
Functional Properties of PGI Genotypes.
Enzyme preparation.
We determined PGI genotype for 400 beetles from a site in BC in which PGI 1 and 4 occur in high frequency. After genotype identification, homogenates of 10 individuals of each genotype were pooled, were diluted 1:1 with 200 mM imidazole-Cl (pH 7.5 at 20°C), and were centrifuged (4°C, 30 min, 15,000 × g). PGI was partially purified from the resulting supernatant via fractional precipitation between 1.2 and 2.4 M ammonium sulfate, following the methods of Watt et al. (38). Protein solution was desalted and concentrated by using Centricon-30 (Amicon) spin filtration units.
Enzyme kinetics and thermal stability measurements.
We measured the apparent Michaelis-Menten binding constant (Km) of fructose 6-phosphate (F6P) for common PGI genotypes (1–1, 1–4, 4–4) at 20, 30, and 40°C by using published methods (33, 39). PGI was assayed in the gluconeogenesis direction (F6P to glucose 6-phosphate) via glucose 6-phosphate dehydrogenase coupled enzyme assay (25–500 μM F6P) in a temperature-controlled Shimadzu 1801 spectrophotometer. Km values were determined by using Shimadzu's kinetics software. We used analysis of variance (ANOVA) with PGI genotype and temperature as main effects. We analyzed all statistics by using the statistical program jmp 3.2.1 (SAS Institute, Cary, NC).
Thermal stability measurements.
Identical total activities of PGI (units/g total protein) were assayed in the gluconeogenesis direction as described above in the presence of excess NAD+ (500 μM), F6P (200 μM), and glucose 6-phosphate dehydrogenase (3 units/ml). PGI activity was measured in duplicate at 5°C intervals from 20 to 35°C, and then at 2.5°C intervals from 37.5 to 57.5°C, and was compared with a control (20°C). Arrhenius break temperature, the temperature above which enzyme activity decreases rapidly, was determined by sequential linear regression analysis of Arrhenius plots (40, 41). Data reported are means of two replicate break temperature determinations.
Air Temperature Measurements.
We measured ambient air temperatures (Ta) during the summer of 1998 by using thermistors encased in dataloggers (Onset Computer, Pocaset, MA). We secured loggers to willow branches at mid-height at five localities along beetles' altitudinal range in BPC, BC, and RC (2,800–3,300 m), recording air temperature every 15 min over 42 days (June 30 to August 4). For data analysis, we divided each 24-h period into 4-h intervals and obtained the mean Ta per interval. For statistical analysis, we used ANOVA with four main effects: drainage, localities within each drainage (a random effect), date, and time interval, discarding data from two defective loggers.
Body Temperature Measurements.
We measured adult body temperatures (Tb) at low, mid-, and high altitudes during July, 1998 at BPC, BC, and RC at five evenly spaced time intervals from sunrise to sunset. We captured beetles (6–8 mm in length) in open plastic dishes and placed them back on plants for Tb measurements. We measured air temperature (Ta) and Tb simultaneously by using hand-held digital thermometers (Omega HH-82) equipped with T-type Teflon-insulated 36 AWG fine-wire thermocouples (Omega 5SC-TT-T-36). We dropped measurements from RC from analysis because the weather became overcast and rainy, making data not comparable to sunny conditions in BPC and BC. We conducted four-way analysis of covariance with drainage, elevation (low, medium, high), time interval, and gender as main effects, appropriate interactions, and Ta as a covariate.
Variation in Expression of Hsp70 Class Proteins.
We quantified tissue levels of a stress-inducible Hsp70-class stress protein for 180 field-collected beetles of known Tb by Western blot analysis following published methods (43). Before analysis, we randomized individual beetles with respect to categorical variables across gels. We quantified tissue levels of Hsp70 by chemiluminescence using an anti-Hsp70 antibody specific for the stress-inducible isoform Hsp72 (SPA-810, StressGen Biotechnologies, Victoria, BC, Canada), and a secondary antibody, conjugated with peroxidase, was used to locate the anti-Hsp70 antibody. For each sample, we determined location and size of a single band, molecular mass 72 kDa, on x-ray film by using Sigma scan pro (release 4.0 for PC). We measured band area and density and determined Hsp70 levels by linear regression to a serial dilution curve of four concentrations of a known quantity of pure Hsp72 (human recombinant, SPP-855, StressGen) on each blot. We analyzed these data by four-way ANOVA with drainage, elevation (low, mid-, or high), time interval, and gender as main effects and appropriate interactions.
Differences in Hsp70 Expression Among PGI Genotypes.
In a preliminary analysis, we compared PGI genotypes with respect to Hsp70 expression in all three drainages. This analysis suggested an effect of PGI genotype on Hsp70 expression for beetles in RC. To obtain more balanced samples of different PGI genotypes in RC, we determined genotypes for 100 additional field-collected beetles. We conducted a second Western blot determination of Hsp70 expression by using 17 individuals with rare genotypes and 10 randomly sampled individuals with the 1–1 genotype. To analyze data, we used PGI genotype as a categorical factor in a one-way ANOVA. Additionally, we conducted multiple regression with PGI allele number (per individual) and elevation as independent variables and Hsp70 expression as a dependent variable. We calculated PGI 1 allele number as follows: 1–1 homozygotes = 2, heterozygotes with the “1” allele = 1, other heterozygotes or homozygotes = 0.
Hsp70 Expression in Laboratory-Acclimated Beetles from Different Drainages.
In June, 1999, we collected beetles at Falls Site (2,950 m) in BPC and Mosquito Flat Site (3,110 m) in RC and reared them on their favored host (Salix orestera) in the laboratory for 8 days (20°C day, 4°C night). Beetles were then exposed to experimental temperatures (20, 24, 28, 30, 32, 34, or 36°C) for 4 h. After 2 h of recovery at 20°C, we flash-froze beetles and stored them at −70°C until analysis. We measured total pool levels of Hsp70 by using an anti-Hsp70 antibody that recognizes both stress-inducible and constitutive isoforms of Hsp70 in C. aeneicollis (MA3–001, Affinity Bioreagents, Golden, CO). We measured Hsp70 expression in 18 individuals (at least one beetle per temperature) and analyzed resulting data by two-way ANOVA, with drainage and temperature as main effects.
Results
Differences Among Drainages in PGI Genotype Frequencies.
Table 1 shows genotype frequencies at PGI for the nine study populations. Frequencies of the main three PGI genotypes (1–1, 1–4, and 4–4) differed greatly among drainages. Allele 1 predominated in the northern drainage (RC), allele 4 in the southern drainage (BPC), and both alleles were common in the intermediate drainage (BC). The Fst value for differentiation among drainages was 0.495 (P < 0.0001), which was consistent with previous years (31). Genotype frequencies were not significantly different from Hardy Weinberg equilibrium frequencies in any population [comparisons were made by using exact probabilities obtained from genepop and adjusting for nine significance tests by using the sequential Bonferroni procedure (44)].
Functional Properties of PGI Genotypes.
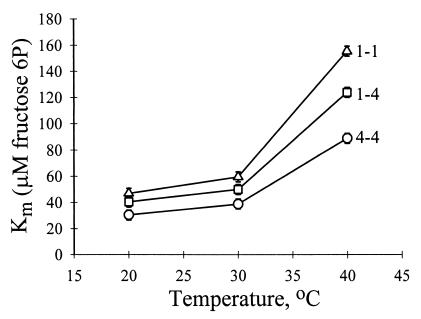
Apparent Michaelis-Menten binding constant (Km) values depended on PGI genotype and temperature (Table 2; Fig. 2). As expected, Km increased with increasing measurement temperature for all genotypes, indicating a loss of binding effectiveness at higher temperature. Km values for PGI 1–1 were greater at all temperatures than PGI 1–4 heterozygotes, which were in turn greater than PGI 4–4 homozygotes (Fig. 2). At the highest temperature (40°C), Km values for PGI 1–1 homozygotes increased more than those for the other two genotypes (Fig. 2; genotype × temperature interaction, Table 2). Arrhenius break temperature, a measure of thermal stability of enzymatic activity, corresponded with Km values (Table 3). PGI 1–1 homozygotes showed the lowest arrhenius break temperature, PGI 1–4 heterozygotes were intermediate, and PGI 4–4 heterozygotes showed the highest arrhenius break temperature. These data suggest that the PGI 1–1 genotype is more thermally labile than the PGI 4–4 genotype in C. aeneicollis.
Table 2.
Analysis of variance for Km values for the three main PGI genotypes
| Source | df | MS | F |
|---|---|---|---|
| PGI genotype | 2 | 12,457.60 | 61.5‡ |
| Temperature | 2 | 1,801.44 | 425.2‡ |
| Genotype × temperature | 4 | 384.72 | 13.1‡ |
| Error | 9 | 29.30 |
*, P < 0.05; †, P < 0.01; ‡, P < 0.001; dg, degrees of freedom; MS, mean square; F, F ratio.
Figure 2.
Differences among phosphoglucose isomerase (PGI) genotypes in effects of temperature on the Michaelis-Menten constant (Km) of F6P. Km data are least-squares means (±SE) of two samples of 10 individuals per genotype. See Table 2 for statistical analysis.
Table 3.
Differences among PGI genotypes in Arrhenius break temperature (ABT)
| PGI genotype | ABT, °C |
|---|---|
| 1-1 | 40.5 |
| 1-4 | 42.8 |
| 4-4 | 45.5 |
Geographic and Temporal Variation in Environmental Temperature.
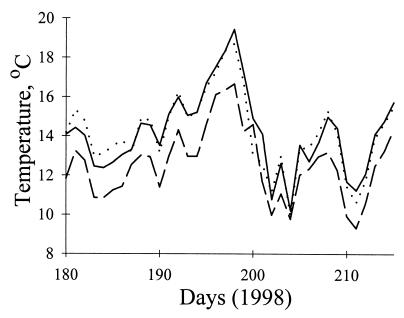
Air temperatures were greater in BPC and BC than in the northern drainage RC (Fig. 3; Table 4). Temperatures fluctuated significantly over the summer (Fig. 3; Table 4). Not surprisingly, air temperature varied significantly among time intervals within days (Table 4). Temperatures were lowest in early morning (mean Ta between 0300 and 0700 = 4.4°C) and highest in early afternoon (mean Ta between 1100 and 1500 = 25.8°C). Differences in temperature among drainages were greatest during warm, sunny periods (Fig. 3), but when weather became overcast (on day 200), all three drainages cooled [date × drainage interaction (Table 4)].
Figure 3.
Differences in ambient air temperature, Ta, between Big Pine Creek, Bishop Creek, and Rock Creek in the summer of 1998. Data are least-squares means of values obtained from dataloggers attached to willows at five localities (2,800–3,300 m) per drainage. RC (dashed line) is cooler than BC (dotted line) or BPC (solid line). See Table 3 for statistical analysis.
Table 4.
Analysis of variance for Ta at BPC, BC, and RC
| Source | df | MS | F |
|---|---|---|---|
| Drainage (D) | 2 | 782.08 | 4.0* |
| Locality (L) | 10 | 195.70 | 1.0 |
| Interval (I) | 5 | 34,188.60 | 174.8‡ |
| Date (A) | 35 | 282.27 | 99.5‡ |
| D × I | 10 | 1,165.85 | 6.0‡ |
| D × A | 70 | 5.79 | 2.0‡ |
| I × L | 50 | 195.63 | 41.5‡ |
| A × L | 350 | 2.84 | 0.6 |
| A × I | 175 | 55.46 | 11.8‡ |
| D × A × I | 350 | 8.18 | 1.7‡ |
| Error | 1750 | 4.72 |
*, P < 0.05; †, P < 0.01; ‡, P < 0.001; dg, degrees of freedom; MS, mean square; F, F ratio.
Geographic and Temporal Variation in Beetle Body Temperature.
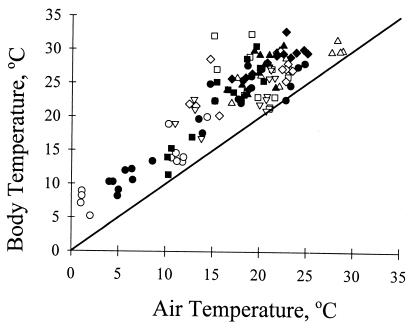
Beetle Tb depended strongly on time of day (interval) and elevation (Table 5). In addition, Tb was greater in BPC (mean = 23.5 ± 0.24°C) than BC [mean = 22.8 ± 0.24°C (Table 5)]. Air temperature (Ta) was significantly related to Tb (Fig. 4; Table 5). Nevertheless, Tb was significantly greater than Ta (paired t test, n = 121, mean = 5.74 ± 0.27°C, t = 21.1, P < 0.0001).
Table 5.
Analyses of variance for Tb and Hsp70 expression in field-collected beetles
| Source | Adult body temperature
|
Hsp70 expression
|
||||
|---|---|---|---|---|---|---|
| df | MS | F | df | MS | F | |
| Drainage (D) | 1 | 13.40 | 3.98* | 2 | 150,094 | 25.04‡ |
| Elevation (E) | 2 | 23.41 | 6.95† | 2 | 31,935 | 5.33† |
| Interval (I) | 4 | 17.49 | 5.19‡ | 4 | 26,318 | 4.39† |
| Gender (G) | 1 | 2.92 | 0.87 | 1 | 12,424 | 2.07 |
| D × E | 2 | 16.30 | 4.84* | 4 | 2,585 | 0.43 |
| D × I | 4 | 5.70 | 1.69 | 8 | 16,719 | 2.79† |
| D × G | 1 | 3.53 | 1.05 | 2 | 865 | 0.14 |
| E × I | 8 | 6.39 | 1.90 | 8 | 8,771 | 1.46 |
| E × G | 2 | 0.48 | 0.14 | 2 | 5,570 | 0.93 |
| I × G | 4 | 3.09 | 0.92 | 4 | 2,762 | 0.46 |
| D × E × I | 8 | 38.91 | 11.55‡ | 16 | 8,354 | 1.39 |
| E × I × G | 8 | 3.94 | 1.17 | 8 | 4,386 | 0.73 |
| D × E × G | 2 | 1.28 | 0.38 | 4 | 2,697 | 0.45 |
| D × I × G | 4 | 2.43 | 0.72 | 8 | 6,636 | 1.11 |
| D × E × I × G | 8 | 4.92 | 1.46 | 16 | 6,243 | 1.04 |
| Air temperature | 1 | 33.15 | 9.84† | — | — | — |
| Error | 60 | 3.37 | 90 | 5,995 | ||
Hsp70 levels are included for beetles from all three drainages whereas Tb from only BPC and BC beetles are included. *, P < 0.05; †, P < 0.01; ‡, P < 0.001; dg, degrees of freedom; MS, mean square; F, F ratio.
Figure 4.
Relationship between Ta and body temperature, Tb, for beetles from BPC and BC in July 1998. Each data point shows Ta and Tb for each individual in BPC (filled symbols) and BC (open symbols) at five time periods during the day: 0600–0830 (circles); 0930–1030 (squares); 1130–1300 (triangles); 1400–1530 (diamonds), and 1600–1730 (inverted triangles). See Table 4 and text for statistical analysis.
Variation in Hsp70 Expression Among Drainages and Elevations.
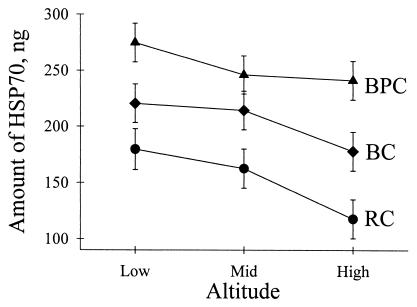
Hsp70 expression for field-collected beetles differed significantly among drainages (BPC > BC > RC), and declined significantly with elevation (Fig. 5; Table 5). Beetles collected at the warmest time of day, the early afternoon, contained more Hsp70 than those collected at other times. This effect was greater at BPC than at the other two drainages [drainage by interval interaction (Table 5)]. We detected measurable levels of the stress-inducible isoform Hsp72 in all field-collected individuals.
Figure 5.
Hsp70 expression in beetles from different elevations at BPC, BC, and RC. Data shown are least-squares means (±SE) of 10 individuals per elevation in each drainage. See Table 4 for statistical analysis.
Differences in Hsp70 Expression Among PGI Genotypes.
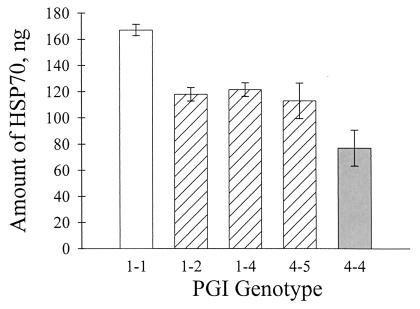
Preliminary analysis of the first set of samples revealed no effect of PGI genotype on Hsp70 expression in BPC (F2,53 = 0.04, P > 0.9) or BC (F2,55 = 0.01, P > 0.9). In RC, however, there was a trend for PGI 1–1 homozygotes to produce more Hsp70 than other genotypes (F2,51 = 1.3, P = 0.28). Results from the second Hsp70 determination revealed highly significant differences among PGI genotypes in stress protein expression [F5,21 = 18.7, P < 0.0001 (Fig. 6)]. The multiple regression of elevation and PGI allele number was consistent with the ANOVA. PGI 1 allele number was positively related to Hsp70 level, and elevation was negatively related to it (Table 6), indicating that the observed differences among PGI genotypes were not confounded by the elevation gradient in Hsp70 expression.
Figure 6.
Correlation between PGI genotype and Hsp70 expression for RC beetles. Data shown are least-squares means (±SE) of each PGI genotype (1–1, n = 10; 1–2, n = 7; 1–4, n = 7; 4–5, n = 1; 4–4, n = 1). See Table 5 and text for statistical analysis.
Table 6.
Multiple regression of PGI 1 allele number and elevation versus Hsp70 expression in Rock Creek (n = 27)
| Independent variable | Slope | SE | t | P | Partial r |
|---|---|---|---|---|---|
| No. of “F” alleles | 39.6 | 4.28 | 9.2 | <0.0001 | 0.88 |
| Elevation | −0.026 | 0.010 | −2.5 | 0.02 | −0.46 |
Hsp70 Expression in Laboratory-Acclimated Beetles from Different Drainages.
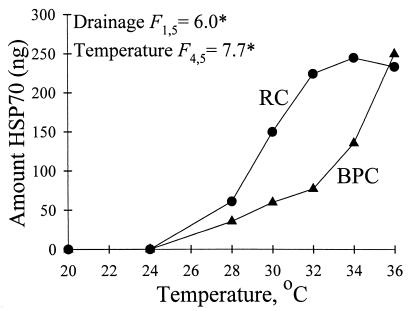
Laboratory acclimation to 20°C daytime, 4°C nighttime temperatures reduced total pool levels of Hsp70 to undetectable amounts in both BPC and RC individuals (Fig. 7). After laboratory heat shock, we detected increased Hsp70 levels at or above 28°C for both RC and BPC beetles; however, at 30–34°C, Hsp70 levels were greater for RC than BPC beetles (Fig. 7).
Figure 7.
Hsp70 expression for laboratory-acclimated RC and BPC beetles after heat exposure. Data points represent means of duplicate runs for one individual per drainage per temperature (except BPC at 34°C, which represents a mean of two individuals). (Top Left) Significance tests for two-way ANOVA.
Discussion
In this study, we report functional and physiological differences among PGI genotypes that provide us with a possible mechanism for how natural selection may act on PGI in Chrysomela aeneicollis. We document differences among drainages in environmental temperature that correspond to the natural distribution of PGI genotypes. Specifically, PGI allele 1 predominated in Rock Creek (RC), where summer temperatures were relatively cool, whereas PGI allele 4 predominated in Big Pine Creek (BPC), where summer temperatures were significantly warmer. Allele frequencies and air temperatures were intermediate in BC. Hsp70 levels in adult beetles reflect local environmental temperature variation, and our results indicate that beetles often experience body temperatures high enough to induce production of Hsp70. We found that 50% of beetles sampled in late morning and early afternoon were warmer than the threshold temperature for Hsp70 expression in the laboratory (28°C).
Functional Differences Among PGI Genotypes.
The pattern of Km values at all assay temperatures (1–1 > 1–4 > 4–4) and thermal stability (4–4 >1–4 > 1–1) suggests that there are consistent functional differences among PGI genotypes. Genotype 1–1 begins to lose function (i.e., has a higher Km) at lower temperatures than genotype 4–4, and heterozygotes possessed intermediate thermal stability and Km values. Thus, functional properties of PGI allozymes are related to environmental conditions in which each genotype predominates. These results are consistent with current models of protein adaptation to temperature (3, 15, 45) and with previous studies of ectotherms that have shown other glycolytic enzyme variants (either allozymes or isozymes) vary in an apparently adaptive way along latitudinal gradients (15, 45–47).
Temperature has been implicated as the most important environmental factor affecting PGI polymorphisms in several organisms (32, 34, 48–50). In Colias butterflies, PGI heterozygotes for certain alleles have lower Km values (implying higher binding effectiveness) at high temperatures than homozygotes. Differences in fecundity and male mating attributable to differential flight performance suggest balancing selection on PGI in Colias (5, 11, 51). Our data for C. aeneicollis suggest that the 1–4 heterozygote has intermediate functional properties between 4–4 and 1–1 homozygotes. The geographic distribution of PGI genotypes implies that directional selection may favor different genotypes in different drainages, rather than balancing selection for the heterozygote as observed in Colias.
Environmental Variation and Its Physiological Consequences.
Our results, based on the summer of 1998, suggest that BPC was, on average, warmer than the intermediate drainage BC, which was warmer than RC. Preliminary results from the summer of 1999 showed the same pattern (data not shown). Although these differences in air temperature are consistent with small differences in latitude, they may also reflect physical features of the landscape (e.g., orientation of mountain peaks, slope aspect, or width of glacial valleys). It appears that habitats south of BPC are outside the range of C. aeneicollis (data not shown). Because this beetle is common in Oregon, Montana, and western Canada (29), the populations we examined may lie at the edge of this species' natural thermal tolerance.
Differences in environmental temperature between drainages and among elevations appear to cause differences in Hsp70 production for adult C. aeneicollis in nature. Levels of Hsp70 in field-collected beetles declined with increasing elevation and were lower in RC than in BC or BPC. It appears that Hsp70 production is a good indicator of environmental temperature variation in this beetle, whose body temperatures are closely correlated with air temperature. Previous studies of other ectotherms reveal that each species has its own stress protein expression profile and that Hsp70 expression is a physiologically plastic response to environmental temperature variation (27, 43, 52–54).
The results of the laboratory Hsp70 induction experiment suggest that beetles regularly experience temperatures high enough to induce Hsp70 production in nature. After acclimation to moderate temperatures for 8 days in the laboratory, both BPC and RC beetles not subsequently exposed to high temperature had very low tissue levels of Hsp70 (including non-inducible cognates). In contrast, we found measurable levels of Hsp70 in all 197 field-collected beetles. It appears that this beetle regularly experiences ambient temperatures high enough to induce the potentially costly heat shock response under natural conditions.
Physiological Consequences of PGI Variation.
Our results demonstrate differences in Hsp70 production among PGI genotypes, which correspond to differences in Km and thermal stability among PGI genotypes. The functional data indicate that 1–1 genotypes are more effective at lower temperatures and unfold more readily at higher temperatures than other genotypes. The physiological data reveal that the 1–1 genotype produced higher levels of Hsp70 than other genotypes in natural populations.
To explain these results, we propose that that the proteins of 1–1 homozygotes unfold at lower temperatures, and beetles must therefore launch a more vigorous stress response than beetles that possess other genotypes. It is possible, however, that the link between enzyme genotype and Hsp production can only be detected in cooler environments. If environmental temperatures exceed a certain threshold, Hsps may be produced at similarly acclimatized high levels, regardless of enzyme genotype. Our results on both field- and laboratory-acclimated beetles support this view. First, we found no relationship between PGI genotype and Hsp production in field collected beetles from BC or BPC, where overall levels of Hsp production were higher than in RC. Second, at lower temperatures, laboratory-acclimated beetles from RC produced higher levels of Hsps than BPC beetles, but, at 36°C, beetles from both drainages produced similar levels of Hsps.
Conclusions
The data presented here demonstrate a link between stress-protein expression and enzyme genotype for natural populations of montane insects, which is consistent with previous studies of laboratory organisms (55–57). To fully understand the process of local adaptation to temperature, we must investigate organisms with naturally occurring variants in traits from a variety of habitats. This is especially true for populations of organisms that are likely to be sensitive to rapid fluctuations in climate that are the hallmark of global climate change. Studies of C. aeneicollis population dynamics for the past decade indicate that this beetle is very sensitive to climatic variation (28, 31, 58). Increases in the frequency or magnitude of such temperature variation may result in altitudinal shifts and, eventually, local extinction of Sierra populations, as has occurred in other montane species (59).
Acknowledgments
We thank W. Watt, G. Somero, and an anonymous reviewer for insightful comments that greatly improved the manuscript. We thank our research team: K. Deiner, S. Hurley, D. McMillan, J. Lundblad, B. Rodomsky, J. Troll, K. Yturralde, J. Zatorski, M. Zumwalt, and T. Roo for invaluable assistance in the field and laboratory. We thank J. Smiley for insights and assistance in the field. We gratefully acknowledge F. Powell and the staff of White Mountain Research Station for their support of our research program. We thank H. Carey and the Welch laboratory at the University of California at San Francisco for their assistance in helping us screen stress protein antibodies. Finally, we thank W. Watt for assistance and use of his lab for development of PGI assays. This work was funded by a National Science Foundation grant (IBN-9808835-36) to N.E.R. and E.P.D. (1998–2000), and a Faculty Research Enhancement grant to N.E.R. (Sonoma State University). We dedicate this paper to the memory of John David Rank (1929–1999), whose love and curiosity about the natural world is still an inspiration to us.
Abbreviations
- RC
Rock Creek
- BC
Bishop Creek
- BPC
Big Pine Creek
- PGI
phosphoglucose isomerase
Footnotes
Article published online before print: Proc. Natl. Acad. Sci. USA, 10.1073/pnas.160277697.
Article and publication date are at www.pnas.org/cgi/doi/10.1073/pnas.160277697
References
- 1.Avise J C. Molecular Markers, Natural History, and Evolution. New York: Chapman & Hall; 1994. [Google Scholar]
- 2.Li W. Molecular Evolution. Sunderland, MA: Sinauer; 1997. [Google Scholar]
- 3.Gillespie J H. The Causes of Molecular Evolution. New York: Oxford Univ. Press; 1991. [Google Scholar]
- 4.Hilbish T J, Koehn R K. Science. 1985;229:52–54. doi: 10.1126/science.4012310. [DOI] [PubMed] [Google Scholar]
- 5.Watt W B, Carter P A, Donohue K. Science. 1986;89:1187–1190. doi: 10.1126/science.3738528. [DOI] [PubMed] [Google Scholar]
- 6.Watt W B, Cassin R C, Swan M S. Genetics. 1983;103:725–729. doi: 10.1093/genetics/103.4.725. [DOI] [PMC free article] [PubMed] [Google Scholar]
- 7.DiMichele L, Powers D A. Nature (London) 1982;296:563–564. doi: 10.1038/296563a0. [DOI] [PubMed] [Google Scholar]
- 8.DiMichele L, Powers D A. Science. 1982;216:1014–1016. doi: 10.1126/science.7079747. [DOI] [PubMed] [Google Scholar]
- 9.Place A R, Powers D A. Proc Natl Acad Sci USA. 1979;76:2354–2358. doi: 10.1073/pnas.76.5.2354. [DOI] [PMC free article] [PubMed] [Google Scholar]
- 10.Place A R, Powers D A. J Biol Chem. 1984;259:1309–1318. [PubMed] [Google Scholar]
- 11.Watt W B. Proc Natl Acad Sci USA. 1992;89:10608–10612. doi: 10.1073/pnas.89.22.10608. [DOI] [PMC free article] [PubMed] [Google Scholar]
- 12.Watt W B. Genetics. 1994;136:11–16. doi: 10.1093/genetics/136.1.11. [DOI] [PMC free article] [PubMed] [Google Scholar]
- 13.Mitton J B. Selection and Natural Populations. New York: Oxford Univ. Press; 1997. [Google Scholar]
- 14.Dahlhoff E P, Somero G N. J Exp Biol. 1993a;185:137–150. [Google Scholar]
- 15.Somero G N. Annu Rev Physiol. 1995;57:43–68. doi: 10.1146/annurev.ph.57.030195.000355. [DOI] [PubMed] [Google Scholar]
- 16.Lin J J, Somero G N. Physiol Zool. 1995;68:114–128. [Google Scholar]
- 17.Cossins A R, Bowler K. Temperature Biology of Animals. New York: Chapman & Hall; 1987. [Google Scholar]
- 18.Prosser C L. Adaptational Biology: Molecules to Organisms. New York: Wiley; 1986. [Google Scholar]
- 19.Heinrich B. The Hot-Blooded Insects: Strategies and Mechanisms of Thermoregulation. Cambridge, MA: Harvard Univ. Press; 1993. [Google Scholar]
- 20.Hofmann G E. Am Zool. 1999;39:889–900. [Google Scholar]
- 21.Parsell D A, Lindquist S. Annu Rev Genet. 1993;27:437–496. doi: 10.1146/annurev.ge.27.120193.002253. [DOI] [PubMed] [Google Scholar]
- 22.Parsell D A, Taulien J, Lindquist S. Philos Trans R Soc London B. 1993;339:279–856. doi: 10.1098/rstb.1993.0026. [DOI] [PubMed] [Google Scholar]
- 23.Lindquist S. Annu Rev Biochem. 1986;55:1151–1191. doi: 10.1146/annurev.bi.55.070186.005443. [DOI] [PubMed] [Google Scholar]
- 24.Loeschcke V, Krebs R A, Dahlgaard J, Michalak P. Experimentia. 1997;83:175–190. doi: 10.1007/978-3-0348-8882-0_10. [DOI] [PubMed] [Google Scholar]
- 25.Krebs R A, Feder M E. J Insect Physiol. 1998;44:1091–1101. doi: 10.1016/s0022-1910(98)00059-6. [DOI] [PubMed] [Google Scholar]
- 26.Krebs R A, Loeschcke V. Genetics. 1996;142:471–479. doi: 10.1093/genetics/142.2.471. [DOI] [PMC free article] [PubMed] [Google Scholar]
- 27.Feder M E. Am Zool. 1999;39:857–864. [Google Scholar]
- 28.Smiley J T, Rank N E. Oecologia (Berlin) 1986;70:106–112. doi: 10.1007/BF00377117. [DOI] [PubMed] [Google Scholar]
- 29.Brown W J. Can Entomol. 1956;88:1–54. [Google Scholar]
- 30.Rank N E. Oecologia (Berlin) 1994;97:342–353. doi: 10.1007/BF00317324. [DOI] [PubMed] [Google Scholar]
- 31.Rank N E. Evolution (Lawrence, Kans) 1992;46:1097–1111. doi: 10.1111/j.1558-5646.1992.tb00622.x. [DOI] [PubMed] [Google Scholar]
- 32.Carter P A, Watt W B. Genetics. 1988;119:913–924. doi: 10.1093/genetics/119.4.913. [DOI] [PMC free article] [PubMed] [Google Scholar]
- 33.Watt W B. Genetics. 1977;87:177–194. doi: 10.1093/genetics/87.1.177. [DOI] [PMC free article] [PubMed] [Google Scholar]
- 34.Jacobs M D, Watt W B. Funct Ecol. 1994;8:366–376. [Google Scholar]
- 35.Weir B S, Cockerham C C. Evolution (Lawrence, Kans) 1984;38:1358–1370. doi: 10.1111/j.1558-5646.1984.tb05657.x. [DOI] [PubMed] [Google Scholar]
- 36.Raymond M, Rousset F. J Hered. 1995;86:248–249. [Google Scholar]
- 37.Goudet J. J Hered. 1995;86:485–486. [Google Scholar]
- 38.Watt W B, Donohue K, Carter P A. Mol Biol Evol. 1996;13:699–709. [Google Scholar]
- 39.Watt W B. Genetics. 1983;103:691–724. doi: 10.1093/genetics/103.4.691. [DOI] [PMC free article] [PubMed] [Google Scholar]
- 40.Dahlhoff E P, Somero G N. J Exp Biol. 1996;185:151–168. [Google Scholar]
- 41.Dahlhoff E P. Ph. D. dissertation. San Diego: Univ. of California; 1993. [Google Scholar]
- 42.Roberts D A, Hofmann G E, Somero G N. Biol Bull. 1997;192:309–320. doi: 10.2307/1542724. [DOI] [PubMed] [Google Scholar]
- 43.Rice W R. Evolution (Lawrence, Kans) 1989;43:223–225. doi: 10.1111/j.1558-5646.1989.tb04220.x. [DOI] [PubMed] [Google Scholar]
- 44.Somero G N, Dahlhoff E P, Lin J J. In: Animals and Temperature: Phenotypic and Evolutionary Adaptation. Johnston I A, Bennett A F, editors. Vol. 59. Cambridge, U.K.: Cambridge Univ. Press; 1996. pp. 53–78. [Google Scholar]
- 45.Place A R, Powers D A. Biochem Genet. 1978;16:577–591. doi: 10.1007/BF00484221. [DOI] [PubMed] [Google Scholar]
- 46.Lin J J, Somero G N. J Exp Biol. 1995b;198:551–560. doi: 10.1242/jeb.198.2.551. [DOI] [PubMed] [Google Scholar]
- 47.Graves J E, Somero G N. Evolution (Lawrence, Kans) 1982;36:97–106. doi: 10.1111/j.1558-5646.1982.tb05014.x. [DOI] [PubMed] [Google Scholar]
- 48.Hoffmann R J. Biochem Genet. 1981;19:145–154. doi: 10.1007/BF00486144. [DOI] [PubMed] [Google Scholar]
- 49.Zera A J. Mol Biol Evol. 1987;4:266–286. doi: 10.1093/oxfordjournals.molbev.a040445. [DOI] [PubMed] [Google Scholar]
- 50.Watt W B. Funct Ecol. 1991;5:145–154. [Google Scholar]
- 51.Watt W B, Carter P A, Blower S M. Genetics. 1985;109:157–175. doi: 10.1093/genetics/109.1.157. [DOI] [PMC free article] [PubMed] [Google Scholar]
- 52.Krebs R A, Feder M E. Evolution (Lawrence, Kans) 1997;51:173–179. doi: 10.1111/j.1558-5646.1997.tb02398.x. [DOI] [PubMed] [Google Scholar]
- 53.Feder M E, Hofmann G E. Annu Rev Physiol. 1999;61:243–282. doi: 10.1146/annurev.physiol.61.1.243. [DOI] [PubMed] [Google Scholar]
- 54.Tomanek L, Somero G N. J Exp Biol. 1999;202:2925–2936. doi: 10.1242/jeb.202.21.2925. [DOI] [PubMed] [Google Scholar]
- 55.Stephanou G, Alahiotis S N, Christodoulou C, Marmaras V. Dev Genet. 1983;3:299–308. [Google Scholar]
- 56.Stephanou G, Alahiotis S N. Genetica. 1986;69:59–68. [Google Scholar]
- 57.Hoffmann A A, Parsons P A. Evolutionary Genetics and Environmental Stress. New York: Oxford Univ. Press; 1991. [Google Scholar]
- 58.Rank N E. Oecologia (Berlin) 1992;90:95–101. doi: 10.1007/BF00317814. [DOI] [PubMed] [Google Scholar]
- 59.Parmesean C, Ryrholm N, Stefanescu C, Hill J K, Thomas C D, Descimon H, Huntley B, Kaila L, Kullberg J, Tammaru T, Tennent W J, Thomas J A, Warren M. Nature (London) 1999;399:579–583. [Google Scholar]


