

Abstract
Objective
Recent morphometric studies suggest that children with ADHD may demonstrate differential or delayed brain development than children without ADHD. Further, the regions that appear to be affected are regions that control attention and executive functioning. This study examines the developmental course of brain activation patterns during an attention task.
Method
Ten adolescents with ADHD and 14 normal controls performed a continuous performance task twice one year apart. fMRI scans were collected at each timepoint.
Results
In the absence of performance differences, children with ADHD and normal controls activated frontal-parietal regions while performing an attention task at initial testing. One year later, the normal control group evidenced no task-related areas of activation while performing the same task while the children with ADHD showed less activation at the second testing but continued to evidence task-related activations in bilateral frontal areas and left parietal lobe at the time of the second testing. In particular, children with ADHD appeared to require continued use of the right middle frontal gyrus during administration of testing one year apart while normal controls did not activate this region at the time of the second testing.
Conclusions
Children with ADHD appear to maintain the use of right prefrontal regions during attentional tasks beyond what is observed among normal controls. Given observed cortical thinning in corresponding brain regions, future research must address the recipocal effects of volumetric reductions and a continued need for using these regions to perform basic attentional tasks.
Attention-deficit/hyperactivity disorder (ADHD) is a behavioral disorder usually diagnosed in childhood. ADHD is defined by three core behavioral domains: inattention, hyperactivity, and impulsivity. A recent national study of 8–15 year-old school children found an 8.6% prevalence of ADHD {Froehlich, 2007 #9186}. Multiple points of evidence suggest a biological basis to the disorder including high heritability rates, molecular genetic associations, and the efficacy of pharmacological treatment at ameliorating the core symptoms of ADHD {Faraone, 2005 #8706;Group, 1999 #8342}.
While some form of neurochemical, neurofunctional, or neuroanatomical brain abnormality is likely implicated in the etiology of ADHD, the localization of that deficit within the brain has not been resolved. ADHD-related neuropsychological deficits provide some preliminary evidence regarding localization of functional brain abnormalities. Several reviews and meta-analyses {Hervey, 2004 #8545; Willcutt, 2005 #8677} indicate a variety of ADHD-related neuropsychological impairments including attention, working memory and response inhibition, that appear to be deficient in both pediatric and adult patients with ADHD.
In the past two decades, imaging technologies have emerged which allow a more direct investigation of ADHD-related brain abnormalities. Unlike the administration of neuropsychological batteries where multiple tests measuring multiple domains can be used, most imaging studies are limited to approximately one hour during which a small number of behavioral paradigms can be administered to assess brain function. Several ADHD functional brain imaging studies have chosen to examine brain function using response inhibition paradigms (see {Bush, 2005 #9398} for review). Across these studies, there appears to be a trend for patients with ADHD to underactivate frontal cortices during response inhibition {Dickstein, 2006 #9843}.
It is interesting that relatively few imaging studies have focused on attentional functioning. Indeed, attention is one of the defining domains of ADHD and the first neuroimaging findings with ADHD patients were reported using versions of an attentional Continuous Performance Tasks (CPT) {Ernst, 1994 #1843;Zametkin, 1990 #6324;Zametkin, 1993 #6326}. Using PET, Zametkin et al {Zametkin, 1990 #6324;Zametkin, 1993 #6326} found decreased cerebral glucose metabolism in the frontal lobes among adolescents and adults with ADHD while performing a CPT task.
More recently, Tamm et al. {Tamm, 2006 #8896} found no group differences in fMRI activation in the frontal cortices using an oddball task. Rather, decreased activation among patients with ADHD was noted in the cingulate, parietal lobe, and thalamus. Another study {Adler, 2005 #8916} compared the performance of children with bipolar disorder to children with bipolar disorder and ADHD on a CPT task using fMRI. Children with comorbid bipolar + ADHD had less activation in ventrolateral prefrontal cortex (Brodmann’s Area 10) and anterior cingulate and increased activation in posterior parietal cortex and middle temporal gyrus than children with bipolar disorder alone.
On other attentional non-CPT tasks, investigators have documented activation abnormalities among ADHD patients in frontal {Vaidya, 2005 #8781; Konrad, 2006 #8904; Zang, 2005 #8920;Booth, 2005 #8972}, parietal {Booth, 2005 #8972;Vaidya, 2005 #8781;Konrad, 2006 #8904}, basal ganglia {Konrad, 2006 #8904; Zang, 2005 #8920;Shafritz, 2004 #8568;Booth, 2005 #8972}, dorsal ACC {Zang, 2005 #8920; Bush, 1999 #8010}, and temporal lobe regions {Shafritz, 2004 #8568}. Taken together, findings converge upon a pattern of fronto-parietal-striatal underactivation for patients with ADHD when performing attention tasks.
While ADHD-related functional abnormalities have been noted on attentional tasks, the developmental course of brain activation abnormalities associated with ADHD has not been studied using any tasks. Indeed, to date there are no functional imaging studies conducted with ADHD patients that include multiple imaging sessions across time. Longitudinal morphometric studies with ADHD patients have shown that the volumetric development of children with ADHD may be different than that of normals. In particular, it appears that grey matter development lags behind that of normals until adolescence when grey matter development begins to approach volumes similar to normals {Castellanos, 2002 #8529}, however within the cortex, this normalization effect may be localized to parietal regions {Shaw, 2006 #8900}. White matter development, on the other hand, appears to be continually smaller than that of normals throughout childhood and adolescence {Castellanos, 2002 #8529}. It is unknown at this time how these morphometric developmental differences may affect functional activation patterns throughout development.
The present study compares brain activation patterns in adolescents with ADHD and a matched group of normal controls at two timepoints one year apart while performing an attentional CPT. The CPT used in this study contains a parametric manipulation of task difficulty. Task difficulty is manipulated by varying the visual clarity of stimuli. Stimuli that are more difficult to discern are posited to involve increased attentional demands. The advantage of such a parametric manipulation is that areas of the brain that increase in activation with increased task difficulty can be more accurately associated with attentional ability as opposed to a more simple task vs. control condition comparison. Durston et al. {Durston, 2003 #9438} used a similar parametric manipulation with a response inhibition task to demonstrate that the behavioral performance of children with ADHD at the “easy” level of the task manipulation (i.e., preceding context) was equivalent to that of normal controls at the more difficult levels of the task. However, there was no effect of the task manipulation on brain activation even though brain activation patterns across groups were disparate.
Methods
Participants
Adolescents with a diagnosis of ADHD (any subtype; n=10) were recruited by newspaper advertisements. Patients were included in this study if they were 12–18 years old and met DSM-IV criteria for ADHD as determined by the Kiddie-Schedule for Affective Disorders and Schizophrenia (WASH-U KSADS) {Geller, 2001 #9844}. The KSADS was administered by trained child and adolescent psychiatrists with established diagnostic reliability (diagnostic kappa=0.94, {Delbello, 2001 #9845}.
Healthy participants (N =14) between the ages of 12–18 years old, matched for age, education, race and sex to the ADHD sample were recruited from the community. Healthy participants were excluded for a history of psychiatric illness in themselves or any first-degree relative. The absence of any diagnosis was confirmed with the KSADS.
Participants in both groups were also excluded for any of the following: (1) a lifetime history of substance dependence or a history of a substance abuse within the prior three months; (2) IQ less than 70 as measured by the Wechsler Abbreviated Scales of Intelligence (WASI); (3) an unstable medical or neurological disorder; (4) a history of head trauma resulting in a loss of consciousness for greater than 10 min; or (5) a self-rated Tanner stage (Morris and Udry, 1980) of <3.
Adolescent participants provided written assent and their parents or legal guardians provided written informed consent after study procedures were fully explained. This study was approved by the University of Cincinnati and the Cincinnati Children’s Hospital Medical Center Institutional Review Boards.
Study Design
All participants participated in an initial assessment to determine if they met all inclusion/exclusion criteria. Participants were then scheduled for an imaging visit to the Cincinnati Children’s Hospital Medical Center Imaging Research Center (IRC) where they were placed in the MRI scanner while performing the CPT-IP. Approximately 1 year (Mean=13.5 months, sd=1.4 months) later, all participants returned to the IRC to perform the CPT-IP task in the MRI scanner again.
Behavioral Paradigm
A computerized version of an Identical Pairs Continuous Performance Task (CPT-IP) was administered as a parametric task of sustained attention. During the CPT-IP, participants viewed random single-digit numbers, which were presented every 750 ms. Participants were instructed to respond by pressing a button with their dominant hand as quickly and as accurately as possible each time the same single digit appeared twice in succession.
The random pixel substitution program incorporated into PsyScope was used to systematically degrade the stimuli by one (25%) or two (50%) levels, resulting in three levels of attentional demand (0%, 25% and 50% degradation). The CPT-IP was presented in a periodic block-design paradigm in which five 30-s intervals of the three attention conditions were randomly interleaved.
There were five target responses for each 30-s. Therefore, for each of the three attention conditions (no degradation, 25% degradation, and 50% degradation), there were a total of 25 target responses (five correct responses/30-s interval×five 30-s intervals of each degradation level) out of 200 (12.5%) stimuli.
The CPT-IP was administered to all participants using PsyScope running on a MacIntosh PowerBook computer. All participants completed the task while in the scanner. Participants responded to targets using a button box. The responses were electronically recorded to permit calculation of response parameters of interest (i.e. discriminability, percent correct, false positive responses and reaction time).
A control condition was included within the task to provide an appropriate contrast to the task condition. For the first block of the task and again after the presentations of each block of the 3 degradation conditions, participants completed a 30-sec block of the control task. Participants were alerted by a set of visual directions (i.e., “Control Task”) letting them know that the following block was the control task. Participants then observed a single stimulus (i.e., the number “1”) and were asked to press the response pad five times. Participants were free to rest for the remainder of the interval.
fMRI acquisition and processing
The scans were performed on a Bruker Biospec 30/60 MRI scanner based on a 60 cm, 3.0 Tesla magnet (Bruker Medizintechnik, Karlsruhe, Germany). A T2*-weighted, gradient-echo, EPI sequence was used for fMRI scans with the following parameters: TR/TE= 3000/38 msec, FOV = 25.6 × 25.6 cm, matrix = 64 × 64, slice thickness = 5mm, flip angle 90°. Twenty-four slices were acquired at 311 time points during the alternating 30 second periods of control and activation randomly mixed with a different order of 3 degradation levels for a total imaging time of 15 min, 30 sec. The initial 11 time points were discarded to allow the protons to reach T1 relaxation equilibrium. In addition, a 3D MDEFT (Modified Driven Equilibrium Fourier Transform) whole brain scan was obtained for each subject. Parameters for this scan are as follows: TR/TE/tau = 15.0/4.5/563 msec, FOV=19.2 × 25.6 × 19.2 cm, matrix = 128 × 256 × 128, total imaging time = 7 min. 20 sec. A three-dimensional phase reference image was obtained prior to the EPI functional scans. This phase map was used during reconstruction to correct simultaneously for Nyquist artifacts and geometrical distortion, which can cause severe misregistration between the anatomical and functional images at 3T and higher field strengths {Schmithorst, 2001 #9853}.
Each participant has two sets of scans (Time 1 and Time 2). Hence, 48 fMRI scans were obtained in the dataset. The fMRI scans of three normal control participants at time 1 and one normal control and one ADHD participant at time 2 were excluded due to poor image quality which results from excessive motion. The remaining 43 scans were used for all subsequent analysis.
Statistical analysis
Group comparisons in demographic and clinical variables were performed using analyses of variance for continuous variables and chi-square tests for dichotomous variables. ANCOVA models using group (ADHD and normal control), degradation level, and time were used to test each CPT-IP outcome variable (i.e., hit rate, RT, discriminability). Parametric estimates of discriminability (d-prime) were calculated according to Macmillan and Creelman {Macmillan, 1991 #9856}. Medication use on the day of testing was entered as a covariate in all testing of task outcome measures.
For image analyses, we conducted an region of interest (ROI) voxel-based analyses using Statistical Parametric Mapping software (SPM5, Welcome Department of Cognitive Neurology, UK). The original functional images were realigned, spatially normalized to the Montreal Neurological Institute (MNI) template and smoothed with an 8-mm full width and half maximum Gaussian filter. Individual runs exhibiting 2mm in point to point translation head motion were removed from the study (see fMRI acquisition section for details on excluded scans).
Statistical analysis at individual level was performed using the general linear model implemented in SPM5 {Friston, 1995 #9855; Friston, 1995 #9854}. Since the design calls for a factorial analysis where degradation level is crossed with task, the initial analysis for each subject at each time point involved modeling signal intensity as a function of task, degradation and the interaction between task and degradation levels. Each block of rest and task trials were modeled using a boxcar function convolved with a canonical hemodynamic response function. After estimating the model, a linear contrast (F-contrast) was used to test the relative effects of task and degradation and their interaction. We also generated t-contrast maps for each potential pairwise contrast. These contrast t-images for each subject were then submitted to a random effects group analysis using a one sample t-test for determining differences between task and rest conditions within each group and two sample t tests for comparing contrasts across groups. However none of the interaction terms nor the main effect of degradation in either group was statistically significant in any of the analyses. Therefore our final analyses are based on combining data across the three levels of degradation. For group level analysis we combined the data across group and time using a repeated measure analysis of variance where time is treated as a within subject factor and group and the interaction term between group and time also included in the model. The combined analysis (instead of analyzing the data at each time point or for each group separately) has more power and lends itself to handle other covariates of interest readily. We include two covariates of interest in our models: 1) medication use on the day of testing and 2) performance as measured by d-prime.
A region of interest (ROI) mask was used when examining areas of activation for all analyses. ROIs that have shown activations on the CPT-IP attentional task (cites: Cal to add) or similar attentional tasks (cites: Cal to add) were identified and were the only brain regions that were examined for activation differences. ROIs included bilateral frontal lobes (Brodmanns areas [BA] 9, 10, & 12), anterior cingulate gyrus, posterior cingulate, striatum, parahippocampal gyrus, hippocampus, and inferior parietal lobe. Within each region, activations were examined on a voxel by voxel basis. Regions were considered significant at p<0.005 (uncorrected) statistical significance and a cluster extent threshold greater than 5 voxels.
Results
Behavioral Results
Using the same sample as was used for the imaging analyses, means and sds were computed for several performance outcomes including hit rate, reaction time, and discriminability (dprime). See Table 1. ANCOVAs were conducting using time, parametric level, and group status as independent variables and medication status on the day of testing as a covariate. Parametric degradation level was significant for reaction time (p>.01) and for dprime (p<.05) but was not significant for hit rate (p=.07). For RT, the 50% degradation condition produced slower RTs than both other degradation conditions (p<.05). For dprime, the 25% degradation condition produced higher values of dprime than both the 0% and 50% degradation conditions (p<.05). The main effect of group status was non-significant across all variables (p>.75). There was a main effect of visit only for reaction time (p<.0001) but this effect must be interpreted in light of a group × visit interaction effect whereby the children with ADHD demonstrated significant improvements in RT from Time 1 to Time 2 but the normal control group did not.
Table 1.
Demographic information and behavioral task performance at Time 1 and Time 2
| Time 1 | Time 2 | |||
|---|---|---|---|---|
| Variable | ADHD | NC | ADHD | NC |
| N = 10 | N = 11 | N = 9 | N = 13 | |
| Demographics | ||||
| Age | 14.8 (1.7) | 15.5 (2.2) | 15.9 (1.7) | 16.5(2.2) |
| Sex N (%) | 1 (10) | 6 (55) | 1 (11) | 6 (46) |
| Race, Caucasian, N (%) | 10 (100) | 8 (73) | 9(100) | 10 (77) |
| WASI, Full Scale IQ | 114.8 (111.9) | 106.6 (7.6) | 112.9 (11.2) | 111.1 (11.7) |
| Taking stimulant medication, N(%) | 4 (40) | 0 (0) | 5 (50) | 0 (0) |
| Behavioral Task Performance | ||||
| 0% Degradation | ||||
| Discriminability, mean (SD) | 6.07 (2.95) | 7.11 (3.05) | 7.30 (2.68) | 6.65 (3.42) |
| Hit rate, mean (SD) | 0.83 (.19) | 0.87 (0.18) | 0.88 (0.21) | 0.82 (0.25) |
| Reaction time, ms, mean (SD) | 672.89 (68.13) | 625.43 (85.02) | 622.22 (73.02) | 640.80 (95.89) |
| 25% Degradation | ||||
| Discriminability, mean (SD) | 6.83 (2.77) | 7.61 (2.65) | 7.49 (2.72) | 7.14 (3.14) |
| Hit rate, mean (SD) | 0.88 (.15) | 0.92 (0.13) | 0.87 (0.22) | 0.85 (0.25) |
| Reaction time, ms, mean (SD) | 668.33 (68.40) | 643.04 (69.52) | 612.42 (76.12) | 632.86 (83.72) |
| 50% Degradation | ||||
| Discriminability, mean (SD) | 6.00 (3.20) | 7.27 (2.85) | 6.55 (3.24) | 6.61 (3.36) |
| Hit rate, mean (SD) | 0.82 (.20) | 0.89 (0.18) | 0.84 (0.20) | 0.84 (0.24) |
| Reaction time, ms, mean (SD) | 675.42 (68.25) | 640.86 (69.74) | 643.82 (77.23) | 649.74 (86.85) |
Imaging Results
Task-related brain activation patterns in ADHD and normal controls
Comparing the CPT-IP task condition to the control condition, both the ADHD and control groups demonstrated task-related activation in frontal and parietal areas. At Time 1, children with ADHD activated bilateral frontal lobe regions including right and left inferior frontal gyrus (BA 9 & 10), left middle frontal gyrus (BA 10), right superior frontal gyrus (BA 10), and cingulate (BA 9). In addition, children with ADHD acrivated left inferior parietal lobe (BA 40). At Time 1, the normal control group activated left middle frontal gyrus (BA 9), right inferior frontal gyrus (BA 9), and the left supramarginal gyrus in the parietal lobe (BA 40). At Time 2, both groups evidenced fewer areas of activation. The normal control group showed no statistically significant areas of task-related activation. The ADHD group demonstrated task-related activations in bilateral middle frontal gyrus (BA9) at Time 2. See Table 2 and Figure 1.
Table 2.
Significant differences in activation on CPT-IP task (vs. rest) in ADHD and normal control groups
| Brain region | Brodmann’s Area | Talaraich Coordinates | Contrast | t-value Max | Volume | ||
|---|---|---|---|---|---|---|---|
| X | Y | Z | |||||
| ADHD Group | |||||||
| Time 1 | |||||||
| Left Frontal Lobe/IFG | 9 | −48 | 10 | 27 | Task>Control | 8.11 | 192 |
| Right Frontal Lobe/IFG | 9 | 48 | 4 | 30 | Task>Control | 5.18 | 74 |
| Left Parietal Lobe/Inferior Parietal Lobule | 40 | −33 | −53 | 39 | Task>Control | 5.67 | 122 |
| Right Frontal Lobe/SFG | 10 | 33 | 51 | 21 | Task>Control | 5.44 | 28 |
| Left Frontal Lobe/MFG | 10 | −36 | 50 | 0 | Task>Control | 5.25 | 5 |
| Right Frontal Lobe/IFG | 10 | 45 | 47 | −2 | Task>Control | 4.71 | 6 |
| Left Frontal Lobe/Cingulate Gyrus | 9 | −6 | 28 | 32 | Task>Control | 4.62 | 37 |
| Time 2 | |||||||
| Left Frontal Lobe/MFG | 9 | −48 | 13 | 30 | Task>Control | 4.61 | 28 |
| Right Frontal Lobe/MFG | 9 | 48 | 13 | 30 | Task>Control | 3.78 | 8 |
| Normal Control Group | |||||||
| Time 1 | |||||||
| Left frontal lobe/MFG | 9 | −50 | 5 | 36 | Task > Control | 7.05 | 119 |
| Right frontal lobe/IFG | 9 | 50 | 5 | 33 | Task > Control | 5.37 | 55 |
| Left parietal lobe/Supramarginal gyrus | 40 | −45 | −45 | 35 | Task > Control | 3.90 | 15 |
| Time 2 | |||||||
| None | |||||||
Note: Statistical significance of p<.001 was used along with a contiguous cluster threshold of 5 voxels; Control>Task was also tested but no significant areas of activation were noted.
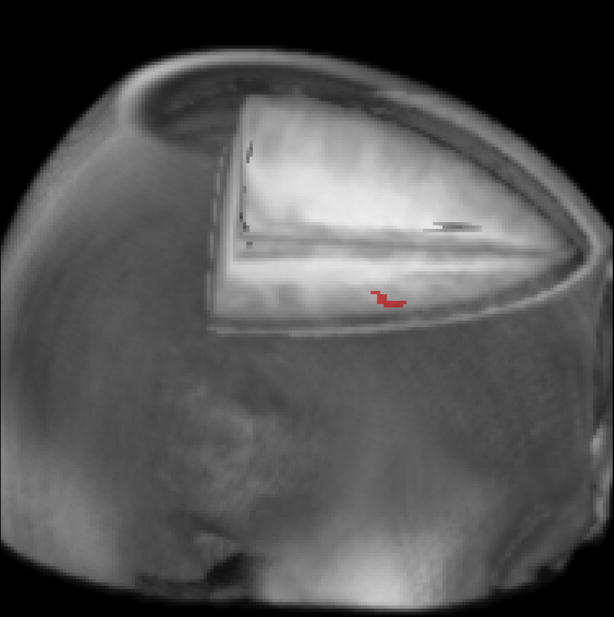
Figure 1.

fMRI task related activation for the ADHD and normal control groups at Time 1 and Time 2. All areas indicated were activated more during task blocks compared to control blocks.
Effects of group status
As noted above, both ADHD and normal controls demonstrated task-related activations. Statistical group comparisons were conducted comparing ADHD and normal control activation patterns. At Time 1, there were no differences in activation across groups. At Time 2, the ADHD group exhibited increased task-related activation in bilateral middle frontal gyrus (BA 9) and in anterior medial frontal lobe. Differences are summarized in Table 3.
Table 3.
Significant differences in activation on CPT-IP task (vs. rest) comparing ADHD and normal controls
| Brain region | Brodmann’s Area | Talaraich Coordinates | Contrast | t-value Max | Volume | ||
|---|---|---|---|---|---|---|---|
| X | Y | Z | |||||
| Time 1 | |||||||
| None | |||||||
| Time 2 | |||||||
| Right frontal lobe/MFG | 9 | 48 | 13 | 30 | ADHD>Controls | 3.19 | 28 |
| Left frontal lobe/MFG | 9 | −48 | 16 | 32 | ADHD>Controls | 3.09 | 10 |
| Frontal lobe/midline | 9 | 0 | 39 | 31 | ADHD>Controls | 3.06 | 12 |
Note: Statistical significance of p<.005 was used along with a contiguous cluster threshold of 5 voxels; Controls>ADHD was also tested but no significant areas of activation were noted.
Effects of time
From Time 1 to Time 2, both the ADHD and normal control group evidenced decreased activation in some brain regions. This parallels the findings above suggesting more areas of activation at Time 1 compared to Time 2 (see Table 4). Specifically, the children in the ADHD group showed decreased activation in right inferior frontal gyrus (BA 9), left inferior parietal lobe (BA 40), right postcentral gyrs (BA 40), and the right parahippocampal gyrus (BA 36) from Time 1 to Time 2. Among normal controls, there was a decrease in bilateral middle frontal gyrus (BA 9) and a decrease in anterior cingulate (BA 24) activation from Time 1 to Time 2. Neither group showed any areas of increased activation from Time 1 to Time 2.
Table 4.
Significant differences in activation on CPT-IP task (vs. rest) from Time 1 to Time 2 across ADHD and normal control groups
| Brain region | Brodmann’s Area | Talaraich Coordinates | Contrast | t-value Max | Volume | ||
|---|---|---|---|---|---|---|---|
| X | Y | Z | |||||
| ADHD | |||||||
| Left parietal lobe/Inferior parietal lobule | 40 | −39 | −36 | 46 | Time 1 > Time 2 | 3.65 | 64 |
| Right frontal lobe/IFG | 9 | 54 | 4 | 27 | Time 1 > Time 2 | 3.30 | 15 |
| Right temporal lobe/parahippocampal gyrus | 36 | 42 | −21 | −12 | Time 1 > Time 2 | 3.27 | 20 |
| Right parietal lobe/postcentral gyrus | 40 | 40 | −27 | 46 | Time 1 > Time 2 | 3.02 | 5 |
| 6Normal Controls | |||||||
| Right frontal lobe/MFG | 9 | 48 | 13 | 35 | Time 1 > Time 2 | 2.93 | 21 |
| Left frontal lobe/MFG | 9 | −42 | 16 | 32 | Time 1 > Time 2 | 2.92 | 49 |
| Anterior cingulated | 24 | −6 | 12 | 27 | Time 1 > Time 2 | 2.92 | 8 |
Note: Statistical significance of p<.005 was used along with a contiguous cluster threshold of 5 voxels; Time 2>Time 1 was also tested but no significant areas of activation were noted.
Group × Time interaction effects
In order to study the differential effects of time on brain activation across groups, group × time interactions were examined. Right middle frontal gyrus (BA 9; Talaraich coordinates: 48, 11, 35; max t-value = 3.07; volume = 8 voxels) was the only region to show an effect. See Figure 2. In summary, it appears that children with ADHD evidenced task-related activation in this region at Time 1 and Time 2. However, normal control only used this region during Time 1.
Figure 2.
Graphical depiction of group × time interaction effect. Children with ADHD increased activation in dorsal lateral prefrontal cortex (BA 9) from Time 1 to Time 2 whereas children without ADHD did not demonstrate increased activation over time in this area.
Discussion
In the absence of performance differences, children with ADHD and normal controls activated frontal-parietal regions while performing an attention task at initial testing. The areas of task-related activation exhibited by both children with ADHD and normal controls (see Figure 1) were consistent with posited higher order attentional systems involving fronto-parietal areas which may be mediated by the thalamus {Sarter, 2001 #9518; Coull, 1996 #8535}. One year later, the normal control group evidenced no task-related areas of activation while performing the same task while the children with ADHD showed less activation at the second testing but continued to evidence task-related activations in bilateral frontal areas and left parietal lobe at the time of the second testing. In particular, children with ADHD appeared to require continued use of the right middle frontal gyrus during administration of testing one year apart while normal controls did not activate this region at the time of the second testing.
No performance differences were observed across the ADHD and normal control groups in our study. Most other neuroimaging investigations of ADHD attentional functioning have reported between-group performance differences {Tamm, 2006 #8896;Booth, 2005 #8972;Shafritz, 2004 #8568;Vaidya, 2005 #8781;Konrad, 2006 #8904;Silk, 2005 #8784}. Given the low false positive rate in the present study, it is likely that our task was quite easy and a ceiling effect across groups affected our ability to detect group behavioral differences. Further support for task ease comes from the absence of any parametric manipulation findings. Again, it may have been a ceiling effect that prevented detection of any behavioral differences across parametric levels.
The lack of any performance differences mirrors the lack of any brain activation differences (at Time 1) across the groups. This finding also contrasts with previous investigations of attentional functioning in patients with ADHD which have noted abnormalities in activation patterns when comparing patients with ADHD to normal controls {Tamm, 2006 #8896;Booth, 2005 #8972; Bush, 1999 #8010; Shafritz, 2004 #8568;Vaidya, 2005 #8781;Konrad, 2006 #8904; Zang, 2005 #8920;Silk, 2005 #8784}. The lack of any between-groups activation differences, while unexpected, provides an opportune set of circumstances to study developmental changes in functioning. Given the two groups performed similarly and activated similar regions during performance, any differences in activation patterns during subsequent task administrations may be indicative of differential brain function with development.
The primary study finding regarding maturational differences was that the children in the ADHD group activated right middle frontal gyrus (BA 9) during attention at sessions one year apart while normal controls demonstrated activation in this region at time 1 but not at Time 2 one year later. The fact that this brain region shows a developmental functional effect is interesting because recent analyses of cortical thinning suggest that prefrontal regions of the brain are most susceptible to cortical thinning among adolescents and adults with ADHD {Shaw, 2006 #8900; Makris, 2007 #9529}, particularly in right sided regions {Makris, 2007 #9529}.
Disentangling whether the maintained reliance on right prefrontal brain regions is a result of development is difficult. Developmentally, it appears that the prefrontal cortices are the last to develop {Sowell, 2004 #9846} and the dorsal lateral prefrontal cortex may be the very last region to develop during adolescence {Gogtay, 2004 #9847;Reiss, 1996 #9848}. During development, there appears to be pruning of these gray matter regions that results in a mature brain {Giedd, 1996 #9849}. These structural changes appear to correlate with behavioral performance {Sowell, 2001 #9850} and likely reflect functional changes. Studies have begun to examine functional changes as a result of maturation. Regarding the prefrontal cortices, brain activation becomes more focal with age {Durston, 2006 #9851; Brown, 2005 #9852}. In the context of this study, the developmental explanation for the decrease in MFG function among the normal controls from Time 1 to Time 2 is somewhat confusing. A decrease in MFG activation from Time 1 to Time 2, but not the absence of any activation at Time 2 could be attributed to the advanced maturation and thereby more focused activation patterns of normal control brains compared to the brains of patients with ADHD. The lack of any activation at Time 2 is either suggestive of below threshold activation or possibly a pattern of downloading attentional function to alternative brain regions (e.g., cerebellum). Nonetheless, it is clear that children with ADHD maintained the use of these right prefrontal regions when performing an attentional task.
The study has several limitations including small sample size. Another significant study limitation is the differential male:female ratio across the two groups. There were many more females in the normal control group. All of our effects of group and interactions with group are thus confounded by gender reducing our confidence in attributing group differences to ADHD as they may be attributable to gender effects such as differential brain development across gender groups.
This study is the first longitudinal functional imaging study of children with ADHD. The small sample and significant gender confounds highlight the fact that the reported study results should be considered preliminary. That said, our findings are quite consistent with the existing neuroscience and the ADHD imaging literature. Both groups activated clear attentional networks {Cabeza, 2000 #9291}. There were clear trends towards decreased activation over time as would be expected based on the neuroscience literature {Durston, 2006 #9851}. Finally, the interaction effect in the right middle frontal gyrus is consistent with morphometric differences in cortical thickness reported in ADHD samples {Makris, 2007 #9529}. Clearly, future longitudinal designs examining the developmental course of functional activation are necessary to fully delineate the developmental trajectory of brain function in children with ADHD.
References
- 1.Froehlich 2007 #9186. [Google Scholar]
- 2.Faraone 2005 #8706. [Google Scholar]
- 3.Group. 1999 #8342. [Google Scholar]
- 4.Hervey 2004 #8545. [Google Scholar]
- 5.Willcutt 2005 #8677. [Google Scholar]
- 6.Bush 2005 #9398. [Google Scholar]
- 7.Dickstein 2006 #9843. [Google Scholar]
- 8.Ernst 1994 #1843. [Google Scholar]
- 9.Zametkin 1990 #6324. [Google Scholar]
- 10.Zametkin 1993 #6326. [Google Scholar]
- 11.Tamm 2006 #8896. [Google Scholar]
- 12.Adler 2005 #8916. [Google Scholar]
- 13.Vaidya 2005 #8781. [Google Scholar]
- 14.Konrad 2006 #8904. [Google Scholar]
- 15.Zang 2005 #8920. [Google Scholar]
- 16.Booth 2005 #8972. [Google Scholar]
- 17.Shafritz 2004 #8568. [Google Scholar]
- 18.Bush 1999 #8010. [Google Scholar]
- 19.Shaw 2006 #8900. [Google Scholar]
- 20.Castellanos 2002 #8529. [Google Scholar]
- 21.Durston 2003 #9438. [Google Scholar]
- 22.Geller 2001 #9844 WASH-U KSADS. [Google Scholar]
- 23.Delbello 2001 #9845. [Google Scholar]
- 24.Morris, Udry 1980 [Google Scholar]
- 25.Schmithorst 2001 #9853. [Google Scholar]
- 26.Macmillan 1991 #9856. [Google Scholar]
- 27.Friston 1995 #9855. [Google Scholar]
- 28.Friston 1995 #9854. [Google Scholar]
- 29.Sarter 2001 #9518. [Google Scholar]
- 30.Coull 1996 #8535. [Google Scholar]
- 31.Silk 2005 #8784. [Google Scholar]
- 32.Shaw 2006 #8900. [Google Scholar]
- 33.Makris 2007 #9529. [Google Scholar]
- 34.Sowell 2004 #9846. [Google Scholar]
- 35.Gogtay 2004 #9847. [Google Scholar]
- 36.Reiss 1996 #9848. [Google Scholar]
- 37.Giedd 1996 #9849. [Google Scholar]
- 38.Sowell 2001 #9850. [Google Scholar]
- 39.Durston 2006 #9851. [Google Scholar]
- 40.Brown 2005 #9852. [Google Scholar]
- 41.Cabeza 2000 #9291. [Google Scholar]