

Abstract
Correct charge state assignment is crucial to assigning an accurate mass to supramolecular complexes analyzed by electrospray mass spectrometry. Conventional charge state assignment techniques fall short of reliably and unambiguously predicting the correct charge state for many supramolecular complexes. We provide an explanation of the shortcomings of the conventional techniques and have developed a robust charge state assignment method that is applicable to all spectra.
The information available from mass analysis techniques, including native gel electrophoresis, size exclusion chromatography, ultra centrifugation and mass spectrometry (MS) increases dramatically with resolution. MS currently provides the highest mass resolution. The application of mass spectrometry to the analysis of large intact biomolecular complexes has become a reality through the introduction of electrospray ionization (ESI) and the improvement of large-ion transmission through mass analyzers [1–12]. This type of mass spectrometry, termed native electrospray mass spectrometry, maintains weak intermolecular protein-protein, protein-ligand and complex-adduct interactions allowing for mass interrogation of biomolecular complexes. To date, this analytical approach has provided details on the stoichiometry and 3D organization of complexes, subunit exchange kinetics, and thermal dissociation equilibrium values [13–16]. In the future, increasing instrument performance, as well as a more thorough understanding of the interaction between complexes and adducts, will greatly improve the utility of this technique. Here we describe a feature of some native electrospray spectra which invalidates the application of the conventional charge state assignment method to these spectra. Furthermore, we exploit this feature in a method we have developed for charge state assignment. This method is robust, applicable to all native electrospray spectra, and results in more accurate mass assignments.
A characteristic of ESI, for large analytes, is that the molecule or complex of interest takes up multiple protons. This results in the formation of multiple ions each differing in charge state (Z) and having a unique m/z value as shown in eq 1 where M is the mass of the analyte. Two tasks have to be completed in the deconvolution of raw ESI data. First, the charge states must be calculated for each ion, which can be accomplished by inputting the m/z values of two adjacent peaks into eq 2. The second task is to calculate a mass (M) for all ions by using eq 1.
| (1) |
| (2) |
Reported masses from ESI spectra are calculated by averaging the values of M for all ions.
Complications are common with charge state assignment of “native electrospray” spectra. This is in contrast to standard ESI where the assignment of charge states is unambiguous. In these spectra non covalent interactions are not maintained and individual molecular species are detected. These complications stem from a few qualities unique to native electrospray. First, the ion peaks are broad relative to conventional ESI making the peak centers more ambiguous [17]. A second complication arises due to the relatively uniform ion peak spacing over the envelope of charge states for native electrospray spectra and this effect will be discussed in the results section. Finally, native electrospray spectra typically have fewer ion peaks than spectra from conventional ESI. Therefore, eq 2 is applied fewer times resulting in greater uncertainty in the charge state assignment.
Robinson and coworkers have shown that an iterative approach can aid in the assignment of charge states for native electrospray spectra [5, 7, 18]. In their approach, they choose a range of candidate charge states and calculate masses for all associated ions at every charge state iteration. A standard deviation of the resulting calculated masses is produced at each iteration. The charge state series that produces the smallest standard deviation is deemed correct. This method has been successfully applied in other native electrospray studies. We refer to this charge state assignment strategy as the Conventional ESI method.
The Conventional ESI method is extremely useful, however its application to some spectra results in incorrect charge state assignments. We found that the source of this ambiguity was that the mass of a complex (M), for a subset of spectra (we term non-ideal), changes for ions of different charge states. Furthermore, M increases as the charge state decreases. Since M is not constant the application of eq 2 is no longer valid and therefore there is no analytical solution to the charge state assignment. Therefore, we were interested in developing a general data analysis technique applicable to all native electrospray spectra for charge state assignment.
Methods
Sample preparation
SsDps-L and LiDps were heterologously expressed and purified as described elsewhere [19, 20]. Prior to mass spectrometry analysis samples where desalted and transferred to an appropriate buffer by using P-30 Micro Bio-Spin® Columns (BIO-RAD). The samples were transferred into 10mM solutions of either ammonium acetate (AA) from Aldrich®, ReagentsPlus, 99.99% (catalog # 431311); ammonium bicarbonate (AB) from Sigma®, 99.0% (catalog #A6141); triethylammonium acetate (TEAA) buffer from Fluka (catalog #90357). All stock buffer solutions were made fresh and prepared with water from Fisher Scientific, Environmental Grade (catalog #W11). The pH of the buffers was adjusted by adding small volumes of dilute solutions of either ammonium hydroxide or acetic acid.
Instrumental configuration
The mass spectrometer used was a QTof Premier (Waters®). Higher than standard operating pressures were maintained within the instrument by closing the speedy valve which is positioned between the backing pump and the turbomolecular pump located in the source region. Typical pressures were 8 mbars, backing; 1.2 • 10−2 mbars, collision cell; 3.1 • 10−6 mbars, Tof. Typical voltages used where 2000 volts, capillary; 70 volts, sample cone; 50 volts, collision cell. Samples were introduced into the standard source of the mass spectrometer by direct injection using the Aquity™ liquid chromatography platform (Waters®) with a flow rate of 15μL per minute.
Results
The effect of the charge state on the spacing of adjacent ESI ion peaks
Native electrospray spectra typically have a few properties that can lead to ambiguous charge state assignments. These properties are relatively broad ion peaks, a relatively low number of ions and finally the relatively uniform ion peak spacing across a charge state envelop. The relationship of the absolute value of the charge on this last property, the spacing of the ion peaks, is outlined below.
In order to determine the relationship of the ion peaks spacing and the absolute value of the charge state for associated ions of ESI spectra, eq 3 – 6 can be utilized to describe the m/z difference between two adjacent ion peaks (Δ(m/z)Z↔Z+1). In these equations M is the mass of the analyte and Z is the charge state of the ion.
| (3) |
| (4) |
| (5) |
| (6) |
When this relationship is plotted the inverse relationship between Δ(m/z)Z↔Z+1 and Z becomes obvious (Figure 1a).
Figure 1.
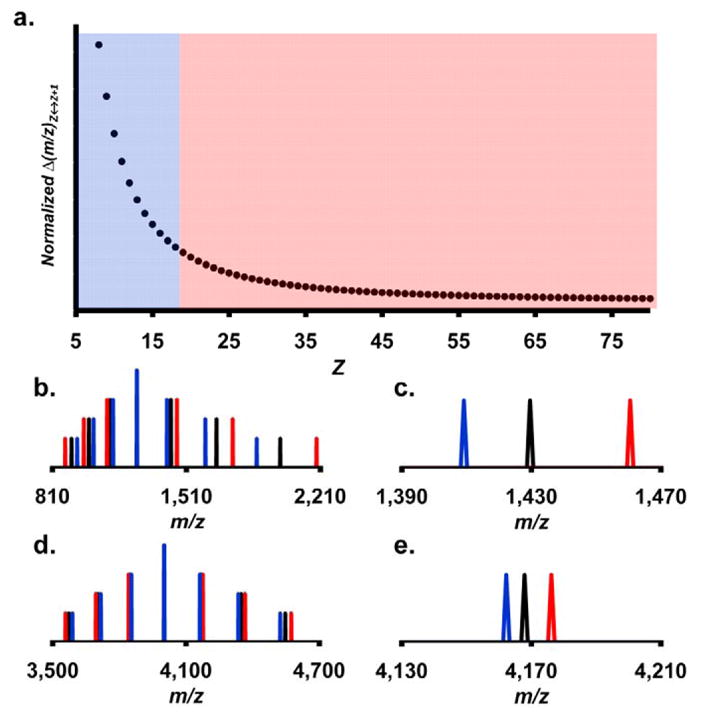
(a) A plot of Normalized Δ(m/z)Z↔Z+1 vs. Z. Typical charge state ranges for standard ESI spectra are shown as the blue region while the region for typical charge states for native electrospray spectra are shown in red. (b–e) Generated spectra of a 10kDa analyte (standard ESI spectra) (b,c) and of a 100kDa analyte (native electrospray spectra) (d,e). Plots (c) and (e) are zoomed in views of the peaks directly to the right of the base peaks from plots (b) and (d) respectively. The x-axis in plots (c) and (e) are presented at the same scale (range = 80m/z). The correct charge states were used to calculate ion peak positions shown in black (b–e). The blue ion peaks were generated by using the correct charge state values plus one while the red ion peaks were calculated using the correct charge state values minus one (b–e).
The relationship between predicted maximum charge state and the mass of the complex produced from the lab of de la Mora is given in eq 7
| (7) |
and was used to determine typical Z values for conventional ESI spectra (mass = 10,000 to 50,000 Daltons) and native electrospray spectra (mass = 50,000 to 1M Daltons) [21, 22]. By indicating typical charge state ranges for both conventional and native electrospray spectra in the plot of Normalized Δ(m/z)Z↔Z+1 vs. Z it becomes clear that the spacing of the ion peaks is less variant for ion peaks from native electrospray spectra. The y-axis in this plot was normalized by setting M, in eq 6, equal to unity.
To show the outcome of the charge state’s effect on the ion peak’s spacing, two sets of generated mass spectra were calculated and are presented in Figure 1b–e. In Figure 1b–c the spectrum generated was calculated for an analyte that has a theoretical mass of 10kDa (representative of standard ESI spectra) in contrast to Figure 1d–e where the spectrum represents an analyte with a mass of 100kDa (representative of native electrospray spectra). This figure illustrates that the spacing between ions across the charge state envelope in the case of the 10kDa spectrum varies much more than the spacing for the 100kDa example. Two additional spectra were produced for both the 10 and 100kDa examples by using charge state values of minus one and plus one of the correct charge state value. In the 100kDa example the incorrect spectra align much better with the correct spectrum when compared to the 10kDa example. The inverse relationship between the absolute value of the charge state and the ion peak spacing makes charge state assignment more difficult at high charge state values.
The mass dependence on charge state
Native electrospray analysis of the SsDps-L protein cage (DNA binding protein from starved cells-like protein) provided a model system for investigating accurate charge state determination. SsDps-L is derived from the hyperthermophilic archaeon Sulfolobus solfataricus and is a spherical complex that is assembled from 12 identical protein subunits with an outer diameter of approximately 10nm (Figure 2a) [20, 23].
Figure 2.
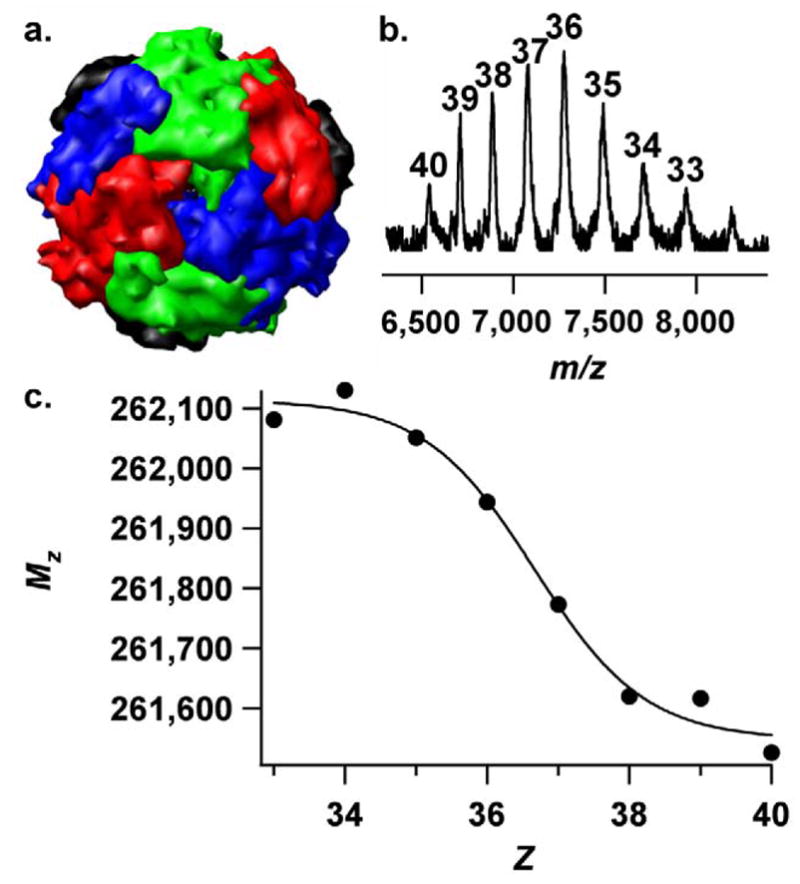
(a) The structure of the intact SsDps-L complex, from the hyperthermophilic archaeon Sulfolobus solfataricus, oriented about the 3-fold axis [23]. (b) The prototypical native electrospray spectrum of the SsDps-L complex with the correct charge states (Z) labeled above the ion peaks. (c) A plot of Mz vs. Z for ions from the prototypical SsDps-L spectrum.
The non-covalent mass spectrum of this intact complex (Figure 2b) is typical in that it has a narrow charge state envelope (from 33 to 40) and relatively broad ion peaks compared to conventional ESI spectra. Using the known mass of SsDps-L, a charge state was assigned to each ion peak. A mass (Mz) was then calculated for each ion peak by using eq 1. A plot of Mz vs. Z (Figure 2c) shows that the mass varies with the charge in a sigmoidal fashion and approaches both an upper and a lower limit at the charge state extremes.
This sigmoidal behavior is also apparent for other complexes that we have analyzed in our lab, in addition to spectra that have been reported in the literature [22, 24, 25]. Figure 3 shows examples of sigmoid trends of data obtained from spectra from three complexes; another Dps protein from Listeria innocua (LiDps), the ά6-glutamate synthase complex from Azosprillum brasilense and the Urease complex from Helicobacter pylori [19, 22, 24–26].
Figure 3.
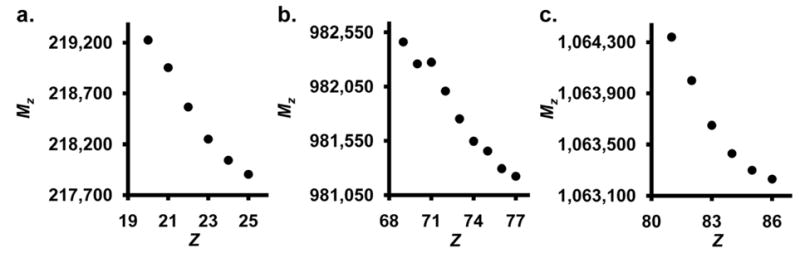
Plots of Mz vs. Z for three complexes. Data from an LiDps spectrum (a), data from a previously reported spectrum of the ά6-glutamate synthase complex [24] (b) and an Urease complex which has been previously reported [22, 25] (c).
To aid in the comparison of the sigmoid trends shown in Figure 3 and others, normalized mass and centered charge values were calculated with the following procedure to allow for one plot containing sigmoid trends from a multitude of spectra. Data shown in Figure 3 along with data from other spectra, in the form of Mz vs. Z was fit with the sigmoid equation shown in eq 7.
| (7) |
The MC term is a variational parameter that describes the mass of a complex stripped of all but the most tightly bound adducts and is an asymptotic limit of the sigmoid function. The mass of the complex with a maximal amount of adduct loading (complex mass plus the mass of the adducts) is described by the variational parameter MCMA. CS is the point of maximal slope for the change in mass as the charge state changes. Finally, R is a floating term that dictates the overall rate of mass change as the charge varies. The normalized mass term (Normalized Mz) was then calculated with eq 8.
| (8) |
The Centered Z term was calculated by subtracting the charge state of the ion peak from the variational parameter CS. Figure 4 shows the similarity in the sigmoid nature across complexes and analysis conditions.
Figure 4.
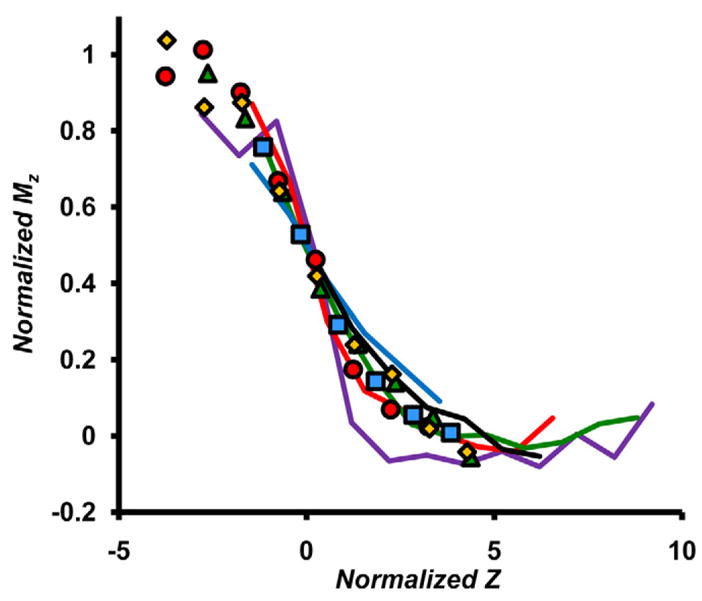
Plots of Normalized Mz vs. Centered Z for a variety of complexes analyzed under various conditions. Data from the prototypical SsDps-L spectrum (Figure 2c) is plotted as red circles, data from a spectrum of the Urease complex which has been previously reported [22, 25] is plotted as blue squares and data from another previously reported spectrum of the ά6-glutamate synthase complex [24] is plotted as yellow diamonds. Data from a native electrospray spectrum of IgG is shown as green triangles. Data from LiDps and SsDps-L spectra are plotted as solid lines. LiDps in ammonium acetate pH 6.8 (blue), ammonium acetate pH 8.7 (purple), ammonium bicarbonate pH 8.2 (green), triethylammonium acetate pH 6.8 (red), SsDps-L in ammonium acetate pH 8.2 (black).
Development and evaluation of four charge state assignment methods
Charge state assignment of native electrospray spectra can be ambiguous for the reasons discussed above, here we evaluated four charge state determination strategies on three complexes, SsDps-L, LiDps and the ά6-glutamate synthase complex. Both Dps complexes were analyzed in a variety of buffer conditions to access the method’s robustness as the solution conditions are varied. One of the methods, the Conventional ESI method, was produced elsewhere as described above [5, 7, 18]. Three of the methods were developed in this work and are described below. We found the most reliable assignment results from a method that uses the ion’s peak width to aid in the determination of the correct charge state. This technique corrects for the variation of mass for ion peaks of different charge states.
R2 method
We observed that the charge-state-corrected ion peak width increases as the charge decreases in non-ideal native electrospray spectra. This peak width can be calculated by dividing the ion peak width (fwhm) by the m/z at the maximum peak intensity and is referred to as the corrected peak width (CPWz) [18, 27]. As suggested in previous works, a plot of MZ vs. CPWZ should produce a linear relationship[18, 27]. If the charge state is selected incorrectly, either too high or too low, the linear correlation between Mz and CPWz breaks down (Figure 5). The point at which the R2 value is at a maximum corresponds to the correct charge state.
Figure 5.

Plots of Mz vs. CPWZ for data from the prototypical SsDps-L spectrum (Figure 2b) where Mz has been calculated with various charge states. The charge state assignment, R2 value, and sign of the slope of a linear fit to the plots are shown above each plot.
Absolute value of the slope method
It has been previously established that a linear relationship of percent mass increase (%MIz)
| (9) |
and CPWz holds true for ions from different complexes [18, 27]. Plots of %MIz vs. CPWz, or similar plots, shown in these publications, are comprised of data points produced from ion peaks from various spectra [18, 27]. These spectra were of different complexes or the same complex measured under different conditions. This suggests that the peak width of an ion is linearly related to the percent mass increase for ions from different spectra. We wanted to determine if this linear relationship was obtained for ion peaks produced from the same spectrum with different charge states. If this linear relationship is general we could exploit the slopes of these plots as another method to determine the correct charge state. The plots of %MIZvs. CPWz for SsDps-L, LiDps and the ά6-glutamate synthase complex measured under different buffer conditions do exhibit a linear behavior suggesting that this linear relationship is general (Figure 6a–c) [24]. Plots of %MIZvs. CPWz for SsDps-L and LiDps measured under various buffer conditions also produced linear trends (data not shown).
Figure 6.
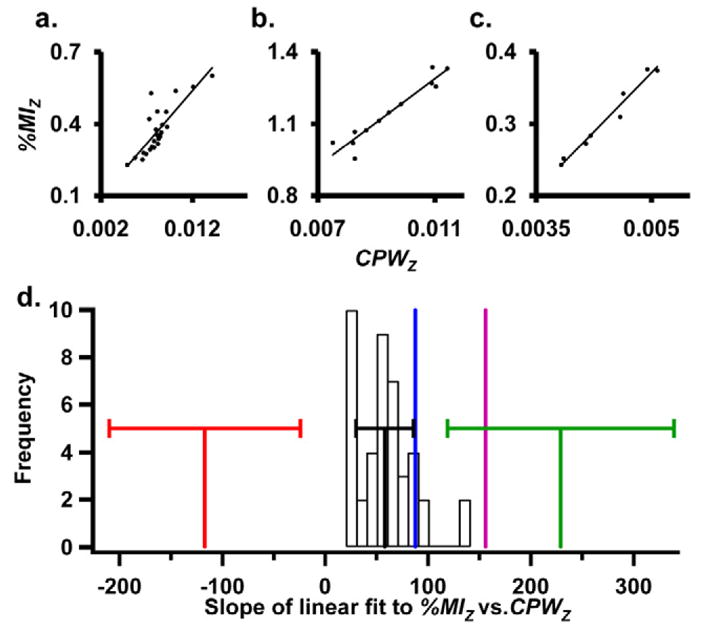
(a–c) Plots of %MIz vs. CPWz for three complexes. Data from SsDps spectra in ammonium acetate pH 8.2 (triplicate injections) (a) and data for LiDps in triethylammonium acetate pH 6.8 (triplicate injections) (b) and data from the ά6-glutamate synthase complex spectrum (single analysis) (c) [24]. All the linear fits from data listed in Table 1 are shown in histogram form (d) with the average slope ± one standard deviation as a black line. The average slope produced from picking the charge both −1 and +1 from the correct charge state are shown as a red line (−1) and a green line (+1) with error bars for both of ± one standard deviation. The slope previously reported, which was produced from a plot of %MIz vs. CPWz, for different complexes is shown as a purple line (d) [18]. The slope produced from the ά6-glutamate synthase complex is shown as a blue line (d).
In addition to the observation that the plots in Figure 6a–c have a linear relationship, the absolute value of their slopes is also similar. This prompted us to look at the similarity of slopes for a larger data set including data from SsDps-L and LiDps analyzed under various buffer conditions. A histogram containing the slope values from all the Dps data sets shows this similarity in Figure 6d. The slope values range from 20 to 140 with an average value of 58 ± 28 (± one standard deviation). The slope produced from the ά6-glutamate synthase spectrum (87.8) is similar to the average slope produced for the two Dps complexes (Figure 6d). However, the slope value of a linear fit of a previously reported data set containing data points obtained from different spectra of various complexes or the same complexes ran under different conditions was higher than (156) the average Dps value [18]. The difference in the slope value could be due to different experimental conditions used.
Also included in the histogram, shown in Figure 6d, are the slope values produced from masses calculated from the SsDps-L and LiDps data sets, with Z values that are both −1 and +1 of the correct value. When the incorrect charge states were used slope values of −117 ± 93 and 229 ± 110 respectively were produced (Figure 6d). The slope value from the correct data set (58) is significantly different from the values from the two data sets produced with the incorrect charge states (−117 and 229). This suggests that the comparison of experimental absolute values of the slope to a predetermined average value for similar spectra can be a predictive tool for charge state assignment.
A potential complication with this method is that the mass of the complex must be known. However, if the theoretical mass of the complex is unknown %MIZ values can be approximated by setting %MIZ equal to the y-intercept of the linear fit to a plot of Mz vs. CPWz.
First positive slope method
The value of the slope of a linear fit to the plot of %MIZ vs. CPWz (or MZvs. CPWz) can also be utilized as another method to determine the correct charge state. This method tracks when the value of the slope of the linear fit switches from a negative value to a positive value as the initial guess of the charge state is iterated with increasing Z values. The first slope with a positive value corresponds to the correct charge state (Figure 5).
We tested two complexes (SsDps-L and LiDps) under a variety of conditions and found that the first positive slope method was the most reliable in predicting the correct charge state (100%), followed by the conventional ESI method (87%), then the absolute value of the slope method (80%), and the R2method was the least reliable (35 %). Table 1 summarizes the four methods in their ability to pick the correct charge state for these complex/conditions. Furthermore, the first positive slope method correctly predicted the charge state for the spectrum of the ά6-glutamate synthase complex (produced outside our lab) while the conventional method picked the incorrect charge state [24]. Based on the samples analyzed in this work, we suggest that the first positive slope method should be used for charge state determination.
Table 1.
| Charge State Assignment Methods, Number of correct assignments | |||||
|---|---|---|---|---|---|
| Complex (Buffer) [Collision energy] | R2 | Absolute value of the slope | Conventional ESI | First positive slope | Replicates |
| SsDps-L (TEAA pH 6.8) [CE 50] | 1 | 2 | 0 | 3 | 3 |
| SsDps-L (AA pH 6.8) [CE 50] | 1 | 3 | 3 | 3 | 3 |
| SsDps-L (AA pH 8.2) [CE 50] | 0 | 3 | 3 | 3 | 3 |
| SsDps-L (AB pH 6.8i 7.4f) [CE 50]* | 1 | 0 | 3 | 3 | 3 |
| SsDps-L (AB pH 8.3) [CE 50]** | 3 | 0 | 3 | 3 | 3 |
| SsDps-L (TEAA pH 8.3i 7.7f) [CE 50]* | 0 | 1 | 0 | 2 | 2 |
| LiDps (AA pH6.8) [CE 50] | 1 | 3 | 3 | 3 | 3 |
| LiDps (AB pH8.2) [CE 50] | 0 | 3 | 3 | 3 | 3 |
| LiDps (AA pH8.7) [CE 50] | 0 | 3 | 3 | 3 | 3 |
| LiDps (TEAA pH8.3) [CE 50] | 1 | 3 | 2 | 3 | 3 |
| LiDps (TEAA pH6.8) [CE 50] | 2 | 2 | 2 | 2 | 2 |
| LiDps (TEAA pH 6.8) [CE 30] | 0 | 3 | 3 | 3 | 3 |
| LiDps (TEAA pH 6.8) [CE 50] | 1 | 3 | 3 | 3 | 3 |
| LiDps (TEAA pH 6.8) [CE 70] | 2 | 3 | 3 | 3 | 3 |
| LiDps (TEAA pH 6.8) [CE 90] | 2 | 2 | 2 | 2 | 2 |
| LiDps (TEAA pH 6.8) [CE 110] | 1 | 2 | 2 | 2 | 2 |
| LiDps (TEAA pH 6.8) [CE 130] | 0 | 1 | 2 | 2 | 2 |
| All Data | Correct for 35% | Correct for 80% | Correct for 87% | Correct for 100% | 46 |
“i” indicates the pH prior to injection of the first replicate and “f” indicates the pH after the final injection.
Data not used to produce the histogram in Figure 6d.
The consequence of a mis-assigned charge state is a dramatic decrease in the accuracy of the mass measurement. For example considering all the spectra summarized in Table 1, the average ppm mass error of the spectra in which the conventional ESI method mis-assigned the charge states is 33,920 compared to the ppm error of 6,052 for these same samples where the charge states were selected correctly with the first positive slope method. This corresponds to an absolute mass error of 8,611 Daltons for the conventional ESI method and 1,479 Daltons for the first positive slope method. These mass errors were calculated by comparing the experimental mass values to calculated mass values, which where calculated from the protein sequences and subunit compositions of the complexes.
Suggested charge state assignment workflow
A macro that automatically performs the first positive slope method’s steps is available for download at http://www.cbin.montana.edu/ncms.html.
Determine all peak tops (m/z units) and peak widths (fwhm) for all associated ions
Calculate the CPWzby dividing the peak width of each ion by its peak top value.
-
Plot the CPWz vs. Ion Number (the Ion Number is a number starting at 1 to n assigned to each ion. The ion with the lowest charge state (right most ion in the spectrum) should be set to 1. Does the graph show sigmoidal character? Are there larger CPWz values on the left side of the plot?
Yes, the spectrum is non-ideal. Use the First positive slope method, step 6.
No, the spectrum is ideal. Use the Conventional ESI method, step 7.
-
Pick a reasonable range of charge states,
A guess charge state can be calculated with eq 3 by imputing a guess mass for the complex [21, 22].
Determine the correct charge state by iterating across the entire range of guess charge states.
Apply the following charge state assignment methods for all guess charge states. For non ideal spectra weight your charge state assignment decision on step 6, and for ideal weight your decision based on 7. Both steps 8 and 9 can aid in the understanding of charge state assignment.
First positive slope of a linear fit to a graph of %MIz vs. CPWz (or Mz vs. CPWz). In some cases a positive slope results from noise in the data and not a true positive linear correlation between %MIz vs. CPWz. When this is the case, the correct charge state is usually the determined charge state + 1. The R2 of this linear fit can be used to indicate a true correlation and therefore the true first positive slope.
Absolute value of the slope of a linear fit to %MIZvs. CPWz
Highest R2 for a linear fit of the plot %MIz vs. CPWz
Discussion
Two properties of native electrospray spectra must be mentioned in the discussion of assigning charge states to these spectra. First, it has been previously established that complexes comprise a continuum in which some complexes can be detected almost completely devoid of buffer adducts at one extreme and there are other complexes that are only detected when heavily loaded with adducts. At the onset of analysis of an uncharacterized complex the investigator does not have the luxury of knowing the abundance of adducts present. The second property, which has been presented in this work, is that some native electrospray spectra contain ions that result in masses that decrease as the charge state increases (termed here as non-ideal). The conventional charge state assignment methodology will correctly predict the charge state in two types of native electrospray spectra. The first type are ideal spectra in which the mass is invariant for ions of all charge states. The second type of spectra in which the conventional methodologies will correctly predict the charge state are non-ideal spectra that contain a low abundance of adducts present. As the abundance of adducts increases, for non-ideal spectra, there comes a point where the conventional charge state assignment methodologies incorrectly predict the charge state. These are the spectra which the charge state assignment methodologies presented in this work are most helpful and must be applied. Finally, for complexes that have not been previously characterized both properties of the complex, the amount of adducts present and the type of spectrum, ideal or non-ideal, are unknowns and therefore these uncharacterized complexes should have their charge states assigned with the methodologies presented in this work.
The relationship between the absolute value of the ion peak’s charge state and the spacing of adjacent ion peaks should be included in the discussion of reasons why charge state assignment can be ambiguous for native electrosprayed complexes. In eq 6 it is evident that the spacing becomes relatively uniform as the charge state increases as this may be the most problematic aspect of charge state assignment for large supramolecular complexes.
The normalized sigmoidal plots shown in Figure 3 provide insight into how the abundance of adducts change for ion peaks with different charge states. These plots obtained from different spectra follow a relatively similar sigmoid trend. This suggests that the change in the proportion of adducts present as the charge state is changed is similar for data from different complexes/conditions. Also, the overall range of mass difference between associated ions can vary widely between data sets, but the change in the mass occurs over a similar range of charge states. This is an interesting result and may provide clues for a more thorough understanding of the relationship of the adduct abundance and the ion peak’s charge state.
Conclusions
We have described how the mass and therefore the adduct composition of large macromolecular complexes can change across associated ions of different charge states. Due to variation of mass for associated ions we have shown that the application of the conventional charge state assignment method to all native electrospray spectra will result in incorrect charge state assignments. Therefore, we have developed a deconvolution strategy that is applicable to all native electrospray spectra and that accurately assigns the charge state of ions and therefore produces a more accurate mass assignment. A macro which will automatically perform the suggested native electrospray deconvolution steps is available for download at http://www.cbin.montana.edu/ncms.html.
Acknowledgments
We are extremely grateful to the Albert Heck lab, specifically Charlotte Uetrecht for sending us raw spectra produced in their lab. This was a vital component in this work as it helped us test our method on data produced elsewhere. This research was supported in part by grants from the National Science Foundation (CBET-0709358), Office of Naval Research (N00014-03-1-0692), and Human Frontiers of Science Program (RGP61/2007).
Footnotes
Publisher's Disclaimer: This is a PDF file of an unedited manuscript that has been accepted for publication. As a service to our customers we are providing this early version of the manuscript. The manuscript will undergo copyediting, typesetting, and review of the resulting proof before it is published in its final citable form. Please note that during the production process errors may be discovered which could affect the content, and all legal disclaimers that apply to the journal pertain.
References
- 1.Ganem B, Li YT, Henion JD. Observation of Noncovalent Enzyme Substrate and Enzyme Product Complexes by Ion-Spray Mass-Spectrometry. Journal of the American Chemical Society. 1991;113(20):7818–7819. [Google Scholar]
- 2.Fitzgerald MC, et al. Probing the oligomeric structure of an enzyme by electrospray ionization time-of-flight mass spectrometry. Proceedings of the National Academy of Sciences of the United States of America. 1996;93(14):6851–6856. doi: 10.1073/pnas.93.14.6851. [DOI] [PMC free article] [PubMed] [Google Scholar]
- 3.Loo JA. Studying noncovalent protein complexes by electrospray ionization mass spectrometry. Mass Spectrometry Reviews. 1997;16(1):1–23. doi: 10.1002/(SICI)1098-2787(1997)16:1<1::AID-MAS1>3.0.CO;2-L. [DOI] [PubMed] [Google Scholar]
- 4.Rostom AA, et al. Detection and selective dissociation of intact ribosomes in a mass spectrometer. Proceedings of the National Academy of Sciences of the United States of America. 2000;97(10):5185–5190. doi: 10.1073/pnas.97.10.5185. [DOI] [PMC free article] [PubMed] [Google Scholar]
- 5.Tito MA, et al. Electrospray time-of-flight mass spectrometry of the intact MS2 virus capsid. Journal of the American Chemical Society. 2000;122(14):3550–3551. [Google Scholar]
- 6.Van Berkel WJH, et al. Detection of intact megaDalton protein assemblies of vanillyl-alcohol oxidase by mass spectrometry. Protein Science. 2000;9(3):435–439. doi: 10.1110/ps.9.3.435. [DOI] [PMC free article] [PubMed] [Google Scholar]
- 7.Sanglier S, et al. Comparative ESI-MS study of similar to 2.2 MDa native hemocyanins from deep-sea and shore crabs: From protein oligomeric state to biotope. Journal of the American Society for Mass Spectrometry. 2003;14(5):419–429. doi: 10.1016/s1044-0305(03)00131-4. [DOI] [PubMed] [Google Scholar]
- 8.Green BN, et al. Electrospray ionization mass spectrometric determination of the molecular mass of the similar to 200-kDa globin dodecamer subassemblies in hexagonal bilayer hemoglobins. Journal of Biological Chemistry. 1999;274(40):28206–28212. doi: 10.1074/jbc.274.40.28206. [DOI] [PubMed] [Google Scholar]
- 9.Tang XJ, et al. Investigation of Protein-Protein Noncovalent Interactions in Soybean Agglutinin by Electrospray-Ionization Time-of-Flight Mass-Spectrometry. Rapid Communications in Mass Spectrometry. 1994;8(9):750–754. doi: 10.1002/rcm.1290080918. [DOI] [PubMed] [Google Scholar]
- 10.Chernushevich IV, Thomson BA. Collisional cooling of large ions in electrospray mass spectrometry. Analytical Chemistry. 2004;76(6):1754–1760. doi: 10.1021/ac035406j. [DOI] [PubMed] [Google Scholar]
- 11.Smith RD, et al. Preservation of Noncovalent Associations in Electrospray Ionization Mass-Spectrometry - Multiply Charged Polypeptide and Protein Dimers. Organic Mass Spectrometry. 1992;27(7):811–821. [Google Scholar]
- 12.Siuzdak G, et al. Mass spectrometry and viral analysis. Chemistry & Biology. 1996;3(1):45–48. doi: 10.1016/s1074-5521(96)90083-6. [DOI] [PubMed] [Google Scholar]
- 13.Sobott F, et al. Subunit exchange of multimeric protein complexes - Real-time monitoring of subunit exchange between small heat shock proteins by using electrospray mass spectrometry. Journal of Biological Chemistry. 2002;277(41):38921–38929. doi: 10.1074/jbc.M206060200. [DOI] [PubMed] [Google Scholar]
- 14.Benesch JLP, Sobott F, Robinson CV. Thermal dissociation of multimeric protein complexes by using nanoelectrospray mass spectrometry. Analytical Chemistry. 2003;75(10):2208–2214. doi: 10.1021/ac034132x. [DOI] [PubMed] [Google Scholar]
- 15.Ilag LL, et al. Heptameric (L12)(6)/L10 rather than canonical pentameric complexes are found by tandem MS of intact ribosomes from thermophilic bacteria. Proceedings of the National Academy of Sciences of the United States of America. 2005;102(23):8192–8197. doi: 10.1073/pnas.0502193102. [DOI] [PMC free article] [PubMed] [Google Scholar]
- 16.Taverner T, et al. Subunit architecture of intact protein complexes from mass spectrometry and homology modeling. Accounts of Chemical Research. 2008;41(5):617–627. doi: 10.1021/ar700218q. [DOI] [PubMed] [Google Scholar]
- 17.Sobott F, Robinson CV. Characterising electrosprayed biomolecules using tandem-MS - the noncovalent GroEL chaperonin assembly. International Journal of Mass Spectrometry. 2004;236(1–3):25–32. [Google Scholar]
- 18.Mckay AR, et al. Mass measurements of increased accuracy resolve heterogeneous populations of intact ribosomes. Journal of the American Chemical Society. 2006;128(35):11433–11442. doi: 10.1021/ja061468q. [DOI] [PubMed] [Google Scholar]
- 19.Allen M, et al. Protein cage constrained synthesis of ferrimagnetic iron oxide nanoparticles. Advanced Materials. 2002;14(21):1562-+. [Google Scholar]
- 20.Wiedenheft B, et al. An archaeal antioxidant: Characterization of a Dps-like protein from Sulfolobus solfataricus. Proceedings of the National Academy of Sciences of the United States of America. 2005;102(30):10551–10556. doi: 10.1073/pnas.0501497102. [DOI] [PMC free article] [PubMed] [Google Scholar]
- 21.Fernandez de la Mora J. Electrospray ionization of large multiply charged species proceeds via Dole’s charged residue mechanism. Analytica Chimica Acta. 2000;406(1):93–104. [Google Scholar]
- 22.Heck AJR, van den Heuvel RHH. Investigation of intact protein complexes by mass spectrometry. Mass Spectrometry Reviews. 2004;23(5):368–389. doi: 10.1002/mas.10081. [DOI] [PubMed] [Google Scholar]
- 23.Gauss GH, et al. Structure of the DPS-Like Protein from Sulfolobus solfataricus Reveals a Bacterioferritin-Like Dimetal Binding Site within a DPS-Like Dodecameric Assembly. 2006:10815–10827. doi: 10.1021/bi060782u. [DOI] [PMC free article] [PubMed] [Google Scholar]
- 24.van Breukelen B, et al. Resolving stoichiometries and oligomeric states of glutamate synthase protein complexes with curve fitting and simulation of electrospray mass spectra. Rapid Communications in Mass Spectrometry. 2006;20(16):2490–2496. doi: 10.1002/rcm.2620. [DOI] [PubMed] [Google Scholar]
- 25.Pinkse MWH, et al. Macromolecular asserably of Helicobacter pylori urease investigated by mass spectrometry. Journal of Mass Spectrometry. 2003;38(3):315–320. doi: 10.1002/jms.443. [DOI] [PubMed] [Google Scholar]
- 26.Ilari A, et al. The dodecameric ferritin from Listeria innocua contains a novel intersubunit iron-binding site. Nature Structural Biology. 2000;7(1):38–43. doi: 10.1038/71236. [DOI] [PubMed] [Google Scholar]
- 27.Benesch JLP, et al. Protein complexes in the gas phase: Technology for structural genomics and proteomics. Chemical Reviews. 2007;107(8):3544–3567. doi: 10.1021/cr068289b. [DOI] [PubMed] [Google Scholar]