

Abstract
Young lesbian, gay, and bisexual (young LGB) individuals report higher rates of suicide ideation and attempts from their late teens through early twenties. Their high rate of Internet use suggests that online social networks offer a novel opportunity to reach them. This study explores online social networks as a venue for prevention research targeting young LGB. An automated data collection program was used to map the social connections between LGB self-identified individuals between 16 and 24 years old participating in an online social network. We then completed a descriptive analysis of the structural characteristics known to affect diffusion within such networks. Finally, we conducted Monte Carlo simulations of peer-driven diffusion of a hypothetical preventive intervention within the observed network under varying starting conditions. We mapped a network of 100,014 young LGB. The mean age was 20.4 years. The mean nodal degree was 137.5, representing an exponential degree distribution ranging from 1 through 4,309. Monte Carlo simulations revealed that a peer-driven preventive intervention ultimately reached final sample sizes of up to 18,409 individuals. The network’s structure is consistent with other social networks in terms of the underlying degree distribution. Such networks are typically formed dynamically through a process of preferential attachment. This implies that some individuals could be more important to target to facilitate the diffusion of interventions. However, in terms of determining the success of an intervention targeting this population, our simulation results suggest that varying the number of peers that can be recruited is more important than increasing the number of randomly-selected starting individuals. This has implications for intervention design. Given the potential to access this previously isolated population, this novel approach represents a promising new frontier in suicide prevention and other research areas.
Keywords: adolescent suicide, adult suicide, human sexuality, network analysis, Internet, algorithms, lesbian, gay, bisexual
Background
Compared to their peers, lesbian, gay, and bisexual adolescents and young adults (Young LGB) report higher rates of suicide ideation and attempts (Silenzio, Pena, Duberstein, Cerel, & Knox, 2007), and have been difficult to reach through conventional means (Participants in the Scientific Workshop to Measure the Health Concerns of Lesbian, 2002). In part due to the evolving role new technologies play in normative social development (Maczewski, 2002), Young LGB report high rates of Internet use (Hillier, Kurdas, & Horsley, 2001). As early as 2001, 85% of LGB adolescents reported that the Internet had been an important resource for them to connect with LGB peers (Hillier et al., 2001). Emerging Internet technologies such as online social networks play a poorly understood role in normative socialization for young LGB individuals, who have traditionally been geographically and socially isolated (Lesbian Gay Bisexual (LGB) Youth Sexual Orientation Measurement Work Group, 2003). Online networks have the dual potential to serve as platforms for prevention interventions as well as to serve as conduits for toxic influences such as suicide contagion. In order to enhance the former and minimize the latter, it is critical to understand the fundamental characteristics of these social networks (M. E. J. Newman, Barabási, & Watts, 2006).
This dual potential within social networks represents two examples of diffusion processes among social actors. Understanding the topology and features of a network are fundamental to designing programs or interventions to either take advantage of the network’s capacity to expand the reach of such interventions, or to block the transmission of toxic influences. While this has important implications beyond the area of suicide, this approach affords provides novel opportunities to overcome conventional barriers to conduct prevention research in an area of great public health significance.
Respondent-Driven Sampling (RDS), and the related Respondent-Driven Intervention, was initially developed by Heckathorn and colleagues to make statistically-valid inferences using convenience samples in populations that are difficult or impossible to reach through conventional representative sampling designs (Heckathorn, 2002). These populations are often “hidden” due to social stigma or legal issues, such as intravenous drug users, or whose members may not be easily discovered other than through social connections that can serve as a gateway to individuals who may not have come forward otherwise (Heckathorn, 1997). The latter might include, for example, sexual minority youth who do not readily self-identify as LGB and may not respond to recruitment or intervention efforts targeting these youth as “LGB”. RDS approaches use “snowball sampling” (i.e.: having individuals recruit or refer people they know, who in turn help recruit or refer people they know) in combination with a weighted mathematical model to derive statistically-valid inferences about the target population (Heckathorn, 2002). In order to accomplish this, RDS requires that the size of participants’ individual personal networks must be known, participants must be uniquely identifiable within the overall social network, and the precise connections between participants must be precisely known (Heckathorn, 2002). Although initially developed specifically for work with hidden populations, populations linked through Internet technologies and other emerging media for human social interaction meet these criteria, and thus are well-suited to study using RDS methods (Heckathorn, 2007).
In this paper, we focus upon the use of an online social network to reach targeted members of a difficult-to-reach population at high risk for suicide. We describe a method to map a large-scale online network of young LGB. We then use this network as a model to study the effects of design parameters on the simulated diffusion of a prevention intervention within this population. Although our focus is in the area of suicide prevention research, these methods and approaches have potential application in other areas of public health research.
Methods
This study was approved by the Research Subjects Review Board (RSRB) of the University of Rochester Medical Center as exempt human subjects research (RSRB Protocol #15000). Due to the use of only publicly available information, access to which is under direct control of potential subjects, and the minimal risks posed by this research, informed consent was waived by the RSRB. In the first stage of the study, only observational data regarding information subjects opted to make publicly available was collected and subsequently de-identified. In the second stage, computational methods alone were used to simulate peer-driven diffusion processes using the de-identified, empirically observed network as the model system.
Stage 1: Network Mapping
Selection
We collected publicly available information for LGB non-LGB self-identified late adolescents within an online social network site (www.MySpace.com). MySpace is a popular site for adolescents and young adults, particularly sexual minority adolescents (Koblin, 2006), with over 189,000,000 registered users worldwide. Those individuals between the ages of 16 to 24 years with a functioning user account and who provided information regarding their gender and sexual orientation were considered for inclusion in our analysis. Because we ultimately plan to deploy the approaches reported here to study suicide prevention in this population, we have limited study subjects to the subset of late adolescents and young adults (16 to 24 years old). Rates of suicide ideation and attempt are higher in this age group than in earlier adolescence (Centers for Disease Control and Prevention, 2005), and they are more easily accessed, recruited, and enrolled into research protocols requiring informed consent.
Data collection
Data was collected from February 17 through 27, 2008 using mySpaceCrawler, version 6 (Portman & Silenzio, 2008). This Perl programming language application uses a network-based, breadth-first searching (Anonymous, 2008) approach developed by the lead author to map the social connections between targeted individuals within an online network. Breadth-first searching allows complete exploration of a network by starting with one member and then exploring all neighboring connected members. Then, for each of these connected network members, their unexplored neighbors are explored and mapped. This process continues until no further unexplored can be found.
The sampling process began with an initial subject, or ‘seed node’ selected at random. To select the seed node, we randomly generated potential MySpace user identification numbers, then checked to see if the account belonged to a publically-accessible user who met criteria for study inclusion. The first individual found through this process was used as the seed node for the network. Starting with this seed node, the application then searched the publicly accessible, online data from all connected individuals identified as ‘friends’ of the seed node within MySpace. Those connected individuals who met inclusion criteria and were not previously identified were added to the network database. Stored in Pajek (version 1.17) (de Nooy, Mrvar, & Batagelj, 2005) format, the database includes the age, gender, sexual orientation, geographic location (by US region or foreign country), and information regarding connections to other nodes within the dataset. The mySpaceCrawler application was designed to continue branching outward until either the breadth of the contact network had been searched (M. E. J. Newman et al., 2006), or until terminated. We decided in advance to terminate the network data collection after reaching 100,000 nodes as the overall population was found to be indeterminably large at that point in time, based on the rate of new nodes being added to the dataset. To confirm that MySpace accounts with high nodal degrees did represent actual persons (rather than a corporate account, musical band, etc.), nodes with over 1000 connections were directly reviewed before the data was de-identified. All nodes with k>1000 were confirmed to represent actual individuals who met eligibility criteria.
Network analysis
Data analysis was completed using the network package (version 1.3) (Butts, Handcock, & Hunter, 2008) available for R (R Development Core Team, 2007). Visualization of network data was completed using Pajek version 1.17 (de Nooy et al., 2005). Data analysis addressed two areas. The first focused on the broad structural and other features of the overall network. The relevant network-level features include diameter, average connectivity, average nodal degree, and tests for network structural features such as the nodal degree distribution. Diameter is a measure of the maximum number of individuals that must be passed through on a path connecting any two members of the network. This is directly analogous to the popular idea that there are “six degrees of separation” between any two people on Earth. Connectivity reflects how cohesive a network is, in the sense of how many different routes exist through social ties within the network that connect any two members of it. Greater connectivity implies that there are many different, redundant paths between two members, and thus that they may be able to find one of these pathways between them more easily. Density is another indicator of overall network cohesiveness, and is the observed total number of all social ties between network members as a proportion of all possible ties (i.e. every member connected to every other member). Nodal degree refers to the number of neighboring members of the network to whom the individual is directly connected. Nodal degree distribution is the range in the number of direct connections of each member of the network. For example, there may be 100 members of the network connected to only one other member of the network, 90 members connected to two other members, 80 members connect to three others, and so on. The second area of analysis focused on analysis of individual characteristics of members of the network for which complete data was available. This includes descriptive statistics using de-identified data for age, gender and sexual orientation.
Stage 2: Simulated Resondent-Driven Diffusion
Simulation
After all potential identifiers were removed, the empirically-observed network generated in Stage 1 was then used to simulate the behavior of a respondent-driven (RDS) (Heckathorn, 2007) diffusion process within the population under a variety of starting conditions. These conditions were chosen to mirror those of a potential suicide prevention intervention, such as a health promotion message diffusing through a peer network-driven process. A total of 100 Monte Carlo simulations were completed using a program developed by the authors and written using R (R Development Core Team, 2007). Recruitment chains were started by randomly choosing five, ten, or fifteen individuals at random as the initial “seed nodes” (“i”) (i=5, i=10, or i=15) from among the 100,014 members of the online network discovered in Stage 1. This range was selected in order to encompass the ideal number of recruitment chains needed for RDS. Previous research suggests that nine recruitment chains are usually necessary in order to assure development of statistical representative sample. (Heckathorn, 2007).
Each participant is used to recruit additional participants through a coupon voucher system that tracks referral patterns. Our simulation limited the number of recruitment coupons (“c”) given to each participant to either five (c=5) or ten (c=10) participants for the next round. Previous experience in the “real world” with RDS suggests that participants must be able to refer a minimum of three additional individuals in order to prevent recruitment chains from terminating before reaching the lengths necessary for the final sample to be statistically representative once the targeted recruitment number is reached. (Heckathorn, 2007). Given the increased ease for referrals and potentially lower per-participant costs using Internet-based venues (Heckathorn, 2007), we chose to use both an analogous number (c=5) and a significantly higher number (c=10) than the minimum in order to study how far recruitment could potentially reach within this empirically observed network.
RDS is an incentive based recruitment process (Heckathorn, 2002). Typically, participants receive incentives for their own participation, as well as additional incentives based on the number of other participants they directly recruit. Participants in respondent-driven designs can only recruit from among their direct social contacts, and only contacts who have not participated as a subject earlier in the simulation. On average, past experience suggests that one of every three referrals will generate an additional participant (Heckathorn, 2007). The probability that referred individuals will participate can be enhanced by increasing the incentives. To examine the influence of variably effective recruitment incentives, the probability that referred individuals will participate was assumed to be either p=0.33, 0.5, 0.75, or 1.0. While it is unlikely that 100% effective incentives would be available, we nonetheless include this in the study design in order to look at the range from the probability typically observed in the past (one third, or p=0.33) through unity in order to understand the maximum sample size ultimately possible under as other conditions are varied. While a minimum of p=0.33 is reasonable as a starting point, given the high rates of Internet use in this population, and the nature of the intervention to help prevent suicide in peers to whom they have a direct social connection and who may be at risk, individual members may be more motivated than the average online social network user to reach out to potentially vulnerable peers.
Whereas respondent-driven approaches may terminate recruitment once a targeted number of participants has been reached, we wished to test the maximum number of participants that could be reach under varying conditions. The recruitment process was allowed to continue in our simulations until no new participants were recruited. The scenarios are each repeated 100 times with Monte Carlo simulation using different randomly selected starting participants.
Results
Nodal-Level Analysis
Starting from the seed node, we mapped interrelationships between a total of 100,014 LGB self-identified individuals. After reaching the predetermined point of 100,000 individuals, the rate of new additions (data not shown) was constant, implying that the final population size could not be determined and data collection was terminated as planned. The size of the network at 1 degree was 94. At two degrees, the network consisted of 16,033 individuals (94 1st and 15,939 2nd degree nodes). After partial exploration of the first 2071 individuals (13.0% of the 2nd degree nodes), the total network size was equal to 100,014 individuals. Because the set of all 2nd degree nodes has not been fully explored, the 83,980 3rd degree nodes mapped before terminating data collection are only a fraction of the total network size at 3 degrees.
Table 1 shows the distribution of subjects by gender and sexual orientation. Table 2 shows the age distribution of the sample. The mean age was 20.10 years. A little over half of the sample identified as gay or lesbian, and a little over one third identified as bisexual. The remaining 10.7% self-identified as unsure of their sexual orientation.
Table 1. Subjects by Gender and Sexual Orientation.
| Number | Percent | |
|---|---|---|
| TOTAL | 100,014 | 100.0 |
| Gender | ||
| *Male | 72,293 | 72.3 |
| *Female | 27,721 | 27.7 |
| Sexual Orientation | ||
| *Gay/Lesbian | 53,400 | 53.4 |
| *Bisexual | 35,909 | 35.9 |
| *Unsure | 10,705 | 10.7 |
Table 2. Subjects by Age.
| Age (Years) | Number | Percent |
|---|---|---|
| 16 | 5170 | 5.2 |
| 17 | 8498 | 8.5 |
| 18 | 13497 | 13.5 |
| 19 | 15556 | 15.6 |
| 20 | 14492 | 14.5 |
| 21 | 13059 | 13.1 |
| 22 | 11857 | 11.9 |
| 23 | 9944 | 9.9 |
| 24 | 7941 | 7.9 |
Figure 1 shows the mean and 95% confidence interval of subjects by gender (left panel) and sexual orientation (right panel), which do not differ significantly. As participant age increases, small but progressive differences are noted in sexual orientation identification. Compared to their 16 year old peers, progressively fewer individuals identify as “bisexual” or “unsure” by the age of 24 years within our sample (data not shown).
Figure 1. Gender and Sexual Orientation of first 100,014 subjects.
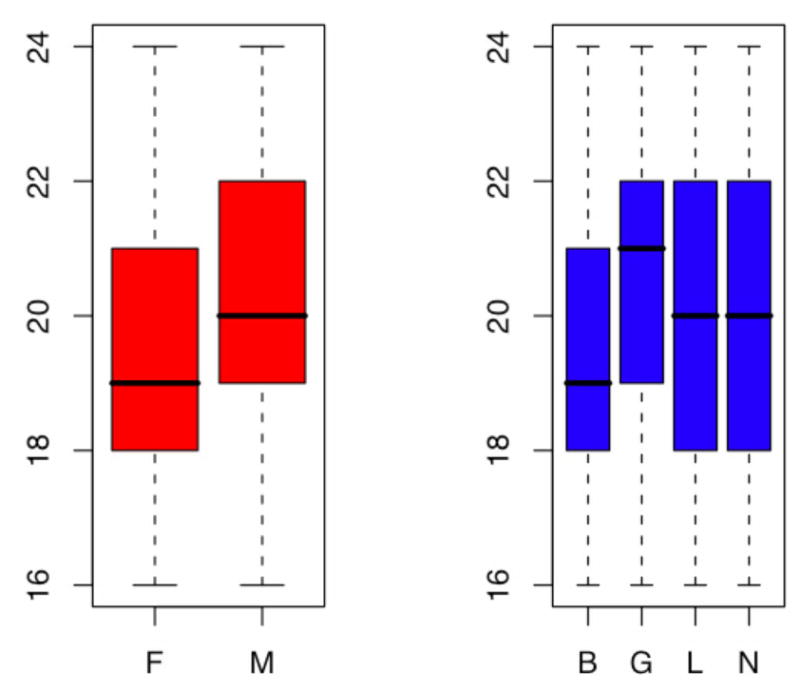
The first panel at left shows the mean age, 95% confidence interval, and range of ages by gender (F = female, M = male). The second panel shows the age distribution data by sexual orientation (B = bisexual, G = Gay, L = Lesbian, N = Unsure).
Network-Level Analysis
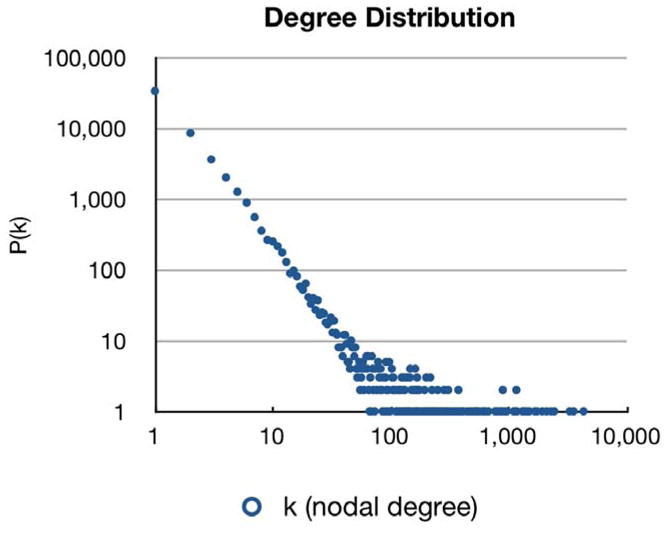
The network diameter was equal to 6. This is consistent with the termination of our search algorithm during exploration of 2nd degree neighbors of the seed node. As a subset of the 3rd degree neighbors are the most distant explored, no two individuals mapped by this procedure would be separated by more than four intervening people. Network density = was calculated to be 0.0000058. The degree distribution within our sample ranged from 1 to 4,319, with a mean nodal degree (k) of 137.5. This density and degree distribution is consistent with a sparse network that follows power law distribution of nodal degrees (Caldarelli, 2007; M. E. J. Newman et al., 2006) with alpha = 2.012699. A sparse network is one where very few of the total possible number of social ties between all members of the network exist, and is typically found to be progressively smaller as larger and larger social networks are considered (de Nooy et al., 2005).
Scale free networks typically exhibit linearity when plotted logarithmically, as shown in Figure 2. The tail of the plot reveals the noise attendant in plots using real world data, which represents finite sets that may have practical limits to the maximum number of social ties that one person can have. Methods exist to account for this statistical noise, including procedures such as binning (Caldarelli, 2007). This point is somewhat controversial, and some authors question whether some networks demonstrate similar distribution patterns other than power laws (Holme, Edling, & Liljeros, 2004).
Figure 2. Log-Log Plot of Nodal Degree Distribution.
Simulation Results
Table 3 and Figures 2 and 3 demonstrates the average final sample size reached through the simulated, subject-driven diffusion process within the network under each set of starting conditions. These figures reflect the average number of individuals reached after 100 times Monte Carlo simulation. The final sample size generated in this way ranged between 91 and 18,409 individuals. As the number of potential peer recruitments increased from five to ten, we observed a dramatic increase in the final sample size reached. This was noted particularly when recruitment incentives were less likely to be successful (i.e. with lower values of p). Increasing the number of randomly-selected starting individuals from five to ten to fifteen did increase the final sample size reached, but by a smaller proportion as the number of starting individuals or the effectiveness of recruitment incentives were increased.
Table 3. Average number of nodes reached with 100 times MC simulation (95% Confidence Interval).
| Recruitment Limit | Probability of Recruitment (p) | Starting with 5 people [i=5] (95% CI) | Starting with 10 people [i=10] (95% CI) | Starting with 15 people [i=15] (95% CI) |
|---|---|---|---|---|
| Recruitment limit of 5 people (c=5) | p=0.33 | 91 (76, 106) | 185 (161, 209) | 258 (231, 285) |
| p=0.5 | 1275 (1155, 1395) | 2089 (1979, 2199) | 2504 (2405,2603) | |
| p=0.75 | 6087 (5981, 6193) | 6753 (6703, 6803) | 6948 (6918, 6978) | |
| p=1.0 | 9596 (9561, 9631) | 9839 (9816, 9682) | 9910 (9892,9928) | |
| Recruitment limit of 10 people (c=10) | p=0.33 | 2141 (1920, 2362) | 3226 (3074,3378) | 3707 (3568, 3846) |
| p=0.5 | 7633 (7402, 7864) | 8332 (8277, 8387) | 8701 (8656, 8746) | |
| p=0.75 | 13390 (13359, 13421) | 13504 (13482,13526) | 13662 (13641, 13683) | |
| p=1.0 | 18202 (18172, 18232) | 18347 (18318, 18376) | 18409 (18382, 18436) |
Key:
i = initial number of randomly-selected starting individuals from within the observed network
c = Number of recruitment coupons given (i.e. the maximum number of peers that a participant can subsequently recruit for the simulation)
p = Probability that a peer will participate when asked (i.e. the recruitment incentive’s effectiveness)
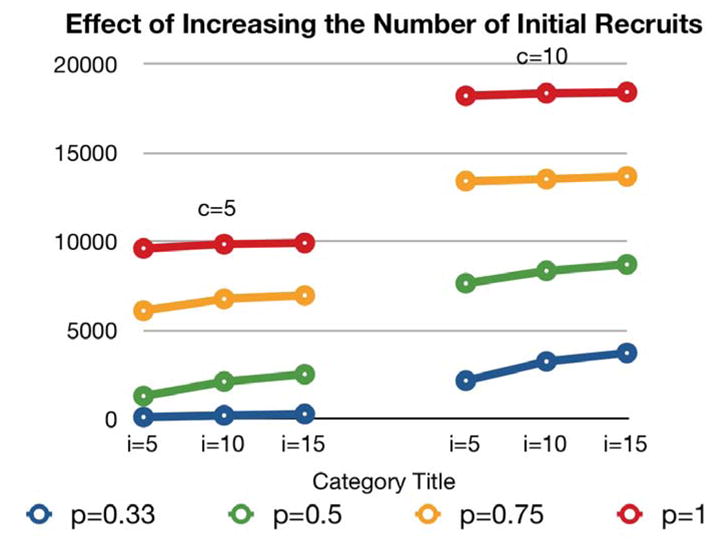
Figure 3. Average number of nodes reached with 100 times MC simulation when increasing the number of initial recruits.
Key:
i = initial number of randomly-selected starting individuals from within the observed network
c = Number of recruitment coupons given (i.e. the maximum number of peers that a participant can subsequently recruit for the simulation)
p = Probability that a peer will participate when asked (i.e. the recruitment incentive’s effectiveness)
Table 3 shows that, when the recruitment incentive is less effective, starting with more individuals is helpful to increase the ultimate sample size reached. With recruitment effectiveness set at p=0.33 and subsequent recruitment limited to up to five coupons, the sample reached increased from 96 to 185 to 258 when starting with five versus ten versus fifteen initial participants. But increasing the number of recruitment coupons to ten produces a larger final sample size under the same conditions, increasing 2,253% from 91 to 2,141. However, as the number of starting individuals is increased and the number of recruitment coupons remains set at ten, the final sample is only increased by 73% from 2,141 to 3,707 as the number of starting individuals increases from five to fifteen.
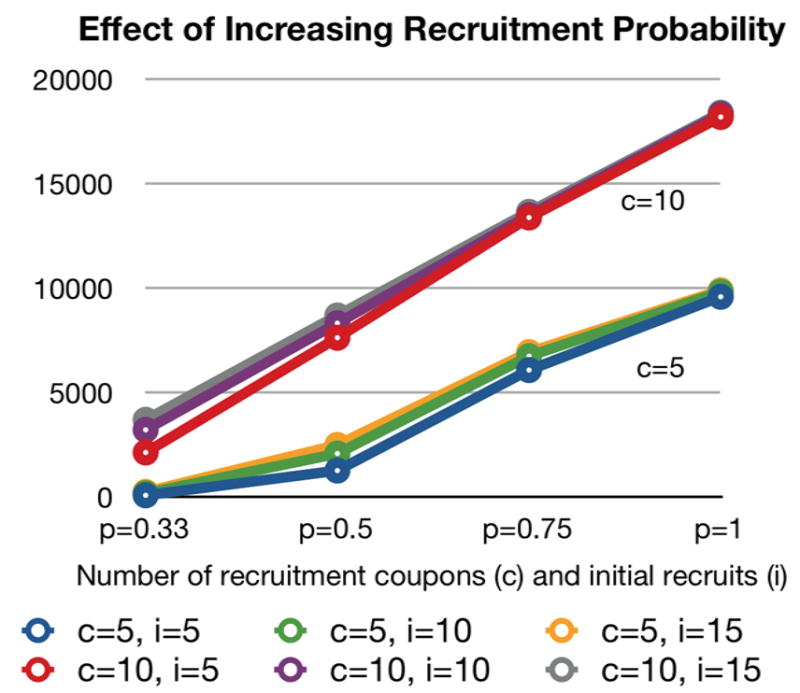
These results are represented graphically in Figures 3 and 4. Figure 3 shows the final sample size reached using either five (left panel) or ten (right panel) recruitment coupons, with either five, ten, or fifteen initial recruitment chains. Each line represents the results as the probability of recruitment using each coupon is increased from 0.33 to 1. Figure 4 visually demonstrates that the differences in the upward trends in final sample size recruited as the probability of recruitment success increases appear more clearly affected by the number of recruitment coupons than the number of initial individuals selected to start recruitment chains.
Figure 4. Average number of nodes reached with 100 times MC simulation as probability of recruitment is increased.
Key:
i = initial number of randomly-selected starting individuals from within the observed network
c = Number of recruitment coupons given (i.e. the maximum number of peers that a participant can subsequently recruit for the simulation)
p = Probability that a peer will participate when asked (i.e. the recruitment incentive’s effectiveness)
Discussion
To our knowledge, this is the first social network analysis of a group with both high rates of Internet use and at high-risk for suicide ideation and attempts. It is also among the first to demonstrate the potential of online social networks as a prevention platform. This may be particularly relevant to future research and interventions targeting LGB youth, who have been historically quite difficult to reach.
Representing a much larger scale network with higher numbers of personal social connection than typically described, our global structural analysis is consistent with a power-law distribution of nodal degrees. This pattern is consistent with a scale-free network structure (M. E. J. Newman et al., 2006). Scale-free networks are frequently found in interactive networks, and have a range of interesting properties that affect diffusion processes within them. Perhaps the most relevant is the dual potential to foster the diffusion of both preventive and risk-enhancing influences for suicide in this population more rapidly than other types of network structures (Caldarelli, 2007).
The results of our Monte Carlo simulations are interesting and demand further exploration using other empirically-observed social networks. The most counterintuitive of our findings is that, under most of the conditions studied, the final number of people reached is not substantially increased by starting with double or even triple the number of randomly-selected individuals. Since each starting individual represents a new chain of potential recruitment, the effect of including more chains would be expected to be additive. However, given that the peer-recruitment process is limited within a bounded sample of 100,014 individuals, and the interconnectedness within this sample is high, these recruitment chains will likely begin to merge quickly and limit the sample size that can be reached. This could also be true in certain sub-types of scale-free networks, namely, those with higher degrees of modularity (M. E. Newman, 2006). Respondent-driven methods would be expected to exhaust local modules, which are clusters of connections between individuals, before spreading to other modules in subsequent recruitment rounds. Thus, both the global and local structural features of networks can affect diffusion processes within it.
Our approach has several important limitations. The selection of an arbitrarily chosen individual from which to start the process of constructing the network dataset is a reasonable first step. If the overall network size is expected to be relatively small, the breadth-first searching approach will achieve a complete map of the network. If the network is large enough, however, breadth-first searching may capture a less-representative slice of the overall network if data collection is terminated too soon. Although biases that may result are diminished as the sample size increases, we cannot confidently predict the overall size of the network. We sampled more than 100,000 individuals in order to help reduce any bias, further expansion of the network dataset will be needed to more definitively assess the accuracy of our findings.
A related limitation is in the choice to compile the empiric network database using a single seed node. Respondent-Driven Sampling can be used to statistically characterize a network using a subset of members within it starting from a convenience sample of initial seed nodes, but is thought to require using at least nine such seed nodes and completing at least five waves of subsequent recruitment from each seed in order to be able to overcome any initial sampling bias (Heckathorn, 2007). Since we do not expect that we have fully explored the network of Young LGB within MySpace, using a single seed need implies that our findings may not accurately reflect the characteristics of the overall population.
In addition, this sample is limited to those individuals who participate in an online social network, and who self-identify their sexual orientation. Sexual orientation is best measured using a multiaxial items that address sexual orientation identity, sexual behavior, and sexual attraction (Saewyc, Bauer, Skay, Bearinger, Resnick, Reis et al., 2004). Although not strictly analysis to survey methods, it could be argued that these adolescents and young adults represent a better-supported, more affluent segment of the population. However, online participation among this population appears to be becoming nearly universal, at least in the developed world (Hillier et al., 2001). The second limitation related to participation in online networks is that we have been very conservative in requiring LGB self-identification for inclusion, thus potentially significantly underestimating the network size and characteristics. Although RDS methods have been successfully used to address this very concern in the area of HIV/AIDS (Magnani, Sabin, Saidel, & Heckathorn, 2005). There is no a priori reason to suspect that LGB-identified individuals will differ significantly in terms of the numbers of sexual minority youth who are not LGB-identified (and therefore could potentially recruit them based on that knowledge), although this could not be simulated in this exploratory work. Future research will be needed to address whether systematic biases exist in this population so that they may be directly accounted for.
The Internet and social media technologies represent an exciting set of future possibilities for not only suicide prevention research, but also in addressing a wide array of public health concerns. However, it is important to note the ethical concerns raised by such methods (Moreno, Fost, & Christakis, 2008). Although the data available online has been made public by the individuals studied, questions remain about whether these individuals fully appreciate the ease with which others can obtain such details, and thus have given fully-informed consent in making their information accessible to others (Allen, Burk, & Ess, 2008). Moreover, the field is constantly in flux as technologies advance and new technologies are created. While this study used passive methods only to gather data, and the hypothetical models posed minimal risks to subjects, most authors would agree that active application of peer-driven methods to directly recruit study participants in real world settings or that would pose more than minimal risks would require parental or subject consent (Moreno et al., 2008). There is a fleetingly small distance between our approach and activities such as the “warrantless surveillance” reputedly practiced by Federal agencies such as the NSA (Anonymous, 2009). The ethical principles pertaining to the protection of human subjects do not change, but it is hoped that the scientific community would learn from this example and consider the ethical questions posed by these emerging technologies with more care.
This preliminary exploration demonstrates the feasibility of our approach, and its potential use in suicide prevention research with much larger samples of LGB adolescents and young adults than previously possible. Although LGB youth suicide prevention is the focus of our work, our methods can be analogously applied to other populations and prevention research questions. This would be especially true of other populations that have pose challenges to reach or “hidden” using conventional approaches (such as drug users or sex workers), or who commonly use Internet or related social media (including other adolescents and young adults) to communicate with individuals and resources outside of their immediate surroundings. Determination of network characteristics has important implications for the development of epidemiological models of both suicide-related contagion (Dodds & Watts, 2005; Watts, Muhamad, Medina, & Dodds, 2005) and of innovation diffusion such as social marketing or other interventions targeting these youth (Mahajan & Peterson, 1985; Rogers, 2003). We are only beginning to explore the importance of local network neighborhood structural factors on dissemination processes. Using empirically observed networks such as ours to model and study these structural effects may hold great importance across a wide range of public health concerns far beyond the narrow confines of suicide prevention research.
Acknowledgments
We would like to thank Douglas S. Portman for the development and programming of the data collection software. The University of Rochester provided institutional support and funding for this project. Additional funding was provided through NIMH Grant Number T32-MH020061 (Yeates Conwell, PI).
Footnotes
Publisher's Disclaimer: This is a PDF file of an unedited manuscript that has been accepted for publication. As a service to our customers we are providing this early version of the manuscript. The manuscript will undergo copyediting, typesetting, and review of the resulting proof before it is published in its final citable form. Please note that during the production process errors may be discovered which could affect the content, and all legal disclaimers that apply to the journal pertain.
Contributor Information
Vincent Michael Bernard Silenzio, University of Rochester, Rochester, NY UNITED STATES, v.m.silenzio@rochester.edu; vmbs@me.com.
Paul R Duberstein, University of Rochester
Xin Tu, University of Rochester
Wan Tang, University of Rochester
Naiji Lu, University of Rochester
Christopher M Homan, Rochester Institute of Technology
Works Cited
- Allen GN, Burk DL, Ess C. Ethical approaches to robotic data gathering in academic research. Jounal of Internet Research Ethics. 2008;1(1):9–36. [Google Scholar]
- Anonymous. Breadth-first search. Wikipedia: 2008. http://en.wikipedia.org/wiki/Breadth-first_search. [Google Scholar]
- Anonymous. NSA warrantless surveillance controversy. Wikipedia: 2009. http://en.wikipedia.org/wiki/NSA_warrantless_surveillance_controversy. [Google Scholar]
- Butts CT, Handcock MS, Hunter DR. network: Classes for Relational Data. Irvine, CA: 2008. http://erzuli.ss.uci.edu/R.stuff. [Google Scholar]
- Caldarelli G. Scale-free networks: complex webs in nature and technology. Oxford: Oxford University Press; 2007. [Google Scholar]
- Centers for Disease Control and Prevention. WISQARS™ (Web-based Injury Statistics Query and Reporting System) 2005 http://www.cdc.gov/ncipc/wisqars/
- de Nooy W, Mrvar A, Batagelj V. Exploratory social network analysis with Pajek. New York: Cambridge University Press; 2005. [Google Scholar]
- Dodds PS, Watts DJ. A generalized model of social and biological contagion. J Theor Biol. 2005;232(4):587–604. doi: 10.1016/j.jtbi.2004.09.006. [DOI] [PubMed] [Google Scholar]
- Heckathorn D. Respondent-Driven Sampling: A New Approach to the Study of Hidden Populations. Social Problems. 1997;44(2):174–199. [Google Scholar]
- Heckathorn D. Respondent-Driven Sampling II: Deriving Valid Population Estimates from Chain-Referral Samples of Hidden Populations. Social Problems. 2002;49(1):11–34. [Google Scholar]
- Heckathorn D. Extensions of Respondent-Driven Sampling: Analyzing Continuous Variables and Controlling for Differential Recruitment. Sociological Methodology. 2007 In Press. [Google Scholar]
- Hillier L, Kurdas C, Horsley P. ‘It’s just easier’: the Internet as a safety-Net for same sex attracted young people. Melbourne: Australian Research Centre in Sex, Health, and Society, Latrobe University; 2001. [Google Scholar]
- Holme P, Edling CR, Liljeros F. Structure and time evolution of an Internet dating community. Social Networks. 2004;26(2):155–174. [Google Scholar]
- Koblin J. MySpace: the new gay space for teens and 20-somethings. Columbia News Service; 2006. [Google Scholar]
- Lesbian Gay Bisexual (LGB) Youth Sexual Orientation Measurement Work Group. Measuring Sexual Orientation of Young People in Health Research. San Francisco: Gay and Lesbian Medical Association; 2003. [Google Scholar]
- Maczewski M. Exploring Identities Through the Internet: Youth Experiences Online. Child and Youth Care Forum. 2002;31(2):111 – 129. [Google Scholar]
- Magnani R, Sabin K, Saidel T, Heckathorn D. Review of sampling hard-to-reach and hidden populations for HIV surveillance. AIDS. 2005;19 Suppl 2:S67–72. doi: 10.1097/01.aids.0000172879.20628.e1. [DOI] [PubMed] [Google Scholar]
- Mahajan V, Peterson RA. Models for innovation diffusion. Beverly Hills: Sage Publications; 1985. [Google Scholar]
- Moreno MA, Fost NC, Christakis DA. Research Ethics in the MySpace Era. Pediatrics. 2008;121(1):157–161. doi: 10.1542/peds.2007-3015. [DOI] [PubMed] [Google Scholar]
- Newman ME. Modularity and community structure in networks. Proc Natl Acad Sci U S A. 2006;103(23):8577–8582. doi: 10.1073/pnas.0601602103. [DOI] [PMC free article] [PubMed] [Google Scholar]
- Newman MEJ, Barabási A-L, Watts DJ. The structure and dynamics of networks. Princeton, N.J.: Princeton University Press; 2006. [Google Scholar]
- Participants in the Scientific Workshop to Measure the Health Concerns of Lesbian, G., Bisexual (LGB) Youth. Report from the Scientific Workshop to Measure the Health Concerns of Lesbian, Gay, Bisexual (LGB) Youth. San Francisco: Gay and Lesbian Medical Association; 2002. [Google Scholar]
- Portman DS, Silenzio VMB. mySpaceCrawler. Rochester, NY: University of Rochester; 2008. [Google Scholar]
- R Development Core Team. R: A Language and Environment for Statistical Computing. Vienna, Austria: R Foundation for Statistical Computing; 2007. http://www.R-project.org) [Google Scholar]
- Rogers EM. Diffusion of innovations. New York: Free Press; 2003. [Google Scholar]
- Saewyc EM, Bauer GR, Skay CL, Bearinger LH, Resnick MD, Reis E, et al. Measuring sexual orientation in adolescent health surveys: evaluation of eight school-based surveys. J Adolesc Health. 2004;35(4):345, e341–315. doi: 10.1016/j.jadohealth.2004.06.002. [DOI] [PubMed] [Google Scholar]
- Silenzio VM, Pena JB, Duberstein PR, Cerel J, Knox KL. Sexual orientation and risk factors for suicidal ideation and suicide attempts among adolescents and young adults. Am J Public Health. 2007;97(11):2017–2019. doi: 10.2105/AJPH.2006.095943. [DOI] [PMC free article] [PubMed] [Google Scholar]
- Watts DJ, Muhamad R, Medina DC, Dodds PS. Multiscale, resurgent epidemics in a hierarchical metapopulation model. Proc Natl Acad Sci U S A. 2005;102(32):11157–11162. doi: 10.1073/pnas.0501226102. [DOI] [PMC free article] [PubMed] [Google Scholar]