

Abstract
Much of modern biology relies on the strategic manipulation of molecules for creating ordered arrays prior to high throughput molecular analysis. Normally, DNA arrays involve deposition on surfaces, or confinement in nanochannels; however, we show that microfluidic devices can present stretched molecules within a controlled flow in ways complementing surface modalities, or extreme confinement conditions. Here we utilize pressure-driven oscillatory shear flows generated in microchannels as a new way of stretching DNA molecules for imaging “arrays” of individual DNA molecules. Fluid shear effects both stretch DNA molecules and cause them to migrate away from the walls becoming focused in the centerline of a channel. We show experimental findings confirming simulations using Brownian dynamics accounting for hydrodynamic interactions between molecules and channel-flow boundary conditions. Our findings characterize DNA elongation and migration phenomena as a function of molecular size, shear rate, oscillatory frequency with comparisons to computer simulation studies.
Introduction
Microfluidic devices are playing a major role in biophysical and genomic applications because they produce defined fluids flows that manipulate large DNA molecules1–3. Accordingly, associated molecular simulations and theories foster the rational development of new microfluidic devices for genomic applications because they elucidate how hydrodynamic effects control DNA molecular conformation within a device. As such, recent simulations4–7 have provided a rigorous basis for the design of devices offering new ways to stretch and “array” large DNA molecules within carefully designed laminar flows. Consider that a laminar flow profile supported by a microchannel stretches and orients large DNA molecules within flow lines. Additional effects also focus their spatial distribution that are all mediated by specific device geometries, DNA size, and flow parameters. These accessible experimental variables foster imaging of long, fluorochrome stained, DNA molecules by fluorescence microscopy. Interestingly, during laminar flow, stretched DNA molecules migrate away from device walls and become focused, or concentrated within the centerline of a microchannel; these unique characteristics support the design of microfluidic devices for DNA arrays. The reduction of DNA concentration near device walls forms what is called a “depletion layer.” Consequently, this DNA migration effect has been intensively studied by theory, computer simulation, and experiment4–11.
Genomic applications of stretched DNA molecules using single molecule analytes, aside from FISH (Fluorescence in Situ Hybridization) techniques12, include optical mapping13–16, optical sequencing17–19, and nanocoding1. These genome analysis systems present stretched DNA using micro- and nanofluidic effects potentiating fluorescence microscopy to efficiently image fully unraveled, labeled molecules as arrays on charged surfaces2, or within nanoscale slit devices1. Such advantages enable the use of large DNA molecules for comparative genomics20, sequence assembly16, 21, 22, and the assessment of structural variations in populations23, obviating the current shortcomings plaguing next-generation DNA sequencing systems24–26 involving modest sequence read lengths. Importantly, modest read lengths hamper de novo genome sequencing by reducing the confidence of overlapping randomly acquired reads and obscure phasing of haplotype information.
Although surface deposition and nanoconfinement approaches are a proven means for molecular presentation within genome analysis platforms, development of advanced approaches for genome analysis greatly benefit from new ways presenting and arraying long DNA molecules obviating any surface/analyte interactions. This advantage eliminates surface-mediated effects that obscure, or hinder yields of enzymatic operations. The main challenge here is to develop flow-based modalities that orient and array DNA analytes within laminar flow in ways that potentiate imaging of molecules by fluorescence microscopy. Obviously, continuously operating laminar flows stretch large DNA molecules, but the required flow rates make high-resolution imaging of individual molecules impractical—rapidly moving molecules produce blurred images using reasonable camera exposure times. A more pressing concern is that concentration profiles of DNA chains slowly develop within microchannel flows, scaling as Ld/D; where Ld is the thickness of the depletion layer and D is the chain diffusion constant. We previously estimated that λ bacteriophage DNA (48.5 kb) requires ~100 sec for diffusing a distance of just 10 μm6, mandating impractically long microfluidic channels for creating well-developed concentration profiles. This is an important consideration when imaging stretched DNA molecules 10–1000 μm in length using high numerical aperture objectives, some having a depth of focus only ~200 nm deep. Here, the DNA depletion effect presents a high yield of molecules rapidly traveling through a fixed microscope focal plane within a device, while also preparing long and stretched molecules that are “optically flat.”
Microfluidic channels characteristically engender shear laminar flow, particularly when pressure-driven because of non-slip boundary conditions. However, the conditions required for significant DNA stretching include high shear rates, high pressure operation, which collectively blurs DNA molecules past microscope-based detection schemes. Here, we present results addressing this issue by specifically leveraging the unique features of oscillatory shear flow. We also present studies that experimentally investigate important variables governing DNA migration towards the centerline of a microchannel using oscillatory shear flow. These results are also compared against simulations. Our analysis shows the formation of hydrodynamic depletion layers relative to the microchannel walls depend on DNA molecular weight, flow shear rate, and oscillatory frequency5, 6. Simply stated, oscillatory shear flow stretches DNA molecules in ways quite similar to continuous operation10, 27, 28, but offers important advantages for imaging by fluorescence microscopy that foster use of stretched molecules as practical arrays for experimentation.
Results and Discussion
DNA Elongation
Pressure-driven flow in a microchannel stretches coiled DNA molecules by the imposed velocity gradient (Fig. 1; Fig. 2 shows the microfluidic device and experimental set-up); an oscillating flow field accomplishes the same objective, but engenders stretching within short channels. We leverage this action for visualization by strategically acquiring images within the brief time period during which the applied flow is reversed. Here (~50 ms; Fig. 1C) the applied flow ceases and stretched molecules remain in place while they only marginally relax. Flow cessation occurs because hysteresis develops from slop associated with reversal of the thread screw driving the syringe pump and the elastic impedance of the entire device. For example, Fig. 3A shows clear images of stretched (42–67%) T2 DNA molecules (164 kb; 71 μm polymer contour length, including intercalating dye contribution) acquired during separate intervals of flow reversal. In this experiment the average velocity was 0.25 mm/sec within a 40 × 40 μm channel, 8 mm in length. By comparison, Fig. 3B shows blurry images acquired during fluid flow. Blurry images are understandable since a molecule traveled, on average, 12.5μm during the 50 ms camera exposure.
Fig. 1. Oscillatory shear flow stretches DNA molecules.

(A) Cartoon of DNA elongation by shear flows in a microchannel. Reverse flow maintains a DNA’s elongated conformation in a laminar flow and locks molecules within the same imaging plane (B) Parabolic shear flow profile in a square channel calculated and using MATLAB using equation (5) in the Experimental section19. (C) Fluid velocities (forward “+”; backward “−“), under oscillatory flow were estimated by time-lapse imaging of a fluorescent bead in a microchannel (60 μm × 40 μm × 8 mm driven by a 1.6 nL/sec in average, flow at 1.7 Hz (square wave; dashed lines). The use of 40× objective (vs. 63×, or 100× used for other experiments) enabled a wider view of a fluorescent bead near the side wall. Measured fluid velocity compared to the driving frequency (dashed line) shows hysteresis effects and distortion.
Fig. 2. Experimental Set-Up.
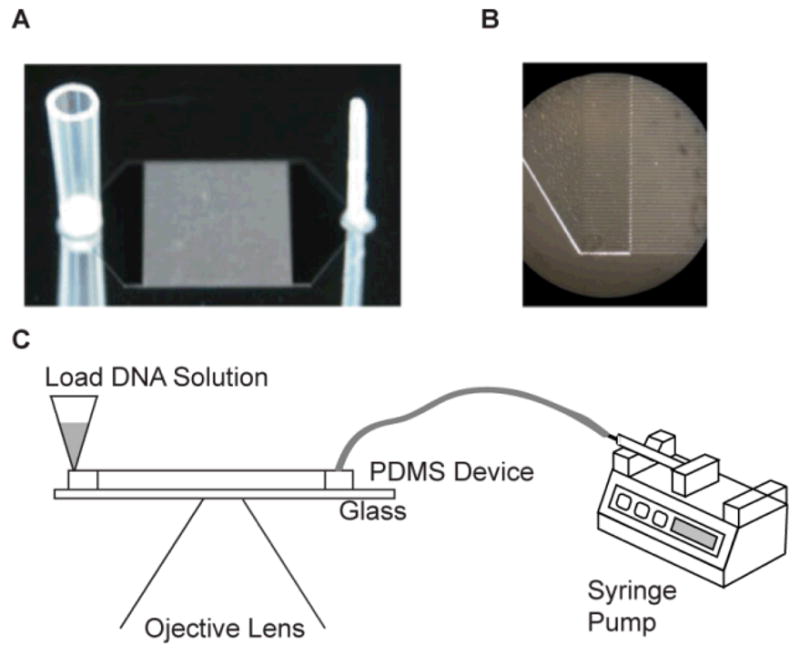
(A) Photograph of a photoresist patterned silicon wafer used to mold silastic replica devices (not shown). Ports were directly molded into silastic devices by gluing a section of a wide bore pipette tip (left) and a Teflon tube (right) to the wafer; attached ports appear mirrored on the wafer. The ports connect via plenums to a rectangular (8 mm × 1 cm) array of 125, 8 mm long square channels [40μm × 40 μm; 40 μm separation]. (B) Close-up micrograph of image (A) detailing plenum/microchannels. (C) Schematic of experimental set-up on an optical microscope. A syringe pump connected to the smaller port (right) of the device controls fluid flow; DNA is loaded through the larger port (left).
Fig. 3. DNA elongation under oscillatory shear flow.

(A) Images of stretched T2 bacteriophage DNA molecules (164 kb; polymer contour length stained with YOYO-1 is ~71 μm) in microfluidic channels (40 μm × 40 μm) acquired during pauses in flow direction. (B) Images of rapidly moving DNA molecules. Images (A) and (B) are obtained from the same experiment: flow rate per channel is 0.4 nL/sec (effective shear rate γ̇ = 26.2 s−1) driven at 0.25 Hz. A CCD camera (CoolSNAP HQ, Roper Scientific) acquired images after 200 sec of oscillation; exposure time was 50 msec using pixel binning (4:1) for increasing the frame transfer rate to computer (binned mode 335 × 255 pixels; full mode 1392 × 1040 pixels)
Although oscillatory shear flow offers clear visualization of elongated DNA molecules, stretched molecules within a flow present characteristics we need to consider. First, a molecule’s conformation is dynamic, continuously cycling between stretched and relaxed forms. Accordingly, flowing molecules tumble and thus recoil because the fluctuating ends of a DNA chain have some probability for occupying other laminar layers by Brownian motion27, 29, 30. Second, the ends of DNA molecules are relaxed in contrast to the well-stretched central portions, as shown in Fig. 3A. Relaxed ends are likely explained by the entropic arguments indicating that polymer ends have more freedom than internal segments31–33. Third, DNA elongation is not uniform across a microchannel because the shape of velocity profile is parabolic (Fig. 1B). Consequently, DNA molecules near walls are more stretched than those occupying the central portion of a microchannel.
DNA Focusing Within a Channel Centerline
We have previously demonstrated that under shear flow large DNA molecules are stretched and focused within the centerline of a microchannel when a chain’s Rg (radius of gyration) is within an order of magnitude of a channel’s characteristic dimension4–6. This microfluidic focusing effect is generally not observable because most device channels are less than a few centimeters in length, which does not allow sufficient molecular travel for achieving a well-developed concentration profile. We demonstrate the focusing effect in our device by time lapse imaging and analysis of T2 DNA chains under oscillatory flow (0.25 Hz; effective shear rate (γ̇) = 78.6 s−1 in the microchannel; Fig. 4). Qualitatively, the time-lapse images in Fig. 4 show the progressive migration, or focusing of stretched DNA molecules away from channel walls toward the centerline. We estimated DNA concentration profiles by frame averaging over a cycle (4 sec, ~75 images) consisting of images 39 pixels (10 μm; 63× objective) wide running across the width of a channel and passing through the centerline. Visually, these concentration profiles (Fig. 5) clearly demonstrate a time-dependent increase of fluorescence in the centerline, complemented by diminishing signals near microchannel walls.
Fig. 4. T2 DNA migration in a microchannel (focusing) mediated by oscillatory flow.

A series of micrographs, grabbed at different time points (S1 Movie), reveal progressive DNA migration; effective shear rate is 78.6 s−1 with an oscillation frequency of 0.25 Hz. Before oscillation (0 sec); random coil DNA molecules appear throughout the 40 μm-square channel; out-of-plane (image) coils appear as indistinct blobs of light. As oscillation proceeds, DNA depletion layers at walls flank well-stretched molecules; molecules at centerline (dashed lines). Image taken at 306.5 sec shows a well developed concentration profile with DNA molecules focused around the centerline. Since the fluorescence intensity profile from one image is noisy, frame averaging (4 sec; 75 images) results were used for measuring the full width, half maxima (FWHM) of the zone of DNA molecules surrounded by depletion layers; an example shows analysis of the 306.5 sec micrograph. In this experiment, a high DNA concentration was used for revealing DNA migration effects.
Fig. 5. Fluorescence intensity profiles of progressive migration (focusing) of T2 DNA migration in a microchannel.

The effective shear rate is 78.6 s−1 with an oscillation frequency of 0.25 Hz in 40 μm × 40 μm microchannels. Images (not shown) grabbed at the microchannel centerline for this analysis used a 100× objective. The profiles (see Experimental for details; offset for clarity) show the accumulation of molecules near the channel centerline; however, at 80 sec (bold line) a distinct dip forms at the centerline caused by DNA migration away from channel walls. The dip repeatedly vanishes and reappears even after a well-formed concentration profile is apparent.
Close inspection of the fluorescence profiles shown in Fig. 5 shows formation of a noticeable dip around the centerline in later profiles. Their existence was previously predicted and explained by the accumulation of DNA molecules flanking the channel centerline as being caused by the underlying mechanisms of DNA migration, or the focusing effect, which decrease as molecules approach the centerline5, 6. Although early Brownian dynamics simulations, using a single chain within a channel, predicts persistent diminished occupancy (dip) at the centerline despite reaching steady state5, 6, in this experiment, the concentration dip observed at 80 sec diminishes and becomes undetectable at 100 sec. These dips do not commonly persist during experimental observation (data not shown). Recently, a simulation considering semi-dilute and concentrated polymer chain concentration predicts that the magnitude of a dip is minimized at higher DNA concentration by using Lattice Boltzmann methods instead of Brownian dynamics7. These findings suggest further studies are necessary for fully understanding the dynamics of diminished molecular occupancy (dip) at a channel’s centerline.
Weissenberg Number Dependence
DNA migration generates depletion layers near walls whose thickness (Ld) is determined by the degree of DNA stretching 5, 8. The migration effect is also dependent on shear rate, DNA size, and oscillatory frequency6. For example, molecular focusing results (Fig. 6) shows that T2 DNA (164 kb) produces a larger depletion layer thickness (Ld) than λ DNA (48.5 kb) at the same shear rate. Given the same shear rate, DNA stretch is proportional to size because forces that stretch DNA are inversely proportional to chain length: f⃗ = R⃗(3kT/Nb2); where R⃗ is the end-to-end vector, k is the Boltzmann constant, T is the temperature, N is the number of monomers, and b is the size of monomer35. Since the required force (f⃗) to stretch DNA is inversely proportional to the number of monomers (N), larger DNA molecules show enhanced stretching and migrate farther at the same shear rate5, 6.
Fig. 6.

Depletion layer dependence on Weissenberg number with comparison to simulation. Experimental data used three effective shear rates: 26.2 s−1, 78.6 s−1, and 157.2 s−1for T2 DNA (164 kb; Rg=1.6 μm;■)34 and λ DNA (48.5 kb; Rg=0.76 μm;□)5 in 40 μm × 40 μm × 8 mm channels. Combining two DNA sizes and three shear rates produces six data points on the plot: The Weissenberg numbers for T2 DNA ranges from 22–133 (τ = 0.85 sec), while λ DNA ranges from 2.5–15 (τ = 0.095 sec). Simulation (T2 DNA:●, λ DNA: ○) results consider a single coarse-grained polymer chain model of beads and springs using Brownian dynamics. A depletion layer thickness (Ld) is calculated from the full width, half-maximal dimensions of a fluorescence intensity profile. Error bars represent the maximum and minimal values on the means from 3–4 separate experiments and SD on the means for 60 simulation runs. Fluorescence intensity profiles were acquired across a channel (10 μm wide) after a consistent concentration profile was achieved (200–320 sec). Inset shows a log-log plot of experimental and simulation results, which are compared against the scaling relationship (Eq. 1; dotted line): Log(Ld/Rg)= (2/3)Log(Wi).
The “effectiveness” of an applied shear flow and molecular size is estimated by a dimensionless value called the Weissenberg number (Wi) -- the ratio of shear rate (γ̇) to molecule relaxation rate (1/τ); so Wi = γ̇ τ. Accordingly a higher Weissenberg number means more stretching and enhanced migration. As shown in Fig. 6, depletion layer thickness increases with Wi, but levels off with increasing Wi. This observation is consistent in both experiment and simulation (see Experimental for simulation details). However, there is a difference between experiment and simulation: depletion layer values in the simulation are generally larger than experimental measurements. Such difference might be expected since chain migration is reduced by inter-DNA repulsion, which increases with DNA concentration7, 11 during flow; however, the computationally demanding simulation used a single DNA chain and highlights the role that concentration effects play in the formation of the depletion layer.
Recently, a scaling relationship was derived showing depletion layer (Ld) dependence with the Weissenberg number (Wi) in a semi-infinite domain as
| (1) |
where Rg is radius of gyration8. Since both Wi and Rg vary with DNA size, depletion layer thickness depends on DNA size and shear rate. Although Eq. (1) elegantly relates depletion layer thickness, DNA size and shear rate, our experimental findings and simulation (Fig. 6, inset) do not closely follow scaling theory. This disagreement may be explained by the fact that Eq. (1) was derived using simplified assumptions. The scaling relationship is derived for an elastic dumbbell, which represents a polymer, in shear flow near a solid wall. These simplifications do not allow the theory to capture how flow changes the polymer conformation, how the finite height of a channel affect the depletion layer thickness, and how different do simple shear flow and Poiseuille flow changes the shear forces acting on the polymer. For example, simple shear flow exerts a constant shear force on the polymer, while the shear force exerted in Poiseuille flow decreases as the polymer moves away from the no-slip surface. As the shear force decreases, polymer deformation decreases, and the migration force decreases. We attribute the disagreement with Eq. (1) with our observations to these effects, and the fact that finite boundaries in the channel limits the growth of the depletion layer thickness while the theory analysis was done in a semi-infinite domain allowing the polymers to migrate infinitely far away from the wall8.
Depletion Layer Thickness Dependence on Oscillatory Frequency
Under continuous flow, chain stretching and migration are expected to simply increase with higher Weissenberg number4, 5. However, oscillatory flow presents a new, potentially useful variable understood by considering the strain experienced by a DNA molecule during a half-cycle6:
| (2) |
where ω is frequency and γ̇eff is effective shear rate. This relationship shows that increasing oscillation frequency reduces the strain experienced by a DNA molecule, resulting in reduced elongation and migration. With this relationship in mind (Eq. 2), we evaluated how the applied oscillation frequency affects depletion layer thickness using T2 DNA (40 × 40 μm microchannels) under a fixed shear rate (Fig. 7) and compared these data with Brownian dynamics simulation (see Experimental). The simulation shows modest decrease in depletion layer thickness over a five-fold increase of oscillatory frequency and this trend is qualitatively echoed by experimental findings. Therefore, in addition to the reduced strain with frequency, we suspect there may be another possible explanation for experimental results in Fig. 7; the PDMS device and plastic tubing used in this experiment have elastic properties which modify the response of device to the action of the applied oscillatory driving pressure of the syringe pump as demonstrated in Fig. 1C.
Fig. 7. Depletion layer thickness vs. oscillatory frequency.

Filled squares (■) represent data points obtained at 0.25 Hz, 0.5 Hz, and 1 Hz respectively with the shear rate of 157 s−1 (Wi=134; T2 DNA). Filled circles (●) represent computer simulation results by treating a single DNA molecule with Brownian dynamics without considering the delayed response of PDMS devices. Error bars represent the maximum and minimal values on the means from 3–4 separate experiments and SD on the means for 60 simulation runs. The depletion layer thickness (Ld) is the half-maximal width of fluorescence intensity profile. Higher frequency reduces depletion layers because shear strain experienced by DNA under oscillatory flow decreases as frequency increase. Also, the elastic property of PDMS device and plastic tubing reduces net shear strain. A quantitative measure of the depletion layer thickness (Ld) is calculated as the same method used in Fig. 6.
Experimental
Reagents
Stock YOYO-1 in DMSO (dimethyl sulfoxide) was purchased from Invitrogen (Eugene, OR, USA) and was diluted in 1× TE (pH 8.0) with 4 % β-mercaptoethanol. Bacteriophage λ DNA (48.5 kb) was purchased from New England Biolabs (Beverly, MA, USA). Bacteriophage T2 DNA (164 kb) was supplied by D.C. Schwartz.
Microchannel Fabrication
The microfluidic device was fabricated in PDMS using soft lithography36; a complete device is shown in Fig. 2. First, a template wafer was fabricated using SU-8. Each device pattern has 125 microchannels of 40 × 40 μm, which feed into a single plenum for connecting to a syringe pump (Model 210, KD Scientific, Holliston, MA, USA). After fabrication of a template wafer, a feature for the inlet port was fashioned by gluing a Teflon tube at the peak of one triangular plenum. The loading port feature was created by gluing a piece of a wide bore pipette tip at peak of the other plenum.
Polydimethylsiloxane (Sylgard 184, PDMS) was purchased from Dow Corning (Midland, MI, USA) PDMS. The pre-polymer was cast on the patterned wafer and was spun coated onto a glass cover slip for creating the window (22 mm × 22 mm; Fisher’s Finest, Fisher Scientific) by Spinner WS-200 (Laurell Technologies Corp., North Wales, PA, USA) with 4000 rpm for 1 minute. A PDMS device and a PDMS coated cover slip cured at 65° C for 4 hrs were treated in an oxygen plasma generator for 18 sec (O2 pressure ~0.67 millibars; load coil power ~100 W; Technics Plasma GMBH 440, Florence, KY, USA), after which they were placed against each other and irreversibly bonded. The microchannel device was stored in high purity water in order for preserving hydrophilicity imbued by oxygen plasma treatment. Polytetrafluoroethylene (PTFE) tubing, with an outer diameter slightly larger than the inner diameter of the inlet port, was inserted into the hole to make the fluidic connections and then connected to the syringe pump completing the setup.
DNA, Buffers, and Microfluidic Device Set-Up
Bacteriophage λ and T2 DNA were stained with the bis-intercalating dye YOYO-1 (Invitrogen, Carlsbad, CA, USA) in buffer: 10 mM TrisHCl, 1 mM EDTA (1xTE, pH 8.0), and 4% (v/v) β-mercaptoethanol as an antiphotobleaching agent. A syringe (10 μl Gastight #1701; Hamilton Company, USA) was connected to the edge of the right triangular plenum through Teflon tubing (PTFE 30 TW, 0.022″ ID × 0.042″ OD; Cole-Parmer Instrument Company, Vernon Hills, IL, USA), and a wide bore pipette tip was put in the edge of the left triangular plenum in Fig. 2.
DNA was loaded by pipetting into the wide bore port after the entire device was prefilled with buffer using a programmable syringe pump. Pump action was then used to completely draw the DNA solution into the device prior to oscillatory flow. Oscillatory frequency is given by ω= 2 × vol/flowrate where ω is the oscillatory frequency, vol is volume of a half cycle (μL), and flowrate is volume per unit time (μL/sec).
Imaging and Analysis
Molecules were imaged using an argon ion laser-illuminated inverted Zeiss Axiovert 200M microscope, which was equipped with 63× and 100× objectives (Zeiss Plan-Neofluar oil immersion objective) and a CCD digital camera (Photometrics CoolSNAP HQ, 1392 × 1040 pixels, binned to 336 × 256, with 12-bit digitization). Light path actuators, focus, and stage translation was controlled by a Ludl Electronics MAC 2000 interface bus. CCD captured images were transferred to a personal computer during a 3 msec interval placed between consecutive images after a 50 msec exposure. All images in this experiment were taken at 20 μm above the channel surface, which is the centerline of channel height and adjusted by our image collection program. Image collection was performed using software we wrote in Borland C++ builder 6.0 in Windows XP and image analysis software was written in ANSI C++ using GTK+ under Linux. Image collection software stamped image acquisition time with millisecond resolution into a collection log-file. Each image was saved as our own image data format (omi format: optical mapping image), which is similar to uncompressed tiff file format, but with an abbreviated header. For calculating fluorescence intensity profiles, pixel values across the width of a channel were integrated as a series of 255 consecutive strips 39 pixels in length, and 1 pixel wide: (10 μm; 63× objective and 6.4 μm in 100× objective). Thus, Fig. 5 used a cycle of images (4 sec, 75 images) for each profile. Fig. 6 and Fig. 7 integrated images during 120 sec at the steady state of DNA migration from 200 sec to 320 sec after start of oscillation. Depletion layer thickness was measured from full width of half maxima of intensity profiles. Profiles usually have distinct pattern at the wall positions of microchannel; thus connecting line between wall positions was treated as the baseline.
Calculation of Effective Shear Rate
Shear rate, an important variable for estimating polymer deformation, is defined in a square microchannel as
| (4) |
where vx(y,z) is the velocity in the x direction, given by
| (5) |
where αn=(2n−1)π/2, dp is the pressure difference, η is the viscosity, and H is the height and width of square channel and vx(y,z) is drawn in Fig. 1B 6, 37.
Since shear rate from equation (4) is not uniform throughout a channel, we use an effective shear rate (γ̇eff) defined as
| (6) |
where H is channel height6 and vmax is the maximum velocity which is the imposed velocity at the center line ofthe channel and is given by
| (7) |
Alternatively, flowrate is calculated from velocity as
| (8) |
From equations (5)~(8), effective shear rate can be calculated from the flowrate which is set value in the syringe pump and divided by 125, which is the number of channels in one device.
| (9) |
From equation (9), effective shear rate can be calculated from two experimental parameters of average flow rate and channel dimension. For example, a flow rate (9 μl/min; a set value in the syringe pump) in a 40 μm square microchannel can be converted to effective shear rate (78.6 s−1).
Computer Simulation of Brownian Dynamics
Brownian dynamics simulations of a single DNA molecule undergoing oscillatory flow were performed. The simulation conditions match the experimental conditions in this study using the method we have previously developed5, 6. Each DNA molecule is modeled as a coarse-grained polymer with a bead-spring model. The simulation method accounts for the competitions between chain entropic elasticity (spring elasticity), self-avoiding interactions between beads, wall confinement, Brownian motion, and hydrodynamic interactions between chain segments. The chain entropic elasticity is determined from the worm-like chain force-extension relation developed by Marko and Siggia38. In our model, each worm-like spring represents 19.8 DNA Kuhn segments. The self-avoiding interaction between two chain segments is represented as the repulsion between two blobs, each with 19.8 Kuhn segments. The blob-blob repulsion results in a Gaussian potential. As an example of T2 DNA, it is modeled as a chain with 34 worm-like springs (6000 bp/spring) and 35 “beads” that repel each other with a Gaussian excluded volume force5, 6. More specifically, T2 DNA (164 kb) of 34 worm-like springs has the following parameters: the radius of gyration of 1.6 μm, the longest relaxation time of 0.80 s, and diffusivity of 0.17 μm2/s. For λ DNA (48.5 kb) of 10 worm-like springs, the radius of gyration is 0.76μm, the longest relaxation time is 0.095 s, and the chain diffusivity is 0.48 μm2/s, which are matched to the experimental data in bulk solution39. Intra-chain hydrodynamic interactions are accounted for by treating each bead as a point particle and solving the hydrodynamic field to satisfy the fluctuation-dissipation theorem. Oscillatory flow is applied with an external parabolic flow velocity profile with a flowrate that varies sinusoidally with time. Each data point represents the average of 60 chains. The average bead density profile is collected after the density profile reaches steady after the chains undergo flow for 300 seconds. The full width at half maximum of bead density profile has been utilized to generate simulation results in Fig. 6 and Fig. 7.
Conclusions
We present findings and analysis showing that stretched DNA molecules are readily created and analyzed using a simple microfluidic device driven by oscillatory flow. Our approach obviates the need for impractically long microchannels for engendering DNA stretching and focussing. Experimental measurements of the DNA depletion layer (Ld), form during oscillatory flow and dependent on Wi, qualitatively follow simulation findings using Brownian dynamics. Furthermore we show that the oscillatory frequency dependence of Ld is modest across a five-fold range by both experiment and simulation; however, the concordance here is less confident.
Microfluidic systems employing oscillatory flows have many intrinsic features that may lay the basis for new single molecule platforms due to their ease of fabrication, loading, and manipulation of individual DNA molecules. As such, the avoidance of quixotic surface effects, traditionally used to create arrays, are supplanted by readily controlled fluid flows which we have shown can directly modulate the dynamics of large DNA molecules that create “fluid arrays.”
Supplementary Material
Acknowledgments
We thank Michael D. Graham, Eileen Dimalanta for helpful discussions. This work was supported by the National Science Foundation (NSEC; USA), National Institute of Health (NHGRI; USA), and the Sogang University Research Grant No. 200810019.01
Footnotes
Electronic Supplementary Information (ESI) available: Supplementary information S1 Movie. See DOI: 10.1039/b000000x/
Contributor Information
Kyubong Jo, Email: jokyubong@sogang.ac.kr.
David C. Schwartz, Email: dcschwartz@wisc.edu.
References
- 1.Jo K, Dhingra DM, Odijk T, de Pablo JJ, Graham MD, Runnheim R, Forrest D, Schwartz DC. Proc Natl Acad Sci U S A. 2007;104:2673–2678. doi: 10.1073/pnas.0611151104. [DOI] [PMC free article] [PubMed] [Google Scholar]
- 2.Dimalanta ET, Lim A, Runnheim R, Lamers C, Churas C, Forrest DK, de Pablo JJ, Graham MD, Coppersmith SN, Goldstein S, Schwartz DC. Anal Chem. 2004;76:5293–5301. doi: 10.1021/ac0496401. [DOI] [PubMed] [Google Scholar]
- 3.Larson RG. Science. 2007;318:57–58. doi: 10.1126/science.1142441. [DOI] [PubMed] [Google Scholar]
- 4.Jendrejack RM, Dimalanta ET, Schwartz DC, Graham MD, de Pablo JJ. Phys Rev Lett. 2003:91. doi: 10.1103/PhysRevLett.91.038102. [DOI] [PubMed] [Google Scholar]
- 5.Jendrejack RM, Schwartz DC, de Pablo JJ, Graham MD. J Chem Phys. 2004;120:2513–2529. doi: 10.1063/1.1637331. [DOI] [PubMed] [Google Scholar]
- 6.Chen YL, Graham MD, de Pablo JJ, Jo K, Schwartz DC. Macromolecules. 2005;38:6680–6687. doi: 10.1021/ma050238d. [DOI] [PMC free article] [PubMed] [Google Scholar]
- 7.Chen YL, Ma H, Graham MD, de Pablo JJ. Macromolecules. 2007;40:5978–5984. [Google Scholar]
- 8.Ma HB, Graham MD. Phys Fluids. 2005;17:083103. [Google Scholar]
- 9.Fang L, Hu H, Larson RG. J Rheol. 2005;49:127–138. [Google Scholar]
- 10.Fang L, Hsieh CC, Larson RG. Macromolecules. 2007;40:8490–8499. [Google Scholar]
- 11.Fang L, Larson RG. Macromolecules. 2007;40:8784–8787. [Google Scholar]
- 12.Bensimon D, Simon AJ, Croquette V, Bensimon A. Phys Rev Lett. 1995;74:4754–4757. doi: 10.1103/PhysRevLett.74.4754. [DOI] [PubMed] [Google Scholar]
- 13.Schwartz DC, Li X, Hernandez LI, Ramnarain SP, Huff EJ, Wang YK. Science. 1993;262:110–114. doi: 10.1126/science.8211116. [DOI] [PubMed] [Google Scholar]
- 14.Zhou S, Herschleb J, Schwartz DC. In: New Methods for DNA Sequencing. Mitchelson KR, editor. Elsevier Scientific Publishers; Amsterdam: 2007. [Google Scholar]
- 15.Ananiev GE, Goldstein S, Runnheim R, Forrest DK, Zhou SG, Potamousis K, Churas CP, Bergendahl V, Thomson JA, Schwartz DC. BMC Molecular Biology. 2008;9 doi: 10.1186/1471-2199-9-68. [DOI] [PMC free article] [PubMed] [Google Scholar]
- 16.Zhou S, Bechner MC, Place M, Churas CP, Pape L, Leong SA, Runnheim R, Forrest DK, Goldstein S, Livny M, Schwartz DC. BMC Genomics. 2007;8:278. doi: 10.1186/1471-2164-8-278. [DOI] [PMC free article] [PubMed] [Google Scholar]
- 17.Ramanathan A, Huff EJ, Lamers CC, Potamousis KD, Forrest DK, Schwartz DC. Anal Biochem. 2004;330:227–241. doi: 10.1016/j.ab.2004.03.029. [DOI] [PubMed] [Google Scholar]
- 18.Zhou S, Pape L, Schwartz DC. In: Next Generation Genome Sequencing: Towards Personalized Medicine. Janitz M, editor. Wiley-VCH Verlag & Co; Weinheim: 2008. pp. 133–149. [Google Scholar]
- 19.Ramanathan A, Pape L, Schwartz DC. Anal Biochem. 2005;337:1–11. doi: 10.1016/j.ab.2004.09.043. [DOI] [PubMed] [Google Scholar]
- 20.Zhou S, Kile A, Bechner M, Place M, Kvikstad E, Deng W, Wei J, Severin J, Runnheim R, Churas C, Forrest D, Dimalanta ET, Lamers C, Burland V, Blattner FR, Schwartz DC. J Bacteriol. 2004;186:7773–7782. doi: 10.1128/JB.186.22.7773-7782.2004. [DOI] [PMC free article] [PubMed] [Google Scholar]
- 21.Lim A, Dimalanta ET, Potamousis KD, Yen G, Apodoca J, Tao C, Lin J, Qi R, Skiadas J, Ramanathan A, Perna NT, Plunkett G, 3rd, Burland V, Mau B, Hackett J, Blattner FR, Anantharaman TS, Mishra B, Schwartz DC. Genome Res. 2001;11:1584–1593. doi: 10.1101/gr.172101. [DOI] [PMC free article] [PubMed] [Google Scholar]
- 22.Perna NT, Plunkett G, 3rd, Burland V, Mau B, Glasner JD, Rose DJ, Mayhew GF, Evans PS, Gregor J, Kirkpatrick HA, Posfai G, Hackett J, Klink S, Boutin A, Shao Y, Miller L, Grotbeck EJ, Davis NW, Lim A, Dimalanta ET, Potamousis KD, Apodaca J, Anantharaman TS, Lin J, Yen G, Schwartz DC, Welch RA, Blattner FR. Nature. 2001;409:529–533. doi: 10.1038/35054089. [DOI] [PubMed] [Google Scholar]
- 23.Kidd JM, Cooper GM, Donahue WF, Hayden HS, Sampas N, Graves T, Hansen N, Teague B, Alkan C, Antonacci F, Haugen E, Zerr T, Yamada NA, Tsang P, Newman TL, Tuzun E, Cheng Z, Ebling HM, Tusneem N, David R, Gillett W, Phelps KA, Weaver M, Saranga D, Brand A, Tao W, Gustafson E, McKernan K, Chen L, Malig M, Smith JD, Korn JM, McCarroll SA, Altshuler DA, Peiffer DA, Dorschner M, Stamatoyannopoulos J, Schwartz D, Nickerson DA, Mullikin JC, Wilson RK, Bruhn L, Olson MV, Kaul R, Smith DR, Eichler EE. Nature. 2008;453:56–64. doi: 10.1038/nature06862. [DOI] [PMC free article] [PubMed] [Google Scholar]
- 24.Harris TD, Buzby PR, Babcock H, Beer E, Bowers J, Braslavsky I, Causey M, Colonell J, Dimeo J, Efcavitch JW, Giladi E, Gill J, Healy J, Jarosz M, Lapen D, Moulton K, Quake SR, Steinmann K, Thayer E, Tyurina A, Ward R, Weiss H, Xie Z. Science. 2008;320:106–109. doi: 10.1126/science.1150427. [DOI] [PubMed] [Google Scholar]
- 25.Margulies M, Egholm M, Altman WE, Attiya S, Bader JS, Bemben LA, Berka J, Braverman MS, Chen YJ, Chen ZT, Dewell SB, Du L, Fierro JM, Gomes XV, Godwin BC, He W, Helgesen S, Ho CH, Irzyk GP, Jando SC, Alenquer MLI, Jarvie TP, Jirage KB, Kim JB, Knight JR, Lanza JR, Leamon JH, Lefkowitz SM, Lei M, Li J, Lohman KL, Lu H, Makhijani VB, McDade KE, McKenna MP, Myers EW, Nickerson E, Nobile JR, Plant R, Puc BP, Ronan MT, Roth GT, Sarkis GJ, Simons JF, Simpson JW, Srinivasan M, Tartaro KR, Tomasz A, Vogt KA, Volkmer GA, Wang SH, Wang Y, Weiner MP, Yu PG, Begley RF, Rothberg JM. Nature. 2005;437:376–380. doi: 10.1038/nature03959. [DOI] [PMC free article] [PubMed] [Google Scholar]
- 26.Greenleaf WJ, Block SM. Science. 2006;313:801–801. doi: 10.1126/science.1130105. [DOI] [PMC free article] [PubMed] [Google Scholar]
- 27.Smith DE, Babcock HP, Chu S. Science. 1999;283:1724–1727. doi: 10.1126/science.283.5408.1724. [DOI] [PubMed] [Google Scholar]
- 28.Larson JW, Yantz GR, Zhong Q, Charnas R, D’Antoni CM, Gallo MV, Gillis KA, Neely LA, Phillips KM, Wong GG, Gullans SR, Gilmanshin R. Lab Chip. 2006;6:1187–1199. doi: 10.1039/b602845d. [DOI] [PubMed] [Google Scholar]
- 29.Hur JS, Shaqfeh ESG, Larson RG. J Rheol. 2000;44:713–742. [Google Scholar]
- 30.Liu TW. J Chem Phys. 1989;90:5826–5842. [Google Scholar]
- 31.Zimm BH. Macromolecules. 1998;31:6089–6098. [Google Scholar]
- 32.Marko JF, Siggia ED. Macromolecules. 1995;28:8759–8770. [Google Scholar]
- 33.Perkins TT, Smith DE, Larson RG, Chu S. Science. 1995;268:83–87. doi: 10.1126/science.7701345. [DOI] [PubMed] [Google Scholar]
- 34.Jendrejack RM, Schwartz DC, Graham MD, de Pablo JJ. J Chem Phys. 2003;119:1165–1173. doi: 10.1063/1.1637331. [DOI] [PubMed] [Google Scholar]
- 35.Rubinstein M, Colby RH. Polymer Physics. Oxford University Press; Oxford: 2003. [Google Scholar]
- 36.Whitesides GM, Ostuni E, Takayama S, Jiang XY, Ingber DE. Ann Rev Biomed Eng. 2001;3:335–373. doi: 10.1146/annurev.bioeng.3.1.335. [DOI] [PubMed] [Google Scholar]
- 37.Pozrikidis C. Introduction to Theoretical and Computational Fluid Dynamics. Oxford University Press; 1996. [Google Scholar]
- 38.Marko JF, Siggia ED. Macromolecules. 1994;28:8759. [Google Scholar]
- 39.Smith DE, Perkins TT, Chu S. Macromolecules. 1996;29:1372–1373. [Google Scholar]
Associated Data
This section collects any data citations, data availability statements, or supplementary materials included in this article.