Abstract
Among the cellular responses to photodamage initiated by photodynamic therapy (PDT) are autophagy and apoptosis. While autophagy is a reversible process that can be both a survival and a death pathway, apoptosis is irreversible, leading only to cell death. In this study, we followed the fate of mouse leukemia L1210 cells after photodamage to the endoplasmic reticulum (ER) using a porphycene photosensitizer, where Bcl-2 was among the PDT targets. In wild-type cells, we observed a rapid wave of autophagy, presumed to represent the recycling of some damaged organelles, followed by apoptosis. Using shRNA technology, we created a Bax knockdown line (L1210/Bax−). In the latter cell line, we found a marked decrease in apoptosis after photodamage or pharmacologic inactivation of Bcl-2 function, but this did not affect PDT efficacy. Loss of viability was associated with a highly-vacuolated morphology consistent with autophagic cell death. Previous studies indicated pro-survival attributes of autophagy after low-dose PDT, suggesting that autophagy may be responsible for the ‘shoulder’ on the dose-response curve. It appears that attempts at extensive recycling of damaged organelles are associated with cell death, and that this phenomenon is amplified when apoptosis is suppressed.
Introduction
Photodynamic therapy (PDT) involves the use of photosensitizing agents that localize in neoplastic tissues and/or their vasculature.1 Irradiation at an appropriate wavelength leads to an interaction between the photosensitizing agent and oxygen in tissues, resulting in formation of reactive oxygen species that can cause potentially cytotoxic photodamage. Oleinick’s group was the first to demonstrate that PDT could lead to an initiation of the apoptotic death program.2 It was later proposed that apoptosis was a means for the disposing of dead cells, but was not necessary for expression of the cytotoxic effects of PDT.3–6 We originally proposed that the initiation of apoptosis by PDT, using a porphycene photosensitizing agent, derived from direct mitochondrial photodamage.7 Later work revealed that the initial target of many photosensitizing agents was the anti-apoptotic protein Bcl-2,8,9 a finding confirmed by Oleinick’s group.10 This protein is one of a group of family members that sequester pro-apoptotic molecules such as Bax and Bak, thereby inhibiting apoptosis. Photodamage to Bcl-2 and related proteins can therefore result in the release of pro-apoptotic molecules and the subsequent initiation of apoptosis.
Inactivation of Bcl-2 function can have additional consequences. The protein Beclin-1 also forms a complex with Bcl-2 and related anti-apoptotic proteins. Release of Beclin-1 results in interactions with additional proteins, ultimately leading to the initiation of macroautophagy.11 In this report, we will use the term ‘autophagy’ to indicate this process. Autophagy has received considerable attention during the last few years. The process involves formation of vacuoles that engulf a portion of the cytosol, often including sub-cellular organelles. This was initially identified as a response to starvation, permitting cells to recycle degraded, damaged or aging components. More recently, reports have appeared suggesting that autophagy can also lead to cell death. Several reviews on this topic have recently been published.12–14
We have established that both autophagy and apoptosis can occur in leukemia L1210 cells after ER or mitochondrial photodamage15 and can protect cells from low PDT doses.16 An autophagic response to PDT has also been observed in another cell line.17 In this study, we examined effects of ER photodamage in L1210 and a Bax knockdown cell line (L1210/Bax−). Some comparisons with a cell line in which autophagy had been suppressed (L1210/Atg7−) were also made. Results obtained with the latter cell line have already been reported.16 This report deals mainly with the consequences of Bax silencing on autophagic vs. apoptotic responses to Bcl-2 inactivation.
Experimental
Drugs and chemicals
The porphycene termed CPO was prepared by Prof. Gracça Vicente, Department of Chemistry, Louisiana State University. Localization and other properties of CPO have been described.9,18 CPO was dissolved in DMSO to yield a 1mMstock solution. This was stored at 4 °C under nitrogen. DEVD-R110, a fluorogenic substrate for caspase-3 activity,19 was provided by Molecular Probes, Eugene, OR. The Bcl-2 antagonist HA14-120 was purchased from Ryan Scientific Inc. (Isle of Palms, SC). Since this reagent slowly loses activity in the presence of water, solutions were made up in anhydrous DMSO and stored in small aliquots at −20 °C under nitrogen.
Cells and cell culture
Murine leukemia L1210 cells, Atg7 and Bax knockdown derivatives of L1210 were initially grown in sealed flasks using Fisher’s medium (Sigma-Aldrich) containing 10% horse serum and supplemented with 1 mM glutamine, 1 mM mercaptoethanol and gentamicin. Since Fisher’s medium is no longer commercially available, an approximation of the formula was prepared by supplementing the α-MEM formulation (GIBCO-BRL, Grand Island, NY) with MgCl2 (45 mg l−1), methionine (75 mg l−1), phenylalanine (30 mg l−1), valine (30 mg l−1) and folic acid (9 mg l−1). Short-term experiments were carried out in this growth medium with 20 mM HEPES (pH 7.4) replacing NaHCO3. This permits working with high cell densities while maintaining a neutral pH. Methods for preparation of knockdown cell lines have been described.21 The shRNA (short-hairpin RNA) constructs used for the Atg7 and Bax knockdowns were obtained from Open Biosystems, Huntsville, AL. Use of shRNA permits a heritable gene silencing.
Protocols
Cell suspensions at a density of 7 mg ml−1 wet weight (2 × 10⁶ cells) were used throughout. Cells were incubated with 2 µM CPO for 30min at 37 °C, then washed and resuspended in fresh medium at 10 °C. The light dose was provided by a 600 W quartz-halogen source filtered with 10 cm of water to remove infrared wavelengths. The bandwidth was further confined to 620 ± 20 nm using interference filters (Oriel, Stratford, CT). The time of irradiation was adjusted to yield the desired loss of viability as determined by clonogenic assays. An LD90 PDT effect was achieved using a light dose of 135 mJ cm−2. The power density was 1.5 mW cm−2, measured with a Vector H410 photometer (ScienTech, Boulder, CO).
Phase-contrast, fluorescence and electron microscopy
Images were acquired with a Nikon E-600 microscope using a Photo-metrics Coolsnap HQ CCD camera. To minimize photo-bleaching, exposure times were limited to <100 ms. Chromatin condensation was assessed by fluorescence using HO33342 as described before,9 using 330–380 nm excitation and measuring emission at 420–450 nm. Images were processed using MetaMorph software.
For electron microscopy, L1210 cells were fixed with glutaraldehyde and osmium tetroxide, treated with uranyl acetate + lead citrate for enhanced protein and lipid staining, and then dehydrated in ethanol. The cell pellets were embedded in epon resin and cut with an ultramicrotome to a 70 nm thickness before viewing.
DEVDase activity
Cells were collected at 20 min after irradiation, washed and lysed in 200 µl of buffer containing 50 mM Tris pH 7.5, 0.03% Nonidet P-40 and 1mM DTT. The lysate was briefly sonicated and the debris removed by centrifugation at 10 000 g for 1 min. The supernatant fluid (100 µl) was mixed with 40 µM DEVD-R110, 10mM HEPES pH 7.5, 50 mM NaCl, and 2.5 mM DTT in a total volume of 200 µl. The rate of increase in fluorescence, representing release of rhodamine-110 from the fluorogenic substrate, was measured over 30 min, using a fluorescent plate reader at room temperature.
DEVDase activity is reported in terms of nmol product/min/mg protein. Control determinations involved extracts of untreated cells treated with drug vehicle alone. Each assay was performed with triplicate. The BioRad assay (Catalog No. 500–0006) was used to estimate protein concentrations, using bovine serum albumin as the standard.
Western blots
Cells were lysed in SDS-PAGE buffer, and the lysate heated to 100 °C for 5min. Aliquots containing 40 µg of protein perwell were used for western blot analysis.21 Antibodies to murine Bax (BD-Pharmingen (San Jose, CA), murine LC3 protein (Proteintech Group, Inc., Chicago, IL) and a rabbit polyclonal antibody to a peptide mapping to the carboxy terminus of human Atg7 (Prosci Inc., Poway, CA) were used. Electrophoresis was carried out on 10% acrylamide gels and the proteins transferred to polyvinylidene fluoride membranes. The membranes were probed with appropriate antibodies, followed by a 1 h incubation with an alkaline phosphatase-coupled secondary antibody at room temperature (Vistra ECF western blot reagent, Amersham). A proprietary substrate is then cleaved by phosphatase activity to form a fluorescent product that could be detected with the using a Storm imaging system (Molecular Dynamics).
Viability
Clonogenic assays were used to determine loss of viability. Serial dilutions of cell suspensions were plated on soft agar. After 7–9 day growth in a humidified chamber under 5% CO2, colonies were counted and compared with untreated control values. All such experiments were carried out in triplicate. The plating efficiency of control L1210 cell cultures was approximately 70%.
Results and discussion
Western blots
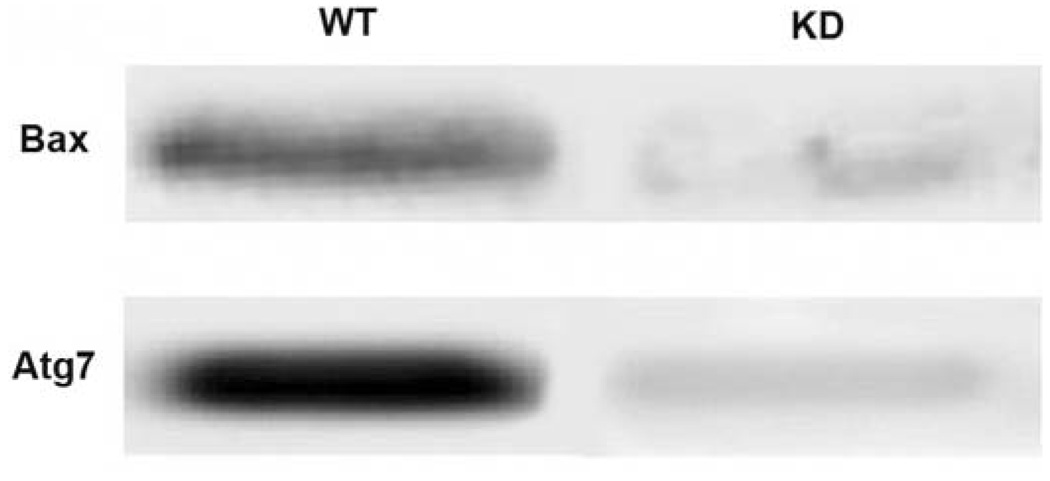
The degree of knockdown of Atg7 and Bax is shown in Fig. 1. There was at least a 95% decrease in protein expression, as indicated by densitometric measurements.
Fig. 1.
Western blots showing loss of Atg7 and Bax proteins in knockdown (KD) vs. wild-type (WT) L1210 cells.
Effects of the Bax knockdown
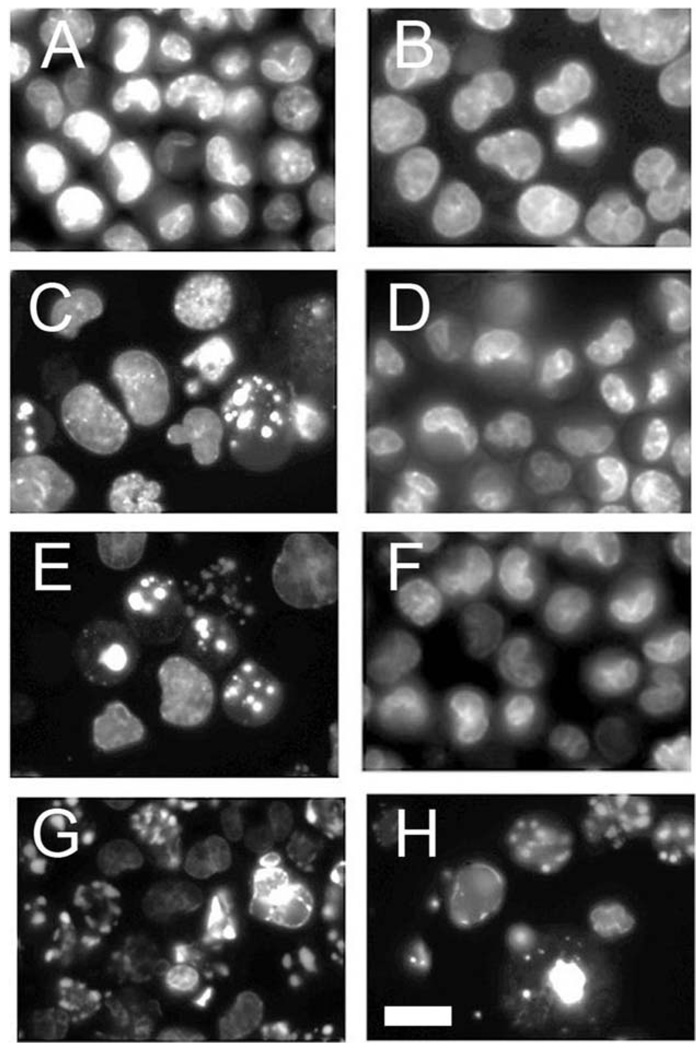
Properties of the L1210/Bax− sub-line were assessed by observing DNA fragmentation and measuring DEVDase activation. Numbers of apoptotic nuclei were determined by counting three fields of 100 cells each, 60 min after treatment with graded levels of HA14-1. Cells were labeled with HO33342 during the final 5 min of each incubation.
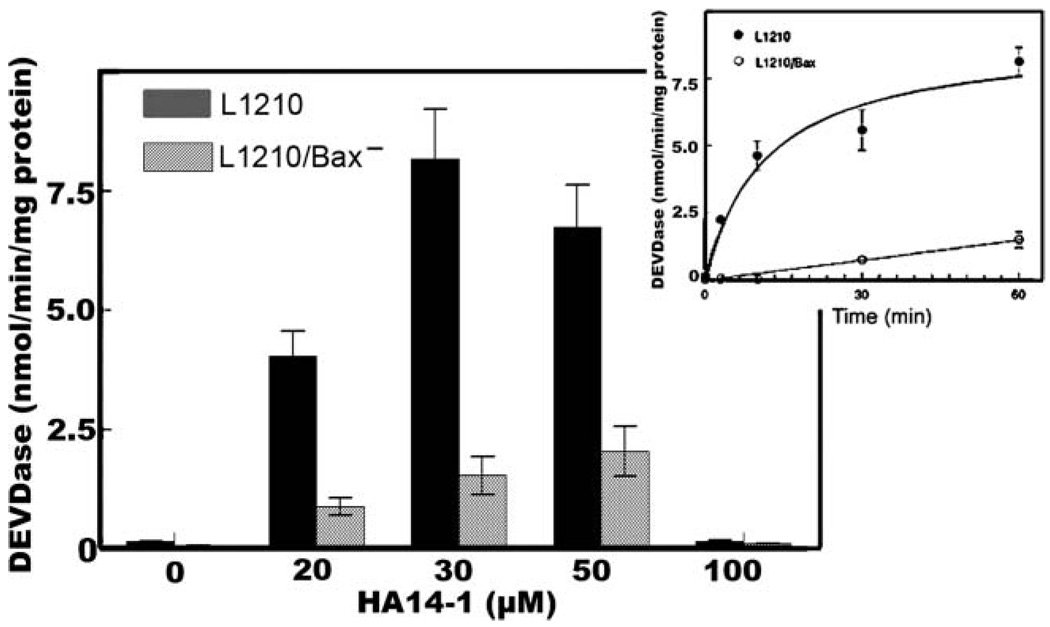
The knockdown cell line was resistant to the initiation of apoptosis by the Bcl-2 family antagonist HA14-1 at drug levels (20–30 µM) that readily elicited an apoptotic response in L1210 (Fig 2). At a 50 µM HA14-1 concentration, some chromatin condensation was, however, observed in L1210/Bax− (Fig. 2(H)). A dose-response study on DEVDase activation (a measure of caspase 3/7 activation) revealed that enzyme activation was suppressed but not wholly absent in L1210/Bax− (Fig. 3). A time-course study (inset) indicated that even at a 30 µM concentration of HA14-1, a gradual increase in DEVDase activity could be demonstrated. This residual activity could derive from the low level of Bax remaining after the knockdown (Fig. 1), or from the pro-apoptotic activity of Bak, another protein capable of promoting loss of cytochrome c from mitochondria. In view of data shown in Fig. 2, we conclude that Bax is mainly responsible for apoptosis after loss of Bcl-2 function.
Fig. 2.
Apoptotic response to 60 min incubations in increasing concentrations of HA14-1 in L1210 (A, C, E, G) and L1210/Bax− (B, D, F, H). (A), (B) = controls; (C), (D) = 20 µM; (E), (F) = 30 µM; (G), (H) = 50 µM. Cells with condensed chromatin were identified by fluorescence microscopy using HO33342 as the probe. White bar in panel (H) = 10 µm.
Fig. 3.
Initiation of DEVDase activity in L1210 vs. L1210/Bax cells. DEVDase activity was measured after incubations with specified levels of HA14-1 for 60 min. Inset: time course of DEVDase activation after incubation with a 30 µM drug level. Data show mean ±SD for 3 determinations.
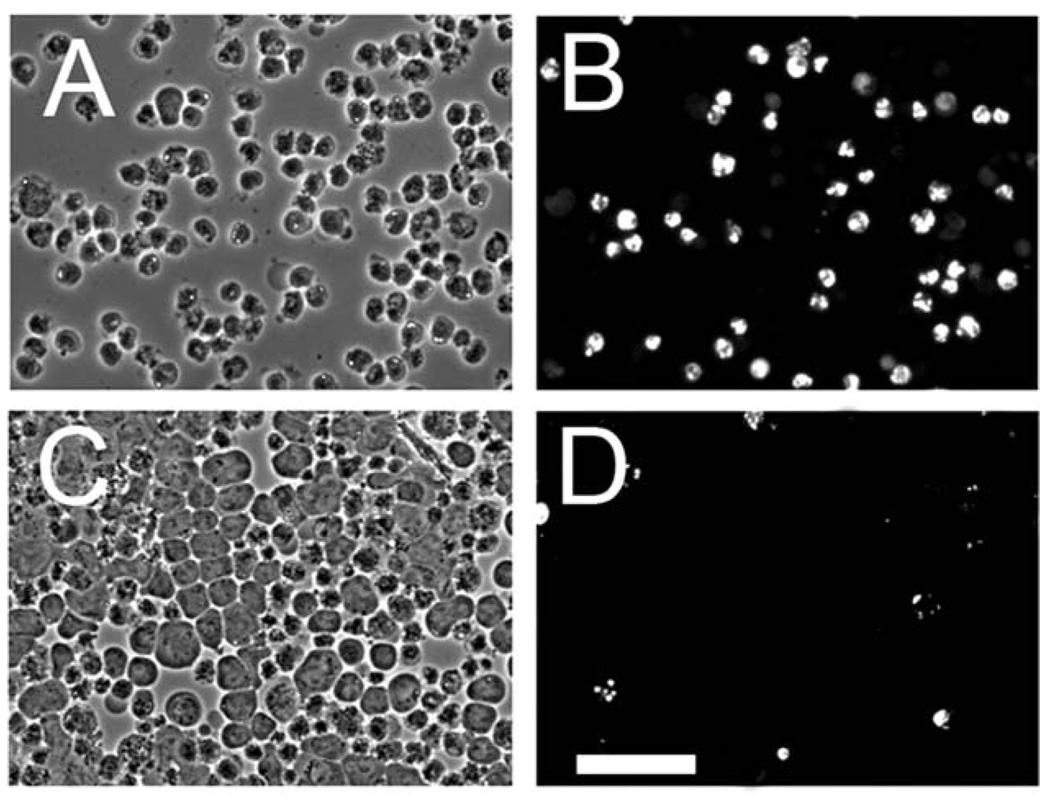
Another study was carried out to assess the level of apoptosis that occurs 60 min after treating L1210 or L1210/Bax− cells with an LD90 PDT dose with CPO. Labeling with HO33342 revealed that there were a substantial number of L1210 cells with condensed chromatin but a much smaller population of apoptotic L1210/Bax− cells (Fig. 4). The Bax knockdown clearly has a marked effect on the apoptotic response to ER/Bcl-2 photodamage. An analysis of relative numbers of apoptotic cells (Table 2) is provided to supplement the information shown in Fig. 2 and Fig. 4
Fig. 4.
Apoptotic response to PDT 60 min after exposure to an LD90 dose of the ER sensitizer CPO. (A), (C) = phase contrast; (B), (D) = HO33342 fluorescence. (A), (B) = L1210 cells; (C), (D) = L1210/Bax−.White bar in panel (D) = 40 µm.
Table 2.
Relative numbers of apoptotic nuclei after PDT or treatment with HA14-1
| Treatment | L1210 | L1210/Bax− |
|---|---|---|
| Controls | 2 ± 1 | <1 |
| HA14-1 20 uMa | 9 ± 2 | <1 |
| HA14-1 30 uM | 45 ± 5 | <1 |
| HA14-1 40 uM | 95 ± 3 | 45 ± 3 |
| PDT (LD90)b | 86 ± 4 | 5 ± 1 |
Cells were treated with specified levels of HA14-1 for 60 min at 37 °C with HO33342 added during the last 5 min. Numbers of apoptotic nuclei were determined by counting three fields of 100 cells each.
Cells were given an LD90 PDT dose using CPO, incubated for an additional 60 min with numbers of apoptotic nuclei determined as described above.
Apoptotic and cytotoxic response to PDT
The effect of three graded light doses on DEVDase activity and subsequent viability of L1210 and the knockdown cell lines are shown in Table 1. All three cell lines were equally responsive to high-dose photodamage, indicating that the impaired apoptosis in L1210/Bax−, and the impaired autophagy in L1210/Atg7− do not affect the level of photokilling. In a previous report,16 we demonstrated that silencing Atg7, a gene central to autophagy, promoted the toxicity of low levels of ER photodamage. These data appear in Table 1, and are consistent with the proposal that the pro-survival properties of autophagy may be responsible for the ‘shoulder’ on the PDT dose–response curve for PDT. This effect can be observed by comparing the efficacy of a 35 mJ cm−2 light dose on the three cell lines. Only in the L1210/Atg7− was there a detectable protection from phototoxicity. The responsiveness of the Bax knockdown is consistent with reports by Oleinick’s group showing that absence of Bax, or of procaspase-3, did not protect cells from phototoxic effects of PDT using the phthalocyanine photosensitizer Pc 4.3–6
Table 1.
Viability studies and DEVDase activity after PDT using CPO as the photosensitiza
| L1210 | L1210/Atg7− | L1210/Bax− | ||||
|---|---|---|---|---|---|---|
| Light dose/mJ cm−2 | Viability | DEVDase | Viability | DEVDase | Viability | DEVDase |
| 0 | 100 | 0.15 ± 0.03 | 100 | 0.23 ± 0.04 | 100 | 0.11 ± 0.03 |
| 35 | 94 ± 2 | 1.3 ± 0.06 | 80 ± 2 | 2.6 ± 0.42 | 95 ± 3 | 0.19 ± 0.04 |
| 70 | 42 ± 4 | 3.9 ± 0.11 | 34 ± 3 | 4.4 ± 0.96 | 40 ± 5 | 0.38 ± 0.09 |
| 135 | 11 ± 3 | 7.2 ± 0.56 | 13 ± 4 | 7.0 ± 1.3 | 15 ± 2 | 0.83 ± 0.06 |
DEVDase levels (nmol/mg protein/mg protein) was measured 20 min after irradiation; viability was determined by clonogenic assays.
Time sequence of autophagy and apoptosis
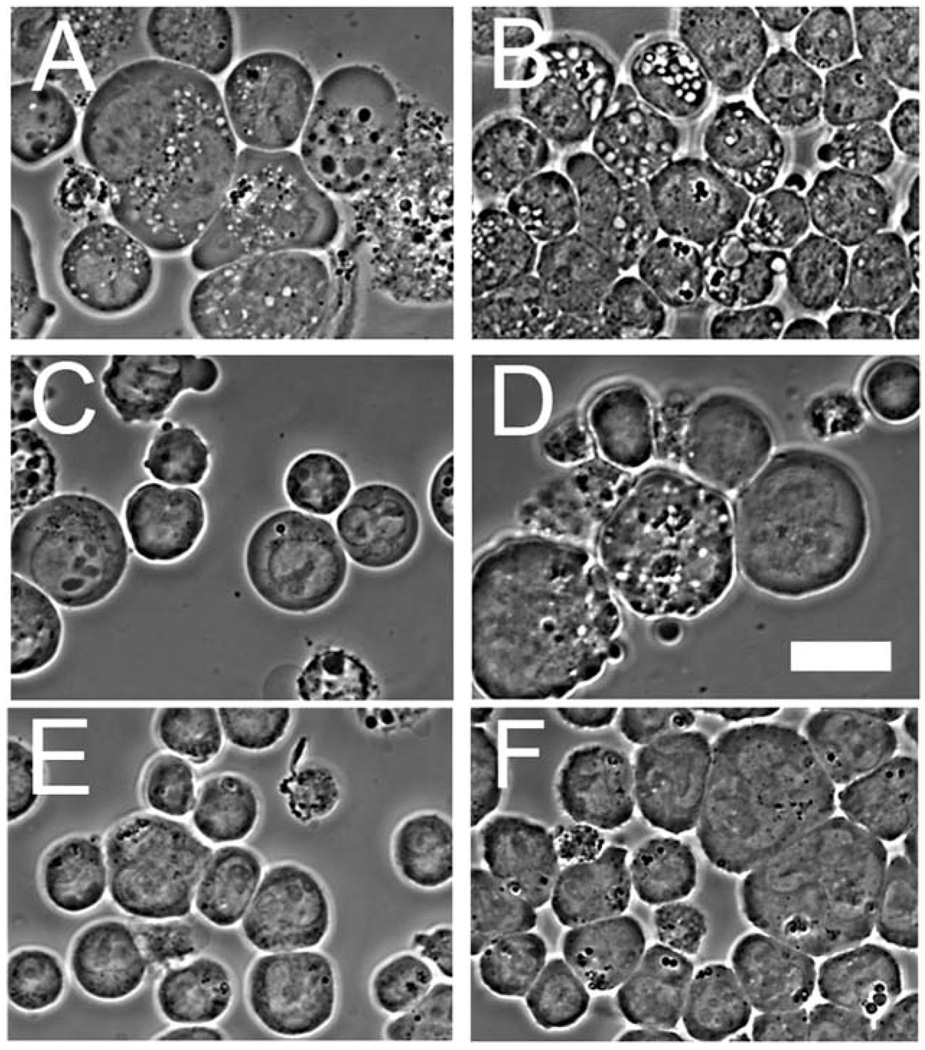
A typical result after exposure of L1210 cells to an LD90 PDT dose of CPO is shown in Fig. 5. An initial wave of autophagy (Fig. 5(B)), likely associated with the recycling of photodamaged ER, is followed by an apoptotic response (Fig. 5(C), (D)). Apoptosis continued to develop over the next few hours. After 24 h, the remaining cells contain both survivors (impermeable to propidium iodide) and permeable cells that contained large numbers of autophagic vacuoles (Fig. 5(E), (F)). We interpret this result to indicate that a portion of the cell population undergoes ‘excessive’ autophagy in an attempt to recover from photodamage. This process eventually becomes irreversible, leading to loss of permeability barriers, an effect indicative of loss of viability. In contrast, the L1210/Bax cell line showed a greater early autophagic response to treatment with HA14-1 (Fig. 6, compare (A) with (B)) and to photodamage (Fig 6 (C), (D)).
Fig. 5.
Time course of apoptosis and autophagy after an LD90 PDT dose (CPO) to L1210 cells. (A) = controls, (B) = 15 min after irradiation, (C) = after 60 min, (D) = after 4 h, (E) = after 24 h; (F) = same field as in (E), showing propidium iodide labeling as determined by fluorescence microscopy. White bar in panel (F) = 10 µm.
Fig. 6.
Phase-contrast images showing development of autophagic vacuoles. (A) = wild-type L1210 cells 15 min after exposure to HA14-1 (30 µM); (B) = L1210/Bax− under similar conditions; (C) = L1210 cells 30 min after an LD90 PDT dose with CPO; (D) = L1210/Bax− under similar conditions; (E)=control L1210; (F)=control L1210/Bax−.White bar in panel (D) = 10 µm.
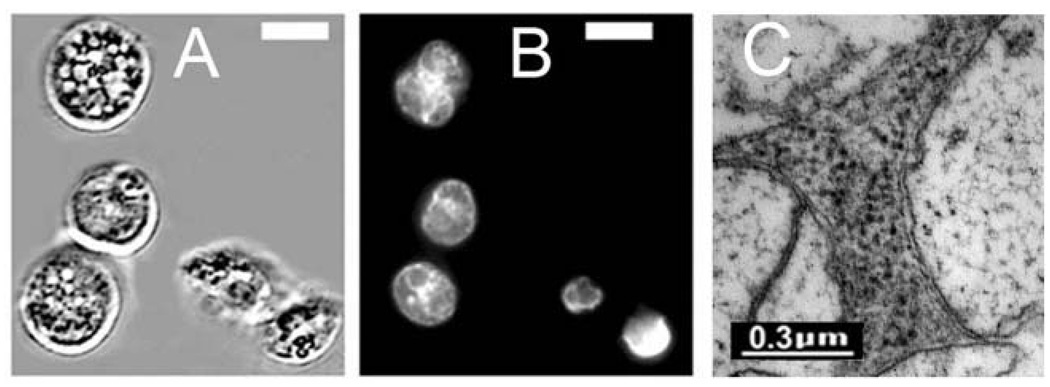
An examination of L1210/Bax− cells showed a somewhat different pattern, with more autophagy predominating after 15 min (Fig. 6(B)). After 24 h, the remaining intact cells were all highly vacuolated (Fig. 7(A)), showed no evidence of chromatin fragmentation,7b and their vacuoles exhibited the double-membrane pattern typical of autophagy.7c
Fig. 7.
(A) = Autophagic vacuole formation in L1210/Bax− cells after an LD90 dose of PDT (CPO); (B) = HO33342 labeling of nuclei showing lack of apoptotic fragmentation; (C) = electron microscopic examination of vacuoles seen in Fig. 5(A) showing the double membrane characteristic of autophagy. White bars in panels (A) and (B) = 10 µm.
Quantitation of autophagy
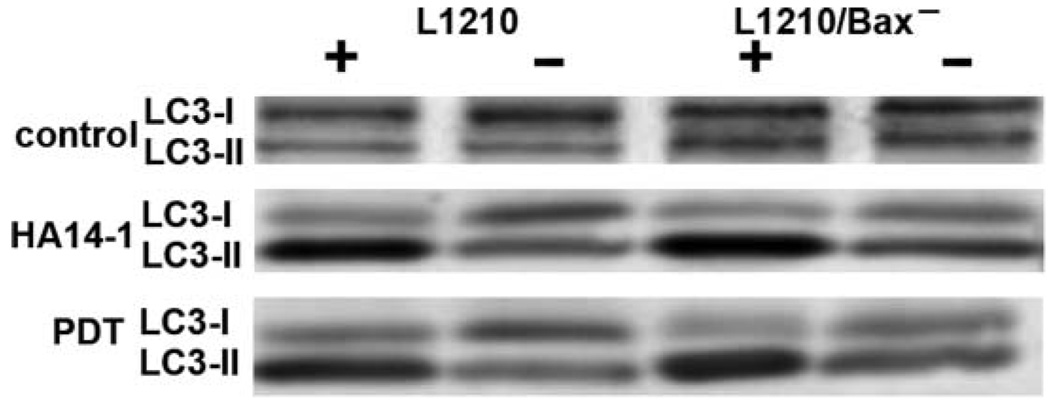
There are few reliable methods currently available for providing a quantitative assessment of the autophagic flux, but one approach involves assessing the concomitant processing of the LC3 protein to a more electrophoretically-mobile form (LC3-II) during the formation of autophagic vacuoles.12,13 Since LC3-II is degraded during the digestion of autophagosomes by lysosomal enzymes, the electrophoretic analysis can be compromised. This degradation can be prevented by incorporation of inhibitors of lysosomal proteases (E64D and acetylpepstatin A) into incubation mixtures. An interpretation of the resulting patterns of LC3 processing has recently been provided.22
We therefore examined LC3 processing by L1210 vs. L1210/Bax− cells after treatment with 30 uM HA14-1 for 30 min, or 15 min after an LD90 PDT dose using CPO (Fig. 8). These conditions correspond to treatments used in the production of Fig. 6. Enhanced formation of LC3-II was observed in the presence of the protease inhibitors in both L1210 and L1210/Bax−, with a greater conversion seen with HA14-1. The loss of the LC3-II signal in the absence of the inhibitors indicates that autophagy can proceed normally when lysosomal protease function is not impaired.
Fig. 8.
LC3 processing in L1210 and L1210/Bax− cells 30 min after treatment with 30 µM HA14-1 or 15 min after exposure to an LD90 PDT dose with CPO. The symbols + and − refer to the presence vs. absence of the lysosomal protease inhibitors E64d and acetylpepstatin A during these protocols.
These results indicate that suppression of apoptosis leads to enhanced autophagy after pharmacologic or photodynamic impairment of Bcl-2 function. Moreover, suppression of apoptosis did not result in protection from loss of viability after PDT. A similar finding was reported by Oleinick’s group4 using the Bax-deficient DU145 cell line. In an HCT116 Bax knockdown line, apoptosis proceeded without caspase-3 activation, but this phenomenon was also observed in wild-type HCT116.5 This is not the case with L1210 cells, where pro-caspase-3 cleavage and DEVDase activation occurs within minutes of photodamage.7
Irradiation of HeLa cells photosensitizer with hypericin was also found to initiate autophagy, but only if both Bax and Bak were silenced.17 We have found that Hela cells undergo apoptosis at a very much slower rate than do L1210 cells, upon exposure to HA14-1 or after ER photodamage (unpublished data). As depicted in Fig. 2 (E) and Fig. 6 (A), apoptosis and autophagy was observed in L1210 cells within 60 and 15 min, respectively. DEVDase activation can be detected within minutes after Bcl-2 impairment (Fig. 3, inset). Unlike HeLa, we show that autophagy can occur when apoptosis is functional, and can serve both to protect cells from low levels of photodamage. A prior report15 also implicated autophagy as a potential cell-death mode when photodamaged cells undergo excess autophagy in an attempt to recover from higher PDT doses.
Conclusions
We previously reported that autophagy occurred in L1210 cells after Bcl-2 inactivation by the small-molecule antagonist HA14-1, or after photodamage directed against Bcl-2 in ER or mitochondria.16,18 Manipulation of the conditions so that apoptosis was suppressed led to enhanced autophagy and vice versa. In this report, we show that a Bax knockdown led to a marked suppression of apoptosis but not of PDT efficacy. An analysis of PDT effects on L1210 cells demonstrated that autophagy appears both early and late in the time-line. The ability of autophagy to offer partial protection from low-dose photodamage16 is consistent with a pro-survival role, but results shown here and elsewhere are suggestive of an autophagic death pathway operative in wild-type cells, and enhanced when apoptosis is impaired. We therefore propose that autophagy with both offer partial protection from low-dose PDT as cells recycle photodamaged organelles, and participate in cell death if apoptosis is impaired or when cells unsuccessfully attempt to recycle past the point of no return. The role of autophagy in clinical PDT remains to be explored. It seems likely that this phenomenon can play a supporting role in protecting a tumor cell population from a sub-optimal PDT dose.
Acknowledgements
These studies were supported by grant CA 23378 from the NIH. Ann Marie Santiago and Nakaiya Okan-Mensah provided excellent technical assistance during the course of this work. We thank Dr James Hatfield, Department of Pathology at the John Dingell VA Hospital, for electron microscopy image acquisition.
Abbreviations
- CPO
9-capronyloxy-tetrakis (methyoxyethyl) porphycene
- DEVD
asp-glu-val-asp
- DEVD-R110
a rhodamine-110 conjugate with asp-glu-val-asp
- ER
endoplasmic reticulum
- KD
knockdown
- PDT
photodynamic therapy
- PI
propidium iodide
- shRNA
short hairpin RNA.
Footnotes
Based on work presented at the 11th World Congress of the International Photodynamic Association in Shanghai, China, March 28–31, 2007.
References
- 1.Dougherty TJ, Gomer CJ, Henderson BW, Jori G, Kessel D, Korbelik M, Moan J, Peng Q. Photodynamic therapy. J. Natl. Cancer Inst. 1998;90:889–905. doi: 10.1093/jnci/90.12.889. [DOI] [PMC free article] [PubMed] [Google Scholar]
- 2.Agarwal ML, EL Clay M, Harvey EJ, Evans HH, Antunez AR, Oleinick NL. Photodynamic therapy induces rapid cell death by apoptosis in L5178Y mouse lymphoma cells. Cancer Res. 1991;51:5993–5996. [PubMed] [Google Scholar]
- 3.Whitacre CM, Satoh TH, Xue L, Gordon NH, Oleinick NL. Photodynamic therapy of human breast cancer xenografts lacking caspase-3. Cancer Lett. 2002;179:43–49. doi: 10.1016/s0304-3835(01)00853-9. [DOI] [PubMed] [Google Scholar]
- 4.Chiu SM, Xue LY, Usuda J, Azizuddin K, Oleinick NL. Bax is essential for mitochondrion-mediated apoptosis but not for cell death caused by photodynamic therapy. Br. J. Cancer. 2003;89:1590–1597. doi: 10.1038/sj.bjc.6601298. [DOI] [PMC free article] [PubMed] [Google Scholar]
- 5.Chiu SM, Xue LY, Azizuddin K, Oleinick NL. Photodynamic therapy-induced death of HCT 116 cells: Apoptosis with or without Bax expression. Apoptosis. 2005;10:1357–1368. doi: 10.1007/s10495-005-2217-0. [DOI] [PubMed] [Google Scholar]
- 6.Xue LY, Chiu SM, Oleinick NL. Photodynamic therapy-induced death of MCF-7 human breast cancer cells: a role for caspase-3 in the late steps of apoptosis but not for the critical lethal event. Exp. Cell Res. 2001;263:145–155. doi: 10.1006/excr.2000.5108. [DOI] [PubMed] [Google Scholar]
- 7.Kessel D, Luo Y. Photodynamic therapy: a mitochondrial inducer of apoptosis. Cell Death Differ. 1999;6:28–35. doi: 10.1038/sj.cdd.4400446. [DOI] [PubMed] [Google Scholar]
- 8.Kim HR, Kessel D. Enhanced apoptotic response to photodynamic therapy after bcl-2 transfection. Cancer Res. 1999;59:3429–3432. [PMC free article] [PubMed] [Google Scholar]
- 9.Kessel D, Castelli M. Evidence that bcl-2 is the target of three photosensitizers that induce a rapid apoptotic response. Photochem. Photobiol. 2001;74:318–322. doi: 10.1562/0031-8655(2001)074<0318:etbitt>2.0.co;2. [DOI] [PubMed] [Google Scholar]
- 10.Xue LY, Chiu SM, Oleinick NL. Photochemical destruction of the Bcl-2 oncoprotein during photodynamic therapy with the phthalocyanine photosensitizer Pc 4. Oncogene. 2001;20:3420–3427. doi: 10.1038/sj.onc.1204441. [DOI] [PubMed] [Google Scholar]
- 11.Pattingre S, Levine B. Bcl-2 inhibition of autophagy: a new route to cancer? Cancer Res. 2006;66:2885–2888. doi: 10.1158/0008-5472.CAN-05-4412. [DOI] [PubMed] [Google Scholar]
- 12.Gozuacik D, Kimchi A. Autophagy and cell death. Curr. Top. Dev. Biol. 2007;78:217–245. doi: 10.1016/S0070-2153(06)78006-1. [DOI] [PubMed] [Google Scholar]
- 13.Yorimitsu T, Klionsky DJ. Autophagy: molecular machinery for self-eating. Cell Death Differ. 12 Suppl 2:1542–1552. doi: 10.1038/sj.cdd.4401765. [DOI] [PMC free article] [PubMed] [Google Scholar]
- 14.Levine B, Yuan J. Autophagy in cell death: an innocent convict? J. Clin. Invest. 2005;115:2679–2688. doi: 10.1172/JCI26390. [DOI] [PMC free article] [PubMed] [Google Scholar]
- 15.Kessel D, Vicente MG, Reiners JJ., Jr Initiation of apoptosis and autophagy by photodynamic therapy. Lasers Surg. Med. 2006;38:482–488. doi: 10.1002/lsm.20334. [DOI] [PMC free article] [PubMed] [Google Scholar]
- 16.Kessel D, Reiners JJ., Jr Apoptosis and autphagy after mitochondrial or endoplasmic reticulum photodamage. Photochem. Photobiol. doi: 10.1111/j.1751-1097.2007.00088.x. [DOI] [PMC free article] [PubMed] [Google Scholar]
- 17.Buytaert E, Callewaert G, Hendrickx N, Scorrano L, Hartmann D, Missiaen L, Vandenheede JR, Heirman I, Grooten J, Agostinis P. Role of endoplasmic reticulum depletion and multidomain proapoptotic BAX and BAK proteins in shaping cell death after hypericin-mediated photodynamic therapy. FASEB J. 2006;20:756–758. doi: 10.1096/fj.05-4305fje. [DOI] [PubMed] [Google Scholar]
- 18.Kessel D, Reiners JJ., Jr Initiation of apoptosis and autophagy by the Bcl-2 antagonist HA14-1. Cancer Lett. 2007;249:294–299. doi: 10.1016/j.canlet.2006.09.009. [DOI] [PMC free article] [PubMed] [Google Scholar]
- 19.Cai SX, Zhang HZ, Guastella J, Drewe J, Yang W, Weber E. Design and synthesis of rhodamine 110 derivative and caspase-3 substrate for enzyme and cell-based fluorescent assay. Bioorg. Med. Chem. Lett. 2001;11:39–42. doi: 10.1016/s0960-894x(00)00590-4. [DOI] [PubMed] [Google Scholar]
- 20.Wang JL, Liu D, Zhang ZJ, Shan S, Han X, Srinivasula SM, Croce CM, Alnemri ES, Huang Z. Structure based discovery of an organic compound that binds Bcl-2 protein and induces apoptosis of tumor cells. Proc. Natl. Acad. Sci. USA. 2000;97:7124–7129. doi: 10.1073/pnas.97.13.7124. [DOI] [PMC free article] [PubMed] [Google Scholar]
- 21.Kessel D, Reiners JJ, Jr, Hazeldine ST, Polin L, Horwitz JP. The role of Autophagy in the death of L1210 leukemia cells initiated by the new anti-tumor agents XK469 and SH80. Mol. Cancer Ther. 2007;6:370–379. doi: 10.1158/1535-7163.MCT-05-0386. [DOI] [PMC free article] [PubMed] [Google Scholar]
- 22.Mizushima N, Yoshimori T. How to interpret LC3 immuno-blotting. Autophagy. 2007;3:e1–e4. doi: 10.4161/auto.4600. [DOI] [PubMed] [Google Scholar]


