Abstract
Background: The purpose of this study is to evaluate the impact on the health-related quality of life (HRQoL) of sunitinib versus interferon-alpha (IFN-α) treatment in patients with metastatic renal cell carcinoma (mRCC).
Patients and methods: In all, 304 mRCC patients (European cohort) were randomized 1 : 1 to receive sunitinib (50 mg/day for 4 weeks, followed by 2 weeks off) or IFN-α (9 million units s.c. injection three times/week). The following questionnaires were completed (days 1 and 28 per cycle): Functional Assessment of Cancer Therapy-General (FACT-G), the FACT-Kidney Symptom Index and the EuroQol Group's EQ-5D self-report questionnaire (EQ-5D). Results correspond to an ongoing trial with progression-free survival time as primary end point, and patients were still being followed up. Data were analyzed using repeated measures mixed effects models (MEMs) that allow the inclusion of initial differences and uncompleted repeated measures, with the assumption of data missing at random. Six-cycle results were included.
Results: Results consistently showed that patients in sunitinib group experienced statistically significantly milder kidney-related symptoms, better cancer-specific HRQoL and general health status (in social utility scores) during the study period as measured by these patient-reported outcome end points. No statistical differences between groups were found on the FACT-G physical well-being subscale or the EQ-5D VAS values.
Conclusions: Results from MEM showed the sunitinib's benefit on HRQoL compared with IFN-α.
Keywords: health-related quality of life, interferon-α, patient-reported outcomes, sunitinib
introduction
A patient-reported outcome (PRO) is a measurement of any aspect of a patient's health status that comes directly from the patient. The importance of evaluating PROs in clinical trials is based on the possibility that some treatment effects are known only to the patient; clinician reports of treatment effectiveness may not reflect the patient's perspective; or aspects of the patient's perspective may be lost if his/her response is filtered through a clinician interview. PRO measurements are particularly important in clinical trials in which two treatments with similar efficacy may have different safety profiles that have an impact on patients’ symptoms, functioning, or health-related quality of life (HRQoL). PROs therefore complement and extend information provided by clinical end points on the efficacy and side-effects of treatment [1].
A phase III, randomized study was conducted to compare the efficacy and safety as well as PROs for sunitinib versus interferon-alpha (IFN-α) as first-line systemic therapy for patients with metastatic renal cell carcinoma (mRCC) [2]. The present study summarizes the PRO (kidney-related symptoms, cancer-specific HRQoL, and general health status) reported for the European patients at the moment of the interim analysis of this study.
mRCC treatment is intended to delay disease progression, prolong survival, and improve HRQoL. The symptoms, various sites of metastases, and generally poor prognosis associated with mRCC may negatively affect HRQoL and specific aspects such as physical functioning, energy/fatigue level, mental status, sexual functioning, and perceived well-being [3]. Treatment side-effects may also affect patient HRQoL. In considering drugs for metastatic diseases, improved PROs even in the absence of impact on survival (relative to standard care) may be considered in regulatory approval decisions [4].
The immediate effect of treatment is on symptoms. Moving further along the continuum, social/psychological and other non-medical factors such as personality, motivation, attitude, individual preferences, and family support affect HRQoL and functional outcomes, so that even patients who experience symptom reduction may not demonstrate a commensurate improvement in HRQoL. For these reasons, we assessed the effect of treatment on more proximal symptom outcomes separately from the effect on more distal HRQoL outcomes.
patients and methods
The PRO instruments used in this study were (i) designed to measure either general cancer-specific or kidney cancer-specific outcomes, (ii) developed and validated in relevant populations, and (iii) studied and reported in the peer-reviewed literature [5].
Table 1 presents a summary of the PRO instruments used in this study [6–9]. The Functional Assessment of Cancer Therapy–Kidney Symptom Index–Disease-Related Symptoms (FKSI-DRS) scale was prespecified in the trial's protocol as the primary PRO end point. We hypothesized that sunitinib would show a more positive impact than IFN-α on patients’ symptom experience. In addition, we used the FKSI, the parent instrument of the FKSI-DRS, to measure the impact of treatment on both disease- and treatment-related symptoms and the Functional Assessment of Cancer Therapy-General (FACT-G) to measure the impact of treatment on general cancer-related HRQoL and functioning. Although the EuroQol Group's EQ-5D self-report questionnaire (EQ-5D) was also included in this trial primarily for the estimation of quality-adjusted life years in economic analysis, those results are also reported here as the EQ-5D is a generic HRQoL instrument. All instruments were used in their pertinent cultural adapted version.
Table 1.
Summary of the PRO instruments used in the study
| FKSI | FKSI-DRS | FACT-G | EQ-5D | |
| Objective | Assesses disease-related and treatment-related symptoms in patients with advanced kidney cancer | Assesses disease-related symptoms in patients with advanced kidney cancer | Assesses health-related quality of life for people with cancer. Provides multidimensional, generic measure of well-being and functioning for patients with cancer of any type | Assesses general health status with a simple descriptive profile and a single index value that can be used in the clinical and economic evaluation of health care and population surveys |
| Domains | N/A | N/A (subscale of FKSI) | PWB; SWB; EWB; FWB | Mobility, self-care, usual activity, pain/discomfort, and anxiety/depression |
| Number of items | 15 | 9 | 27 items (34 items in version 4) with five-point Likert scale | 5 (see above) + 1 visual analogue scale thermometer that provides a rating of health from 0 (worst imaginable health state) to 100 (best imaginable health state) |
| Psychometric properties | High internal consistency: Cronbach's α 0.84–0.88; high intraclass correlation (test–retest reliability): 0.90; convergent validity: with FACT-G and FACT-G subscales; discriminant validity: ECOG-PSR; responsiveness to change: GRCS (gender role conflict scale); MID: 3–5 points | High internal consistency: Cronbach's α 0.78; high intraclass correlation (test–retest reliability): 0.85; strong convergent and discriminant validity and responsiveness to change that are similar to those of the FKSI; MID: 2–3 points | High internal consistency: Cronbach's α 0.75–0.92; high test-retest correlation coefficient: 0.82–0.92; concurrent validity: correlation with FLIC (r = 0.79) and QLI (r = 0.74). Construct validity: correlation with mood state: (r = 0.57–0.69); activity level (r = −0.56); social desirability (r = 0.22). Correlation is 0.86 with the FLIC scale, 0.45–0.60 with profile of mood states and also correlated with ECOG-PSR rating; MID: N/A | Test–retest reliability: 0.86–0.90; evidence of construct and discriminant validity. Evidence of concurrent validity with related measures: correlations with health assessment questionnaire (r = 0.46–0.76) and SF-36 (r = 0.52–0.64); MID: N/A |
| Mode | Self-administered (telephone interview) | Self-administered (telephone interview) | Self-administered (telephone interview) | Self-administered, observer, proxy, and telephone |
| Time (minutes) | <10 min | <10 min | 5–10 min | <5 min |
| Languages | English, Chinese, Dutch, French, and 15 other languages | English, Chinese, Dutch, French, and 15 other languages | English, French, Spanish, Koran, and plus 51 other languages | 60 official translations including English, and languages for South Africa, Asia, Europe, Latin America, the Middle East, and Scandinavia |
| Time frame | Past 7 days | Past 7 days | Past 1 week | Current |
PRO, patient-reported outcome; FKSI-DRS, Functional Assessment of Cancer Therapy–Kidney Symptom Index–Disease-Related Symptoms; FACT-G, Functional Assessment of Cancer Therapy-General; EQ-5D, EQ-5D self-report questionnaire; PWB, physical well-being; SWB, social/family well-being; EWB, emotional well-being; FWB, functional well-being; ECOG-PSR: Eastern Cooperative Oncology Group-Performance Status Rating; FLIC, Functional Living Index—Cancer; GRCS, Global Rating of Change Scale; HAQ, health assessment questionnaire; MID, minimal important difference; N/A, not available.
The overall objective of PRO assessment in this study was to compare PROs between the two treatment arms. Specifically, the PRO assessment was to compare the effects of sunitinib and IFN-α throughout the course of treatment on patient self-reports of (i) kidney cancer-specific symptoms; (ii) cancer-specific HRQoL and well-being/functioning in related fundamental domains; and (iii) societal and patient values (utilities) for patient-perceived health status.
relationship between PRO measures
Although all PROs included in this study were designed to measure outcomes of kidney cancer, each of the instruments measures outcomes at different points along the outcomes continuum. Correlation coefficients across the PRO end point scores as baseline were calculated to explore the relationships between the symptoms, cancer-specific HRQoL, functioning and well-being, and overall HRQoL.
study sample, treatments, and clinical assessments
The target population is composed of patients >18 years old, living in an European country with mRCC who had not previously been treated with systemic therapy.
A sample of 304 patients was recruited at random in France, Germany, Italy, Poland, Spain, and United Kingdom. Patients were 18 years old or older, presented mRCC, who had not previously been treated with systemic therapy, and had evidence of measurable disease and an Eastern Cooperative Oncology Group [10] performance status of zero or one. Patients were randomized to receive either sunitinib or IFN-α in repeated 6-week cycles. Sunitinib was administered as an oral capsule at 50 mg daily for 4 weeks followed by 2 weeks of treatment in repeated 6-week cycles of treatment. IFN-α was administered as a s.c. injection in 6-week cycles on three nonconsecutive days per week. Subjects in the IFN-α group received three million units (MU) per dose during the first week, 6 MU per dose the second week, and 9 MU per dose thereafter. Dose modifications were allowed for toxicity management on both treatments.
Initially, the intention-to-treat sample was used for analysis of PRO end points, which included all subjects who were randomized, with treatment assignment designated according to initial randomization, regardless of whether subjects received study treatment or a drug different from the one to which they were randomized.
Statistical analyses were carried out after 97 survivors (33% of recruited patients) had reached the sixth treatment cycle follow-up. At that time, 93 patients had terminated treatment because of the lack of efficacy (31%) and 105 (36%) were still at a previous follow-up stage.
PRO assessments
PROs were measured at the screening visit before randomization, throughout the treatment period, and at the end of treatment or patient withdrawal from the study. During the treatment period, subjects were asked to complete the questionnaires during their visits on days 1 and 28 of each 42-day treatment cycle. The assessment on cycle 1 day 1 was administered before the first dose of study medication thus was used as the baseline measurement.
statistical analysis
Questionnaire compliance was defined as a patient having answered at least one question at an assessment time point. Compliance rate at each assessment time point for each questionnaire was calculated as the number of patients who completed at least one question divided by the total number of patients available at that assessment time point.
Scoring of the PRO end points (scales) and missing data were handled according to the questionnaires’ scoring guidelines. If there were missing items, subscale scores were prorated by first multiplying the sum of the subscale by the number of items in the subscale and then dividing by the number of items actually answered. Completion for an instrument was defined as having >80% item responses for the total FACT-G or having >50% item responses for FACT-G subscales, FKSI, and FKSI-DRS. PRO end points with less than the minimum number of items answered were scored as missing. For EQ-5D, the EQ-5D index [11] will be missing, if not all five descriptors were responded. For all PRO end points, a higher score indicated a favourable outcome (less/milder symptoms, better functioning, or QoL). The scale completion rate for a PRO end point at an assessment time point was defined as the number of patients with non-missing scores divided by the number of patients who responded to at least one question of the end point.
Summary statistics of absolute scores of the PRO end points and their changes from baseline were calculated at each assessment time point for the two treatments. The mean (and 95% confidence interval) and median (and interquartile ranges) of the absolute scores and the changes from baseline were reported for the FKSI-DRS, FKSI, FACT-G total and its four subscales [physical well-being (PWB), emotional well-being (EWB), social well-being (SWB), and functional well-being (FWB)], EQ-5D index, and EQ-visual analog scale (VAS).
Repeated measures mixed-effects models (MEMs) were used to assess the between-treatment differences for all the PRO end points. There are several features that make the MEM attractive and useful for this study. First, subjects with incomplete data across time have been included in the model; therefore, statistical power increases and potential biases from complete case analyses are reduced. Secondly, subjects may not have to be measured at the same time point because time is treated as a continuous variable, thus the follow-up times are not required to be uniform for all subjects. Thirdly, the fact that individual characteristics may change across time due to the treatment are accommodated by this model, and time-varying covariates could be included in the model that allow us to treat QoL in ‘real’ time rather than a specific time point. Fourthly, MEM can also estimate change for each subject, whereas traditional approaches may only estimate average change in a population [12–14].
The following MEM for PRO scores across time is used for this study:
where yik is the PRO score for individual i at time k, Txi equals 0 if individual i is in IFN-α group or 1 if individual i is in sunitinib malate group, and BSi is the baseline score of the PRO instrument. As a result of the dummy coding for the treatment effect, β0 and β2 represent the trend across time for the IFN-α group, while β3 represents a constant difference between treatments at the beginning of the post-baseline period and β4 represents a differential linear trend between treatments. Thus, improved PROs will be demonstrated by an upward trend in each instrument that is a positive value of β2 for IFN-α group and (β2 + β4) for sunitinib malate group. Finally, as postulated, the above model allows individuals to deviate from their group trend pattern in terms of intercept (υ0i) and slope (υ1i).
The intercept and slope term for time are random effects with an assumed unstructured variance–covariance matrix. In addition, we assume that each observation is measured with error and the error terms are independent of each other. A sandwich estimator was used to estimate the variance of the fixed effects terms, including baseline scores, treatment group, and time-by-treatment interaction. For estimation of variance parameters in MEM, restricted/residual maximum likelihood is preferable because the maximum likelihood (ML) estimation treats coefficients as known (instead, they are estimated from data), underestimates variances, and makes the estimates biased downward (i.e. they are too small in absolute value) [13]. Thus, all parameter estimates were obtained using restricted ML estimation.
The estimated parameters of the repeated measures MEM were used to compute the predicted values of the PRO instruments for each day in each cycle. In addition, we calculated the least squares means (LSMs) over the first nine cycles for each PRO measure. The LSM provides an estimate of the predicted means that have been corrected for unbalanced structure of the data. In other words, the LSM provides an estimate of the marginal means over a balanced population. The LSMs were computed over the first nine cycles because this provides the maximum duration of PRO data by the time of the data cutoff date. The repeated measures MEM assumed that the missing data mechanism is ignorable (i.e. missing at random).
All the data were analyzed using the SPSS 15.0 (SPSS Inc, Chicago, IL). Tests of statistical significance used a two-sided alpha 0.05.
results
description of the sample
One hundred forty-seven subjects (48%) were randomized to sunitinib malate, and 157 (52%) were randomized to IFN-α. No subjects (0.0%) on sunitinib versus four subjects (1%) on IFN-α withdrew consent and discontinued the study before receiving their first dose of study medication. The maximum number of cycles started as of the cutoff date was 11 on sunitinib versus 10 on IFN-α. At the time of the data cutoff for the interim analysis, 11 (7.5% intention to treat (ITT) population) versus seven subjects (4.5% ITT population) on sunitinib versus IFN-α, respectively, were ongoing on study. Forty-one (27.9%) versus 91 subjects (58.0%), respectively, had discontinued treatment, and the primary reasons for discontinuation were lack of efficacy/disease progression [29 (19.7% ITT population) versus 67 subjects (42.7%)] and adverse events [10 (7.8%) versus 17 subjects (10.8%)]; in addition, one (0.7%) versus six (3.8%) subjects had withdrawn consent (including subjects who discontinued the study before receiving their first dose of study medication).
Demographic and baseline characteristics for the two groups are summarized in Table 2. There were no significant differences between treatment groups in the baseline characteristics of the patients.
Table 2.
Summary of demographic and baseline characteristics
| Variable | Sunitinib (n = 147) | IFN-α (n = 153) |
| Age (year), mean ± SD | 61.0 ± 10.9 | 60.0 ± 9.5 |
| Male, n (%) | 94 (63.9) | 124 (81.0) |
| Race, n (%) | ||
| White | 145 (98.6) | 148 (96.7) |
| Black | 1 (0.7) | 2 (1.3) |
| Asian | 1 (0.7) | 1 (0.7) |
| Others | 0 (0.0) | 2 (1.3) |
| Country, n (%) | ||
| France | 40 (27.2) | 42 (27.5) |
| Germany | 8 (5.4) | 7 (4.6) |
| Italy | 8 (5.4) | 16 (10.5) |
| Poland | 54 (36.7) | 48 (31.4) |
| Russian Federation | 12 (8.2) | 17 (11.1) |
| Spain | 15 (10.2) | 12 (7.8) |
| United Kingdom | 10 (6.8) | 11 (7.2) |
| Weight (kg), mean ± SD | 76.8 ± 15.6 | 79.0 ± 15.6 |
| ECOG performance status, n (%) | ||
| 0 | 84 (57.1) | 84 (54.9) |
| 1 | 63 (42.9) | 66 (43.1) |
| 2a | 0 (0.0) | 3 (2.0) |
| Previous nephrectomy (%) | 89 | 89 |
| Previous radiation therapy (%) | 15 | 13 |
| No. of sites of metastases 1/2/≥3 (%) | 18/26/57 | 24/29/49 |
All subjects had ECOG performance status of zero or one at the time eligibility was determined; three subjects in the IFN-α group had ECOG performance status of two on the day of starting the study treatment.
IFN-α, interferon-alpha; ECOG, Eastern Cooperative Oncology Group; SD, standard deviation.
PRO instruments compliance and completion
During the study period, the compliance rates were >94% for both groups for all the PRO instruments at baseline. Table 3 shows the questionnaire compliance rates by assessment time point for the FACT-G/FKSI and EQ-5D. After cycle 6 <10% of the subjects remain in the study, suggesting that average PRO scores after this period could be unreliable.
Table 3.
Number and percentage of compliant subjects by questionnaire and assessment period
| FACT-G |
FKSI |
EQ-5D |
||||
| n | % | n | % | n | % | |
| Baseline | 286 | 94.1 | 291 | 95.7 | 293 | 96.4 |
| Cycle 1, day 28 | 274 | 90.1 | 276 | 90.8 | 273 | 89.8 |
| Cycle 2, day 1 | 260 | 85.5 | 260 | 85.5 | 262 | 86.2 |
| Cycle 2, day 28 | 227 | 74.7 | 227 | 74.7 | 221 | 72.7 |
| Cycle 3, day 1 | 203 | 66.8 | 204 | 67.1 | 204 | 67.1 |
| Cycle 3, day 28 | 187 | 61.5 | 188 | 61.8 | 187 | 61.5 |
| Cycle 4, day 1 | 160 | 52.6 | 162 | 53.3 | 164 | 53.9 |
| Cycle 4, day 28 | 120 | 39.5 | 121 | 39.8 | 118 | 38.8 |
| Cycle 5, day 1 | 103 | 33.9 | 106 | 34.9 | 105 | 34.5 |
| Cycle 5, day 28 | 71 | 23.4 | 73 | 24.0 | 70 | 23.0 |
| Cycle 6, day 1 | 58 | 19.1 | 58 | 19.1 | 60 | 19.7 |
| Cycle 6, day 28 | 42 | 13.8 | 42 | 13.8 | 42 | 13.8 |
| Cycle 7, day 1 | 22 | 7.2 | 23 | 7.6 | 23 | 7.6 |
| Cycle 7, day 28 | 17 | 5.6 | 17 | 5.6 | 17 | 5.6 |
| Cycle 8, day 1 | 11 | 3.6 | 11 | 3.6 | 11 | 3.6 |
| Cycle 8, day 28 | 2 | 0.7 | 2 | 0.7 | 2 | 0.7 |
| Cycle 9, day 1 | 1 | 0.3 | 1 | 0.3 | 1 | 0.3 |
FACT-G, Functional Assessment of Cancer Therapy-General; FKSI, Functional Assessment of Cancer Therapy–Kidney Symptom Index; EQ-5D, EQ-5D self-report questionnaire.
For the FACT-G, 40 (1.9%) interleaved measurements of the total of 2147 sequential measurements were missing, corresponding to 47 (15.5%) of the 304 subjects; for the FKSI, 29 (1.4%) interleaved measurements were missing, corresponding to 25 (8.2.1%) subjects; for the EQ-5D, 58 (2.7%) interleaved measurements were missing, corresponding to 43 (14.1%) subjects.
Among the compliant subjects, the completion rate for the FKSI-DRS, FSKI, and FACT-G at each assessment period ranged between 94.2% and 100% for measurements corresponding to the first six cycles and between 82.1% and 100% for the remaining measurements; for the EQ-5D, the rate ranged between 93.8% and 100% for measurements corresponding to the first six cycles and between 82.1% and 100% for the remaining measurements.
relationship among PRO instruments
Table 4 displays the correlation coefficients of the PRO end points at baseline. As expected, we find that the correlations between the FKSI and the FKSI-DRS, the FKSI/FKSI-DRS, and the physical domains of the FACT-G (PWB and FWB) are higher than the correlations between the FKSI/FKSI-DRS and the nonphysical domains of the FACT-G (EWB and SWB). The total FKSI score is highly correlated with the total FACT-G as reflected by the functional, emotional, and symptom items in the FKSI. The FKSI-DRS is less highly correlated with the FACT-G as reflected by the symptom focus of the FKSI-DRS. The EQ-5D and the EQ-VAS are moderately correlated with each other reflecting the fact that the EQ-5D measures community preferences and the EQ-VAS measures personal preferences. Both the EQ-5D and the EQ-VAS are more strongly correlated with the total FKSI, FKSI-DRS, and FACT-G scores than with each other.
Table 4.
Correlation matrix of PRO measures at baseline for all patients in the study
| FKSI-DRS | FKSI | Total FACT-G | FACT-G PWB | FACT-G SWB | FACT-G EWB | FACT-G FWB | EQ-5D index | EQ-VAS | |
| FKSI-DRS | 1.000 (291) | 0.927 (290) | 0.682 (284) | 0.844 (286) | 0.094a (288) | 0.421 (287) | 0.523 (289) | 0.655 (285) | 0.563 (286) |
| FKSI | 0.927 (290) | 1.000 (290) | 0.837 (285) | 0.852 (287) | 0.210 (289) | 0.535 (288) | 0.735 (290) | 0.685 (286) | 0.650 (287) |
| Total FACT-G | 0.682 (284) | 0.837 (285) | 1.000 (286) | 0.768 (286) | 0.527 (286) | 0.675 (285) | 0.869 (286) | 0.626 (282) | 0.612 (282) |
| FACT-G PWB | 0.844 (286) | 0.852 (287) | 0.768 (286) | 1.000 (289) | 0.093a (289) | 0.446 (285) | 0.585 (287) | 0.721 (285) | 0.591 (285) |
| FACT-G SWB | 0.094a (288) | 0.210 (289) | 0.527 (286) | 0.093a (289) | 1.000 (291) | 0.076a (287) | 0.433 (289) | 0.066a (287) | 0.184 (287) |
| FACT-G EWB | 0.421 (287) | 0.535 (288) | 0.675 (285) | 0.446 (285) | 0.076a (287) | 1.000 (289) | 0.418 (289) | 0.370 (284) | 0.288 (285) |
| FACT-G FWB | 0.523 (289) | 0.735 (290) | 0.869 (286) | 0.585 (287) | 0.433 (289) | 0.418 (289) | 1.000 (291) | 0.580 (286) | 0.619 (287) |
| EQ-5D index | 0.655 (285) | 0.685 (286) | 0.626 (282) | 0.721 (285) | 0.066a (287) | 0.370 (284) | 0.580 (286) | 1.000 (729) | 0.490 (289) |
| EQ-VAS | 0.563 (286) | 0.650 (287) | 0.612 (282) | 0.591 (285) | 0.184 (287) | 0.288 (285) | 0.619 (287) | 0.490 (289) | 1.000 (294) |
Numbers in parentheses indicate number of observations.
P value for all coefficients <0.002, except those marked.
PRO, patient-reported outcome; FKSI-DRS, Functional Assessment of Cancer Therapy–Kidney Symptom Index–Disease-Related Symptoms; FACT-G, Functional Assessment of Cancer Therapy-General; EQ-5D, EQ-5D self-report questionnaire; PWB, physical well-being; SWB, social well-being; EWB, emotional well-being; FWB, functional well-being.
descriptive statistics of PRO end points
There were small but not statistically significant differences in the baseline scores in all the nine PRO end points (Table 5). To adjust for the potential impacts of such differences on the treatment effects, the baseline scores were included in the repeated measures MEMs for all PRO end points.
Table 5.
Summary of baseline mean scores (SD) in the PRO end points by treatment
| Treatment | FKSI-DRS | FKSI | FACT-G | FACT-PWB | FACT-SWB | FACT-EWB | FACT-FWB | EQ-5D Index | EQ-VAS |
| Sunitinib malate | 28.35 (5.82) | 43.53 (8.71) | 75.96 (14.47) | 21.48 (5.78) | 21.56 (4.49) | 15.76 (4.86) | 17.26 (5.52) | 0.72 (0.24) | 68.57 (18.39) |
| IFN-α | 29.17 (4.81) | 44.41 (8.00) | 75.59 (15.03) | 21.85 (5.25) | 21.19 (4.55) | 16.04 (4.61) | 16.57 (5.69) | 0.74 (0.25) | 65.95 (19.32) |
| Difference (sunitinib − IFN-α) | −0.82 | −0.88 | 0.37 | −0.37 | 0.36 | −0.29 | 0.68 | −0.02 | 2.63 |
| P value for difference | 0.19 | 0.37 | 0.83 | 0.57 | 0.49 | 0.61 | 0.30 | 0.41 | 0.23 |
SD, standard deviation; PRO, patient-reported outcome; FKSI-DRS, Functional Assessment of Cancer Therapy–Kidney Symptom Index–Disease-Related Symptoms; FACT-G, Functional Assessment of Cancer Therapy-General; EQ-5D, EQ-5D self-report questionnaire; PWB, physical well-being; SWB, social well-being; EWB, emotional well-being; FWB, functional well-being; IFN-α, interferon-alpha.
results from the repeated measures MEM
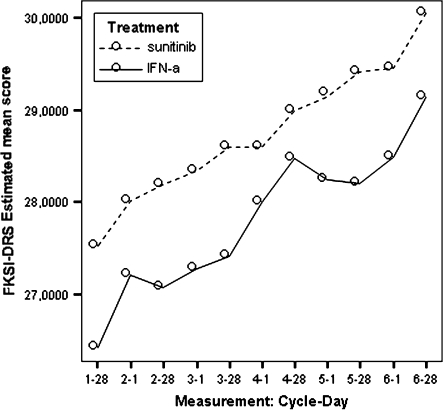
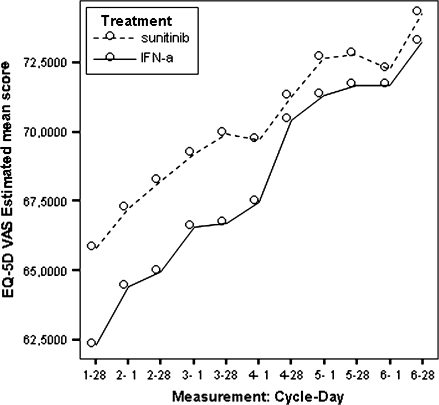
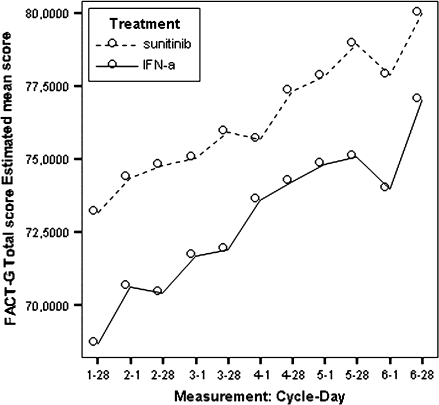
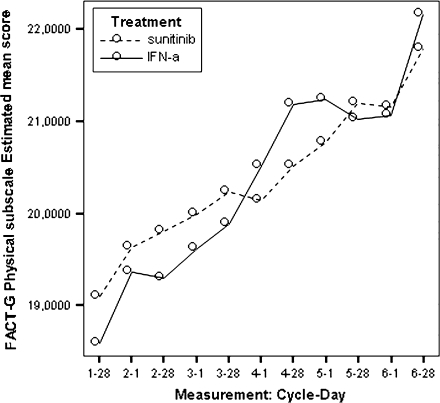
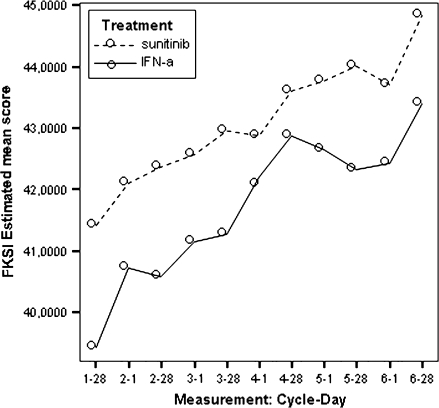
The estimated scores for the two treatment arms and the between-treatment differences for all the PROs, using the repeated measures MEMs, are presented in Figures 1–9. Due to the reduction in the effective sample size and hence in the derived problems in the estimation process, only data for cycles from one to six were considered in the MEMs.
Figure 1.
Model-estimated Functional Assessment of Cancer Therapy–Kidney Symptom Index–Disease-Related Symptoms scores by treatment.
Figure 9.
Model estimated EQ-5D VAS scores by treatment.
Figure 3.
Model estimated Functional Assessment of Cancer Therapy-General total scores by treatment.
Figure 4.
Model estimated Functional Assessment of Cancer Therapy-General physical well-being scores by treatment.
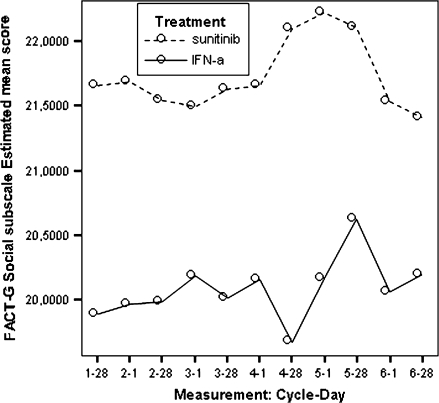
Figure 5.
Model estimated Functional Assessment of Cancer Therapy-General social/family well-being scores by treatment.
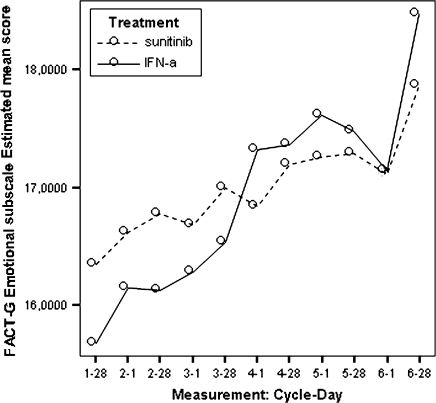
Figure 6.
Model estimated Functional Assessment of Cancer Therapy-General emotional well-being scores by treatment.
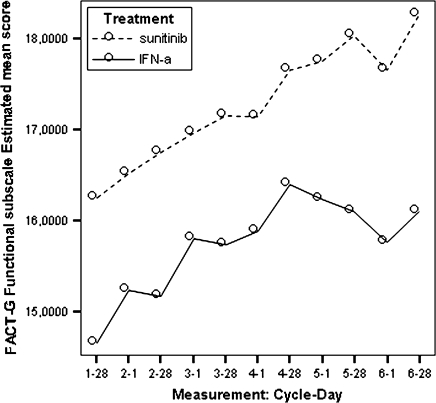
Figure 7.
Model estimated Functional Assessment of Cancer Therapy-General functional well-being scores by treatment.
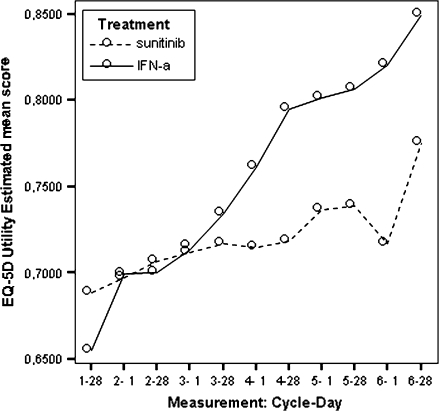
Figure 8.
Model estimated EQ-5D self-report questionnaire utility scores by treatment.
Table 6 presents the parameter estimates from the repeated measures MEMs for all nine PRO end points during the post-baseline period. Using these parameters, we estimated the predicted values of each PRO instrument and the differences in these values between the sunitinib and IFN-α groups (Table 7). In addition, we computed the LSM value for each PRO and present the estimated differences in the LSMs between the sunitinib and IFN-α groups (Tables 7 and 8).
Table 6.
Estimated coefficients and P values from the repeated measures mixed effect model
| Patient reported outcomes |
|||||||||
| FKSI-DRS | FKSI | FACT-G total | FACT-G PWB | FACT-G SWB | FACT-G EWB | FACT-G FWB | EQ-5D index | EQ-VAS | |
| Intercept (β0) | 6.267 (<0.0001) | 6.202 (0.002) | 4.469 (0.166) | 4.010 (<0.0001) | 4.115 (<0.0001) | 3.738 (<0.0001) | 1.984 (0.012) | 0.133 (0.001) | 18.101 (<0.0001) |
| Baseline score (β1) | 0.687 (<0.0001) | 0.743 (<0.0001) | 0.844 (<0.0001) | 0.659 (<0.0001) | 0.745 (<0.0001) | 0.741 (<0.0001) | 0.754 (<0.0001) | 0.691 (<0.0001) | 0.649 (<0.0001) |
| Time (β2) | −0.002 (0.581) | −0.005 (0.272) | −0.010 (0.127) | −0.001 (0.723) | −0.002 (0.544) | 0.0007 (0.712) | −0.006 (0.030) | 0.0002 (0.271) | −0.002 (0.862) |
| Treatment (β3) | 1.752 (<0.0001) | 2.845 (<0.0001) | 4.605 (<0.0001) | 0.787 (0.158) | 1.552 (<0.0001) | 0.895 (0.019) | 1.186 (0.019) | 0.062 (0.022) | 2.771 (0.100) |
| Time × treatment (β4) | 0.007 (0.070) | 0.010 (0.082) | 0.019 (0.030) | 0.006 (0.659) | 0.0004 (0.910) | 0.002 (0.513) | 0.008 (0.022) | −0.0002 (0.514) | 0.019 (0.105) |
FKSI-DRS, Functional Assessment of Cancer Therapy–Kidney Symptom Index–Disease-Related Symptoms; FACT-G, Functional Assessment of Cancer Therapy-General; EQ-5D, EQ-5D self-report questionnaire; PWB, physical well-being; SWB, social well-being; EWB, emotional well-being; FWB, functional well-being.
Table 7.
Comparison of LSMs of PRO end points over the first six cycles
| PRO end points | Sunitinib | Interferon | Difference | P value |
| FKSI-DRS | 28.81 | 26.38 | 2.43 | <0.0001 |
| FKSI | 43.14 | 39.32 | 3.82 | <0.0001 |
| FACT-G total score | 75.71 | 69.27 | 6.44 | <0.0001 |
| FACT-G physical well-being subscale | 20.20 | 18.82 | 1.38 | 0.158 |
| FACT-G social/family well-being subscale | 21.71 | 20.12 | 1.59 | <0.0001 |
| FACT-G emotional well-being subscale | 16.73 | 15.67 | 1.06 | 0.019 |
| FACT-G functional well-being subscale | 16.81 | 14.87 | 1.94 | 0.019 |
| EQ-5D index (utility score) | 0.723 | 0.674 | 0.049 | 0.022 |
| EQ-VAS (health state hermometer score) | 68.10 | 63.45 | 4.65 | 0.100 |
LSMs were estimated using the repeated measures mixed effects model controlling for the time, treatment-by-time interaction and baseline score. A higher score means better outcome (better quality of life or less symptoms).
LSM, least squares mean; PRO, Patient reported outcome; FKSI-DRS, Functional Assessment of Cancer Therapy–Kidney Symptom Index–Disease-Related Symptoms; FACT-G, Functional Assessment of Cancer Therapy-General; EQ-5D, EQ-5D self-report questionnaire.
Table 8.
Item analysis of FKSI-DRS over the cycles (over the first six cycles)
| Items | Least squares means |
||
| Sunitinib | IFN-α | P value | |
| I have a lack of energy | 2.48 | 2.19 | 0.431 |
| I have pain | 2.93 | 2.83 | 0.809 |
| I am losing weight | 3.37 | 3.18 | 0.111 |
| I have bone pain | 3.15 | 2.93 | 0.043 |
| I feel fatigued | 2.47 | 2.19 | 0.010 |
| I have been short of breath | 3.21 | 2.86 | 0.058 |
| I have been coughing | 3.26 | 3.12 | 0.292 |
| I am bothered by fevers | 3.82 | 3.25 | <0.0001 |
| I have had blood in my urine | 3.94 | 3.92 | 0.181 |
FKSI-DRS, Functional Assessment of Cancer Therapy–Kidney Symptom Index–Disease-Related Symptoms; IFN-α, interferon-alpha.
All estimated between-treatment differences over time for all the PRO end points are presented in Table 6 and Figures 2–9 (Note that the baseline time point is not present in these figures.). Differences favouring sunitinib over IFN-α are indicated by values >0. The results show that subjects on sunitinib reported statistically significantly better outcomes on symptoms (P < 0.009) and disease-specific HRQoL (as measured by the total FACT-G overall score, P < 0.003) than IFN-α at all assessment time points. For the functional well-being assessment, all time points were significantly different between treatments (P < 0.038), except for one time point (at cycle 2, day 28, P = 0.061) which was close to significance. A similar pattern was observed for the social well-being scale, which did not attain significance only at one data point (at cycle 6, day 1, P = 0.308). PWB, EWB, and general HRQoL (as measured by the generic EQ-5D) tend to detect significant differences at the beginning of the cycle (day 1) but not always at the end of the cycle (day 28). Finally, social utility values (as measured by the EQ-5D utility function) tend to exhibit less significant differences between treatments, which disappear after a number of time points (cycle 4).
Figure 2.
Model estimated Functional Assessment of Cancer Therapy–Kidney Symptom Index scores by treatment.
FKSI and FKSI-DRS
During the treatment period, FKSI-DRS and FKSI scores exhibited statistically significant patterns favouring the sunitinib group over the IFN-α group. Based on the mean treatment differences at all assessment points, patients in the sunitinib group experienced milder kidney-related symptoms or treatment-related symptoms than those in the IFN-α group during the study period (Table 6).
Additional analyses were also carried out using the MEM for the nine items in the FKSI-DRS, and the results showed that, compared with the IFN-α group, patients on sunitinib demonstrated significantly milder symptoms (higher LSM scores) of bone pain, fatigue, and fevers (Table 8).
These differences were statistically and clinically meaningful. Compared with the pre-established minimally important differences (MID), which are two to three points for FKSI-DRS and three to five points for the FKSI, the treatment differences were considered clinically meaningful after cycle 2 day 1 for the FKSI-DRS and FKSI. The average standardized effect size (SES) was 0.39 for FKSI-DRS (ranging from 0.07 at cycle 1 day 28 to 0.97 at cycle 7 day 1) and 0.28 for FKSI (ranging from −0.02 at cycle 4 day 28 to 0.85 at cycle 7 day 1), which indicates that the treatment effect on kidney-related symptoms and treatment-related symptoms was mild to moderate over the study period based on Cohen's effect size criteria [15].
FACT-G
Based on the mean treatment difference for the FACT-G scores, patients in the sunitinib group experienced statistically better cancer-specific HRQoL compared with patients in the IFN-α group at each time point (Table 6). Patients in the sunitinib group experienced better outcomes based on the social well-being, the emotional well-being, and the functional well-being.
These differences were statistically and clinically meaningful. The FACT-G exceeded the pre-established clinically meaningful difference of five points at all assessment points (see Table 6) after the first cycle. However, the FWB subscale was the only subscale that exceeded its MID of two points (after cycle 3, day 1). The treatment effect on cancer-specific HRQoL was mild to moderate (SES = 0.34, ranging from 0.11 at cycle 3 day 28 to 0.98 at cycle 7 day 28).
EQ-5D
Based on the LSM of EQ-5D index, patients in the sunitinib group reported better general health status than patients in the IFN-α group. Cycle-specific differences were statistically significant at the first day of the cycle, until cycle 5, day 1. The mean treatment differences for the EQ-VAS were statistically significant at most time points, except some of the 28th day data points. Differences between treatment groups decreased over time and exhibited a roughly similar pattern (Figure 10). Although these overall differences were statistically significant, the SES was −0.13 for the EQ-5D index and 0.22 for the EQ-VAS, indicating that the treatment effect on general health status was very small. Surprisingly, the pattern of EQ-5D utility and EQ-VAS LSM predicted scores was very different, with a faster increasing utility in the INF group. This lack of consistency between EQ scores advises to interpret results with care.
discussion
During the past decade, as attention to QoL concerns for cancer patients has grown, the need for validated PRO instruments has also increased [16]. Here, we report the results of a phase III, randomized study of sunitinib versus INF-α as first-line therapy for patients with mRCC using PRO end points. In contrast, previous studies that examined the HRQoL among mRCC patients were either case series [17] or evaluations of other therapeutic options such as surgery [18] or restricted within immunotherapy [19–21].
For this study, PRO instruments appropriate for measuring the relevant concepts were used. The primary PRO end point, the FKSI-DRS, measured kidney cancer-related symptoms, the most proximal domain expected to change. The secondary PRO end points measured treatment and disease-related symptoms (FKSI) and physical, social, emotional, and functional well-being (as measured by the subscales of and the FACT-G total score), more distal but very important outcomes in metastatic cancer patients. General HRQoL was measured using the EQ-5D. Each of these PRO instruments is validated in diverse yet relevant populations and (except for the EQ-5D) have included patient input into virtually all phases of their development, including item selection, scale generation (grouping into domains), and validation.
At each post-baseline assessment time point of the phase III trial, patients receiving sunitinib reported better scores on the primary PRO end point (the FKSI-DRS) compared with the IFN-α group, indicating that those patients who received sunitinib experienced milder symptoms than those who received IFN-α. Differences between the sunitinib and IFN-α groups were statistically significant at each time point and, after the first cycle, the difference exceeded the minimum clinically important difference of two points. Based on effect size criteria suggested by Cohen [15], treatment effect on the kidney-related symptoms was almost moderate over the study period (SES = 0.38). This study also examined how patients responded to individual items within the FKSI-DRS. Results indicate that patients in the sunitinib group experienced statistically significantly milder symptoms of bone pain, fatigue, and fever symptoms. These results are concordant with those reported by Cella et al. [22] on a worldwide study with a longer follow-up from which our data are the European subset. Nevertheless, the slope estimate for the overall model in the European sample is slightly less positive and the treatment difference is slightly larger.
The secondary PRO end points (the FKSI, the FACT-G total score and its four subscales, the EQ-5D index, and the EQ-VAS) also exhibited a similar pattern favouring the sunitinib group over the IFN-α group. Both the FKSI and the FACT-G total score exhibited clinically meaningful differences at all assessment points after the first cycle. Among the FACT-G subscales, only functional well-being exceeded its minimal clinically important difference after cycle 3. The treatment effects on overall cancer-specific HRQoL were mild to moderate, and such effects were found on the PWB, SWB, EWB, and FWB subscales, bit mostly at the first day of the cycle. Similar results for other metastatic cancer treatments have also been reported in other studies [23–25]. Patients in the sunitinib group also exhibited favourable effects as measured by the EQ-5D index and the EQ-VAS compared with patients in the IFN-α group. These results are also similar to those previously reported [22], although the larger sample size in the referred study favours significance. The general pattern for all PRO measures is similar, including the positive slope and negative interaction for the EQ-5D measure. LSMs are slightly lower than those reported previously, but it should be noted that a shorter follow-up was studied here.
Although there are some missing data over time, the overall response rate was >95% across the assessment time points. There were no significant differences in baseline patient characteristics or PRO end points. The use of the MEM reduced the potential for bias resulting from missing data by utilizing all available assessments.
Findings from this longitudinal study provide rich PRO data derived from a variety of reliable and validated PROs that were obtained during a phase III, randomized treatment multinational study. We found that for a number of PRO measures that were assessed in this study, the differences favouring the subjects in the sunitinib group exceeded the minimal clinically important differences. These results are consistent with the hypothesis that sunitinib offers patients with mRCC an effective treatment option that results in milder symptoms, better cancer-related HRQoL, and general health status than IFN-α.
conclusions
Results from this multinational phase III, randomized study indicate that, compared with subjects treated with IFN-α, subjects treated with sunitinib reported less/milder kidney-cancer related symptoms as measured by the FKSI and FKSI-DRS and better cancer-related and general HRQoL as measured by the FACT-G and EQ-5D.
funding
Funding to pay the Open Access publication charges for this article was provided by Pfizer Spain.
Acknowledgments
We thank Dr David Cella of Evanston Northwestern Healthcare and Northwestern University Feinberg School of Medicine, Evanston, IL, and our colleagues in Pfizer Global Outcomes Research, New York (Joseph C. Cappelleri, Andrew Bushmakin, and Claudie Charbonneau), for their invaluable assistance with review of, and statistical analysis for, the data reported in this manuscript.
References
- 1.Food and Drug Administration (FDA) Guidance for Industry. Patient-Reported Outcome Measures: Use in Medical Product Development to Support Labelling Claims. http://www.fda.gov/cder/guidance/index.html. (13 March 2008, date last accessed) [DOI] [PMC free article] [PubMed] [Google Scholar]
- 2.Motzer RJ, Hutson TE, Tomczak P, et al. Sunitinib versus interferon alfa in metastatic renal-cell carcinoma. N Engl J Med. 2007;356(2):115–124. doi: 10.1056/NEJMoa065044. [DOI] [PubMed] [Google Scholar]
- 3.Koff RS. Impaired health-related quality of life in chronic hepatitis C: the how, but not the why. Hepatology. 1999;29(1):277–279. doi: 10.1002/hep.510290127. [DOI] [PubMed] [Google Scholar]
- 4.Copley-Merriman K, Jackson J, Boyer JG, et al. Invited Paper D. Industry perspectives regarding outcomes research in oncology. In: Lipscomb J, Gotay CC, Snyder C, editors. Outcomes Assessment in Cancer. Cambridge, UK: Cambridge University Press; 2005. [Google Scholar]
- 5.FACIT. Functional Assessment of Chronic Illness Therapy. http://www.facit.org/qview/qlist.aspx. (15 March 2008, date last accessed) [Google Scholar]
- 6.Cella D, Yount S, Du H, et al. Development and validation of the functional assessment of cancer therapy—Kidney Symptom Index (FKSI)©. J Supp Oncol. 2006;4:191–199. [PubMed] [Google Scholar]
- 7.Cella D, Yount S, Brucker PS, et al. Development and validation of a scale to measure disease-related symptoms of kidney cancer. Value Health. 2007;10(4):285–293. doi: 10.1111/j.1524-4733.2007.00183.x. [DOI] [PubMed] [Google Scholar]
- 8.Bonomi AE, Cella DF, Hahn EA, et al. Multilingual translation of the Functional Assessment of Cancer Therapy (FACT) quality of life measurement system. Qual Life Res. 1996;5:309–320. doi: 10.1007/BF00433915. [DOI] [PubMed] [Google Scholar]
- 9.The EuroQol Group. EuroQol: a new facility for the measurement of health-related quality of life—the EuroQol Group. Health Policy. 1990;16:199–208. doi: 10.1016/0168-8510(90)90421-9. [DOI] [PubMed] [Google Scholar]
- 10.Oken MM, Creech RH, Tormey DC, et al. Toxicity and response criteria of the Eastern Cooperative Oncology Group. Am J Clin Oncol. 1982;5:649–655. [PubMed] [Google Scholar]
- 11.Dolan P. Modeling valuations for EuroQol health states. Med Care. 1997;35:1095–1108. doi: 10.1097/00005650-199711000-00002. [DOI] [PubMed] [Google Scholar]
- 12.Fitzmaurice GM, Laird NM, Ware JH. Applied Longitudinal Analysis. Hoboken, NJ: John Wiley & Sons, Inc.; 2004. [Google Scholar]
- 13.Hedeker D, Gibbons RD. Longitudinal Data Analysis. Hoboken, NJ: John Wiley & Sons, Inc.; 2006. [Google Scholar]
- 14.Singer JD, Willett JB. Applied Longitudinal Data Analysis: Modeling Change and Event Occurrence. New York: Oxford University Press; 2003. [Google Scholar]
- 15.Cohen J. Statistical Power Analysis for the Behavioral Sciences. (2nd editon) Hillsdale, NJ: Lawrence Erlbaum Associates; 1998. [Google Scholar]
- 16.Cella DF. Measuring quality of life in palliative care. Semin Oncol. 1995;22:73–81. [PubMed] [Google Scholar]
- 17.Ozeki Z, Kobayashi S, Machida T, et al. Long-term survival in patients with metastatic renal cell carcinoma managed with conservative therapy: a report of two cases. Hinyokika Kiyo. 2004;50:621–624. [PubMed] [Google Scholar]
- 18.Pace KT, Dyer SJ, Stewart RJ, et al. Health-related quality of life after laparoscopic and open nephrectomy. Surg Endosc. 2003;17:143–152. doi: 10.1007/s00464-002-8902-y. [DOI] [PubMed] [Google Scholar]
- 19.Atzpodien J, Kuchler T, Wandert T, et al. Rapid deterioration in quality of life during interleukin-2- and alpha-interferon-based home therapy of renal cell carcinoma is associated with a good outcome. Br J Cancer. 2003;89:50–54. doi: 10.1038/sj.bjc.6600996. [DOI] [PMC free article] [PubMed] [Google Scholar]
- 20.Motzer RJ, Murphy BA, Bacik J, et al. Phase III trial of interferon alfa-2a with or without 13-cis-retinoic acid for patients with advanced renal cell carcinoma. J Clin Oncol. 2000;18:2972–2980. doi: 10.1200/JCO.2000.18.16.2972. [DOI] [PubMed] [Google Scholar]
- 21.Watanabe J, Hattori T, Satoh M, et al. Combined immunotherapy using interferon-alpha, interleukin-2 and lymphokine-activated killer cells—improvement of quality of life in patients with advanced renal cell carcinoma. Nippon Hinyokika Gakkai Zasshi. 1995;86:1156–1163. doi: 10.5980/jpnjurol1989.86.1156. [DOI] [PubMed] [Google Scholar]
- 22.Cella D, Li JZ, Cappelleri JC, et al. Quality of life in patients with metastatic renal cell carcinoma treated with sunitinib or interferon alfa: results from a phase III randomized trial. J Clin Oncol. 2008;26(22):3763–3769. doi: 10.1200/JCO.2007.13.5145. [DOI] [PubMed] [Google Scholar]
- 23.Kramer JA, Curran D, Piccart M, et al. Randomised trial of paclitaxel versus doxorubicin as first-line chemotherapy for advanced breast cancer: quality of life evaluation using the EORTC QLQ-C30 and the Rotterdam symptom checklist. Eur J Cancer. 2000;36:1488–1497. doi: 10.1016/s0959-8049(00)00134-9. [DOI] [PubMed] [Google Scholar]
- 24.Hobday TJ, Kugler JW, Mahoney MR, et al. Efficacy and quality-of-life data are related in a phase II trial of oral chemotherapy in previously untreated patients with metastatic colorectal carcinoma. J Clin Oncol. 2002;20:4574–4580. doi: 10.1200/JCO.2002.08.535. [DOI] [PubMed] [Google Scholar]
- 25.Hakamies-Blomqvist L, Luoma M, Sjostrom J, et al. Quality of life in patients with metastatic breast cancer receiving either docetaxel or sequential methotrexate and 5-fluorouracil. A multicentre randomised phase III trial by the Scandinavian breast group. Eur J Cancer. 2000;36:1411–1417. doi: 10.1016/s0959-8049(00)00126-x. [DOI] [PubMed] [Google Scholar]


