Abstract
Although balanced steady-state free precession (bSSFP) imaging yields high signal-to-noise ratio (SNR) efficiency, the bright lipid signal is often undesirable. The bSSFP spectrum can be shaped to suppress the fat signal with scan-efficient alternating repetition time (ATR) bSSFP. However, the level of suppression is limited, and the pass-band is narrow due to its non-uniform shape. A multiple repetition time (TR) bSSFP scheme is proposed that creates a broad stop-band with a scan efficiency comparable to ATR-SSFP. Furthermore, the pass-band signal uniformity is improved, resulting in fewer shading/banding artifacts. When data acquisition occurs in more than a single TR within the multiple-TR period, the echoes can be combined to significantly improve the level of suppression. The signal characteristics of the proposed technique were compared with bSSFP and ATR-SSFP. The multiple-TR method generates identical contrast to bSSFP, while achieving up to an order of magnitude higher stop-band suppression than ATR-SSFP. In vivo studies at 1.5 T and 3 T demonstrate the superior fat suppression performance of multiple-TR bSSFP.
Keywords: SSFP, repetition time, fat suppression, spectral, pulse sequence
Introduction
Balanced steady-state free precession (bSSFP) imaging (1–3) has found wide use in numerous MRI applications (4–14) because it yields high signal-to-noise ratios (SNR) within short repetition times (TR). Balanced SSFP sequences have T2/T1-weighted contrast, generating high signal from fluids such as blood. However, the signal from fat can be even higher. This is often unwanted as it may deteriorate the depiction of the surrounding structures of interest. Therefore, fat suppression is crucial in applications such as coronary artery imaging (4, 5), musculoskeletal imaging (7,8), and angiography (9–11).
A variety of interesting fat-suppression techniques have been proposed for bSSFP imaging (15–31). The transient bSSFP signal can be manipulated to suppress fat without substantially increasing the scan time (15–18); however, the images may suffer from oscillation-related artifacts or blurring due to the transient-signal characteristics (32). Phase-sensitive and Dixon-based methods effectively remove the fat signal through post-processing (19–25). Nevertheless, partial volume artifacts can lead to underestimation of the water content with phase-sensitive reconstructions. On the other hand, Dixon-based techniques require prolonged scan times leading to increased sensitivity to patient motion.
The aforementioned problems can be partially addressed if the fat signal is reduced by changing the spectral response of bSSFP. A stop-band can be created around the fat resonance by periodically varying the flip angles of the radio-frequency (RF) excitations (26–29). Although adequate levels of suppression can be maintained, RF nonlinearities and inhomogeneities compromise the performance. Another strategy is to manipulate the RF phases and the repetition times (TR) instead of the flip angles (e.g., fat-suppressing alternating repetition time (ATR) SSFP) (30, 31). For ATR-SSFP, the level of suppression strongly depends on the field inhomogeneity. Furthermore, the pass-band shape is compromised to achieve fat suppression. The resulting asymmetry of the pass-band reduces the effective band-width and SNR.
In this work, we propose an efficient multiple-TR bSSFP scheme for imaging of separate resonances with improved spectral selectivity. The multiple-TR bSSFP technique creates a broad stop-band without sacrificing the pass-band performance, by combining periodically repeated TR-patterns with a couple of simple post-processing steps. An increased number of TRs in a period can significantly improve the level of stop-band suppression compared with ATR-SSFP, while maintaining similar scan efficiency. We present example TR-patterns for fat suppression at 1.5 T and 3 T with a small number of different TRs. The multiple-TR stop-band provides a sufficient level of suppression to tolerate large field inhomogeneities.
Theory
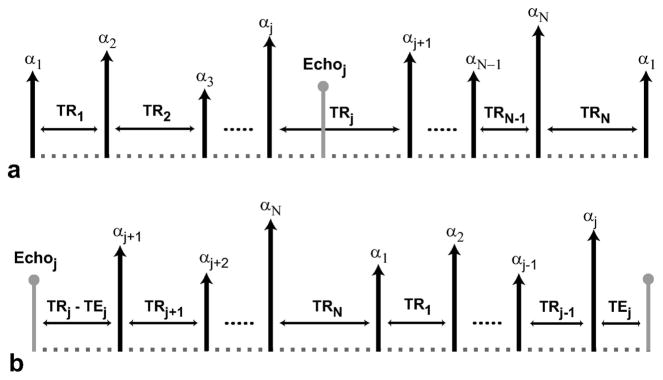
The period of a multiple-TR (or equivalently multiple-excitation) bSSFP sequence consists of N different RF excitations (αn) and TRs (TRn), which produces a periodic spectral response. Figure 1.a displays the period of a generic multiple-TR sequence. We can compute the spectral response for a certain echo (acquired at TEj during TRj) by solving the discrete time system that governs the magnetization change from one period to the next, taking this echo as the starting point (32). In other words, αn and TRn should be reordered (as shown in Fig. 1.b) in the form of αn′ and TRn′ such that:
| (1) |
| (2) |
Figure 1.
a: The period of a multiple-TR sequence consists of N different RF excitations (with flip angles, αn) and repetition times (with durations, TRn). We can compute the periodic spectral response for an echo acquired at TEj (during TRj) by solving the discrete time system governing the magnetization change from one period to the next, taking this echo as the starting point. b: Once the echo at TEj is assumed to be the initial point, the RF excitations and the repetition times will be reordered. This specific ordering of the multiple-TR period determines the aforementioned discrete time system and the resulting spectral response.
The corresponding response has a Fourier-series representation, Mj(f), whose coefficients (ck) are determined by the sparse sampling pattern formed by the amplitudes of the RF excitations and the relative TR-durations. If the grid spacing is chosen to be the greatest common divisor of all TRs (Δt) and K is the number of grid points, the summation of all TRs in a period is KΔt. For TRn′ ≪ T1,T2, Mj(f) can be expressed as:
| (3) |
The period of Mj(f) in frequency space is 1/Δt. Assuming idealized impulse-like RF excitations, the only nonzero coefficients are due to the RF amplitudes. If we denote the equilibrium magnetization with Mo, the expression can be simplified as follows:
| (4) |
Here, S(|αn′|) denotes the well-known phase-cycled regular bSSFP signal (33,34). To image the water resonance, we need to have a pass-band at on-resonance. An important special case of multiple-TR sequences is when all excitations have the same tip angle to provide increased immunity against RF inhomogeneity and nonlinearity. Therefore, a pass-band can be created at on-resonance by alternating the sign of every other RF pulse as in regular bSSFP (33, 34). This is a straightforward choice that generates a contrast nearly identical to that of bSSFP. The resulting constraint on the RF excitations, αn = (−1)nαo, further simplifies Mj(f):
| (5) |
When all RF excitations have the same tip angle, the shape of the resulting spectrum is predominantly determined by the relative TR-durations. Increasing N provides us more degrees of freedom for shaping the spectrum, but scan efficiency considerations limit the plausible set of sequences. For a multiple-TR sequence, the echoes in separate TRs have potentially different steady-state magnetizations. If data acquired within separate TRs will be used to reconstruct a single image, the corresponding steady-state profiles must have substantially equivalent magnitudes and phases.
Assuming data are collected in two separate TRs, TRu and TRv, of a multiple-TR sequence at respective echo times of TEu and TEv, the resulting spectral responses will be governed by the reordered TR-patterns {TRn′}u and {TRn′}v (formed as in Eq. 2). If these patterns are circularly-shifted versions of one another, so will the corresponding discrete time systems be except for a potential 180° phase offset due to phase cycling. Although such a shift of the Fourier-series coefficients yields a frequency-dependent phase difference between the two echoes, their magnitude profiles are equivalent. To satisfy the aforementioned condition, the following criteria must be met assuming TEu,v = TRu,v/2: (a) TRu = TRv. (b) If we form a string where the durations of the TRs are represented with letters and equal-duration TRs are assigned the same letter, we should be able to reorder this string to form a palindrome. e.g., “y x x” to “x y x”, or “z y x x y” to “x y z y x”. (c) If TRu is the nth letter counting from the left in this palindrome, TRv should be the nth letter from the right. i.e., they should be mirror symmetric. Therefore, TR-patterns that exhibit this symmetry and consist of only a few TRs are excellent candidates for multiple-TR bSSFP.
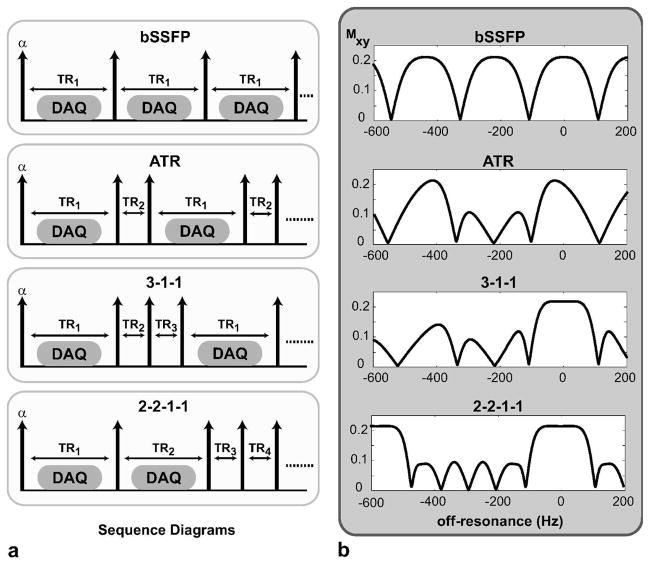
Figure 2.a displays a variety of scan-efficient multiple-TR sequences. The first example is bSSFP itself, which has a single TR in its period. In contrast, ATR-SSFP uses two different repetition times to manipulate the spectral response of bSSFP, and one proposed use has been to create a stop-band around the fat resonance (31). The longer of the two TRs is usually used for acquiring data. We propose extending this approach to multiple TRs, where the longer TRs again correspond to the data-acquisition intervals.
Figure 2.
a: Examples of multiple-TR sequences are shown: bSSFP (N = 1), ATR-SSFP (N = 2), 3-1-1 (N = 3), 2-2-1-1 (N = 4). All RF pulses have the same flip angle (α); however, the phase cycling pattern may vary: (0-90-180-270)° for ATR-SSFP, and (0-180)° for the rest. Data is acquired only during the labeled intervals, which are usually in the longer TRs. b: The corresponding transverse magnetization profiles for the bSSFP, ATR-SSFP, 3-1-1, and 2-2-1-1 sequences are shown. ATR-SSFP creates a stop-band around the fat resonance (−220 Hz at 1.5 T); however, its pass-band is non-uniform. In contrast, both multiple-TR sequences (3-1-1 and 2-2-1-1) have a flatter pass-band. The 2-2-1-1 profile has a broader stop-band compared to the other techniques.
The corresponding magnetization profiles for the aforementioned sequences are shown in Fig. 2.b, for the bSSFP, ATR-SSFP, and multiple-TR sequences for N = 3 (3-1-1, denoting the relative TR-durations) and N = 4 (2-2-1-1). The TR-durations were determined through an analysis outlined in later sections. The following parameters were used: α = 60°, T1/T2 = 1000/200 ms for arterial blood, TR1 = 4.6 ms for bSSFP, TR1/TR2 = 3.45/1.15 ms for ATR with (0-90-180-270)° phase-cycling, TR1/(TR2,TR3) = 3.1/0.9 ms for 3-1-1, (TR1,TR2)/(TR3,TR4) = 3.45/1.725 ms for 2-2-1-1.
Balanced SSFP produces a sinusoidal-like response, whereas ATR-SSFP creates a stop-band centered at the fat resonance (−220 Hz at 1.5 T). A similar stop-band can be generated while employing 3 TRs (a 3-1-1 TR-pattern) to yield a pass-band with significantly improved signal homogeneity compared with ATR-SSFP, and even bSSFP. Finally, a 4-TR sequence (a 2-2-1-1 TR-pattern) widens the stop-band to 1.67 times the width of the pass-band after a minimum-intensity projection (mIP) step (which will be explained in the next subsection), while achieving the same improvement in homogeneity.
The proposed multiple-TR sequences improve the homogeneity of the pass-band signal and have a similar scan efficiency to ATR-SSFP. Because its stop-band suppression can be significantly enhanced, we will particularly focus on the 4-TR sequence (2-2-1-1) from here on. In the following subsections, we examine the processing steps that increase the suppression level and the width of the stop-band, the dependence of the multiple-TR response on the relaxation parameters as well as the relative TR-durations, and look at a simple scheme to dampen the transient oscillations.
Post-processing Approaches for Stop-band Improvement
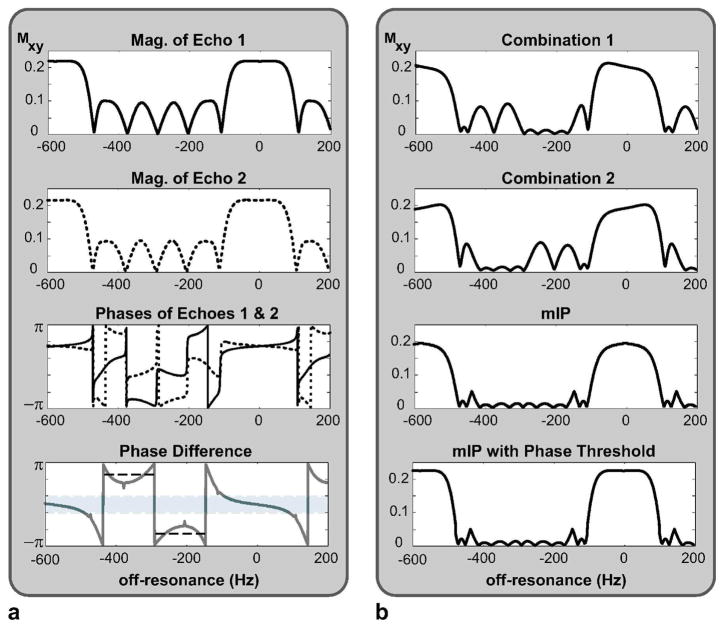
The 2-2-1-1 sequence is particularly interesting because the level of stop-band suppression can be further improved. Figure 3.a displays the magnitude and phase profiles of the echoes during the two longer TRs (TR1 and TR2), M1 and M2, where the phase of M2 is compensated for the 180° offset due to phase cycling. Because the absolute difference between their magnitudes is maximally 0.5 percent of the pass-band signal amplitude, they have substantially equivalent magnitude profiles. However, there is a nonlinear phase difference between the two echoes that increases with off-resonance as shown in Fig. 3.a:
| (6) |
Figure 3.
a: The two echoes in the subsequent data acquisition intervals, TR1 and TR2, of the 2-2-1-1 sequence have substantially equivalent magnitude profiles. However, the corresponding phase profiles (the solid line for TR1 and the dotted line for TR2) are different even after the 180° offset due to phase cycling is removed from the second echo, yielding a nonlinear phase difference increasing with off-resonance. While this difference is relatively bounded within the pass-band (marked with the light gray rectangle), it becomes significant in the stop-band. Furthermore, the difference assumes two mean values (marked with the dashed black lines) for separate frequency ranges within the stop-band. b: As shown in Combinations 1 and 2, the two echoes can be linearly combined to improve the stop-band suppression in either of the two stop-band frequency ranges. The mIP of these linear combinations achieves this improvement over the whole stop-band, at the expense of slightly reduced pass-band signal. We can compensate for this loss by thresholding the phase difference of the two echoes and magnitude-summing the pass-band data while performing the projection only within the stop-band.
This difference can be exploited by performing a linear combination of the two echoes to suppress the residual stop-band signal at a certain frequency. Because the difference accumulates around certain mean values within the two halves of the stop-band separated by a signal null, we need at least two separate linear combinations to suppress the remnant stop-band signal (Fig. 3.b). These linear combinations, , can be expressed as:
| (7) |
where φa,b denote the phases required to put the two echoes 180° out-of-phase within the aforementioned halves of the stop-band. The exact value of φ, which depends on τ = TR3/TR1, can be determined by simulating the magnetization profile of the 4-TR sequence. For τ = 0.5, the phase values are φa,b = ±58.5°. However, our simulation results indicate that φ is a slow-varying function of τ at a given frequency. Therefore, these values can be used for a range of τ without significantly compromising the level of improvement.
After the remnant signal is reduced at separate frequency ranges, we can improve the whole stop-band by simply computing the mIP of the linear combinations:
| (8) |
Although the projection operation degrades the pass-band signal, the phase difference values are rather constrained within the pass-band. This allows us to threshold the phase difference of the two echoes and separate the pass- and stop-band frequency ranges. As shown in Fig. 3.b, a magnitude summation of the two echoes preserves the pass-band signal, while the stop-band suppression is still improved with the mIP of the combinations.
| (9) |
where θ0 indicates the phase threshold used to avoid signal loss in the pass-band. Because the signal degradation mainly occurs in the relatively flat central portion of the pass-band, we only consider the frequency range where the signal magnitude stays above 80 percent of its on-resonance value. For τ= 0.5, θ0 = 28.3° is the corresponding phase threshold that separates this frequency range. Similar to φ values, θ has a weak-dependence on τ.
The post-processing steps affect the noise characteristics in addition to the resultant signal. The signal of the two echoes, M1 and M2, can be assumed to have uncorrelated bivariate Gaussian distributions with nonzero means, and equal noise variance, σ2. Because the magnitudes of the linear combination coefficients are identical for M1 and M2, Mlc has a Gaussian distribution with half the noise variance. Next, an mIP is performed on the magnitudes of these combinations, which are correlated Rician random variables. Although different linear combinations with identical noise variance determine the output at different off-resonance frequencies, the correlation between the combinations increases the resulting noise variance. Finally, the phase thresholding operation yields spatially varying noise because the echoes are magnitude-summed within the pass-band, and an mIP of the linear combinations is performed in the stop-band. The noise variance of the water pixels (the pass-band region) in the image are determined by the magnitude summation. Because M1,2 have nonzero means, |M1,2| are identically distributed Rician random variables, and the noise variance of their sum is slightly higher than that of |Mlc|.
Image Contrast
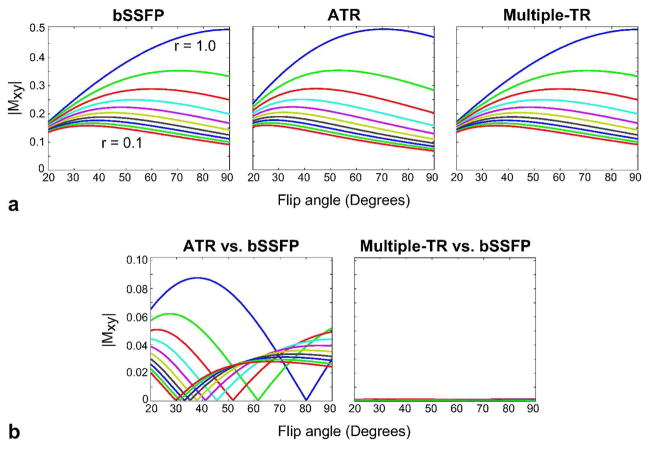
The tissue contrast is mainly determined by the signal at the water resonance. Figure 4.a displays the on-resonant signals for the bSSFP, ATR-SSFP, and multiple-TR sequences computed with Bloch simulations assuming: α ∈ [20 90]°, T2/T1 ∈ [0.1 1], TR ≪ T1,T2 and RF-tip duration ≪ TR. Because on-resonant spins do not acquire any phase due to free precession, the relative TR-durations mainly affect the on-resonant signal through relaxation effects. The multiple-TR sequences yield smaller signal during the longer TRs compared to the shorter ones, similar to ATR-SSFP (6, 31). Focusing on these longer TRs usually used for data acquisition and neglecting the small relaxation difference between the long and short TRs, the ATR-SSFP sequence is roughly equivalent to a (0-90-180-270)° phase-cycled bSSFP sequence with a shifted frequency response (31). Although this reduces the optimal tip angle and lowers the specific absorption rate (SAR), the resulting contrast is different due to the inhomogeneity of the bSSFP pass-band. On the other hand, the multiple-TR sequences, which have paired TRs of equal duration, employ the same phase-cycling as bSSFP (0-180-0-180)°, and generate very similar contrast at on-resonance. Therefore, the optimal flip angles for the multiple-TR and bSSFP sequences are approximately the same for a given T2/T1 ratio under the aforementioned assumptions. The absolute values of the differences between the bSSFP signal and the signals generated by the ATR-SSFP and multiple-TR sequences are shown in Fig. 4.b. While ATR-SSFP yields relatively significant differences, the multiple-TR sequence has nearly identical signal with bSSFP.
Figure 4.
a: The signal at the water resonance (on-resonance) was simulated as a function of the flip angle for the bSSFP, ATR-SSFP, and multiple-TR sequences. b: The differences between the bSSFP signal and the signals generated by ATR-SSFP and multiple-TR SSFP. T2/T1 (r) values were increased from 0.1 to 1 in 0.1 steps, assuming TR ≪ T1,T2 and RF-tip duration ≪ TR. Since no phase is accrued during the TRs at on-resonance, the relative TR-durations mainly affect the on-resonant signal through relaxation effects. The echoes during longer TRs, usually used for data acquisition, yield smaller signal. If we neglect the small relaxation difference between the separate TRs within the multiple-TR period, bSSFP and multiple-TR sequences produce very similar contrast at the water resonance with identical phase-cycling (0-180-0-180)°. On the other hand, fat-suppressing ATR-SSFP is roughly equivalent to a (0-90-180-270)° phase-cycled bSSFP sequence. Therefore, the ATR-SSFP contrast is actually different due to the inhomogeneity of the bSSFP pass-band.
TR-dependence of the Spectral Profiles
The spectral widths of the bSSFP bands are inversely proportional to the duration of the TR. Equivalently, the spectral response of a multiple-TR sequence is simply compressed in the frequency axis if the total TR (i.e., the sum of all repetition times within a period) is increased without changing the relative TR-durations. However, these relative durations also affect the multiple-TR response.
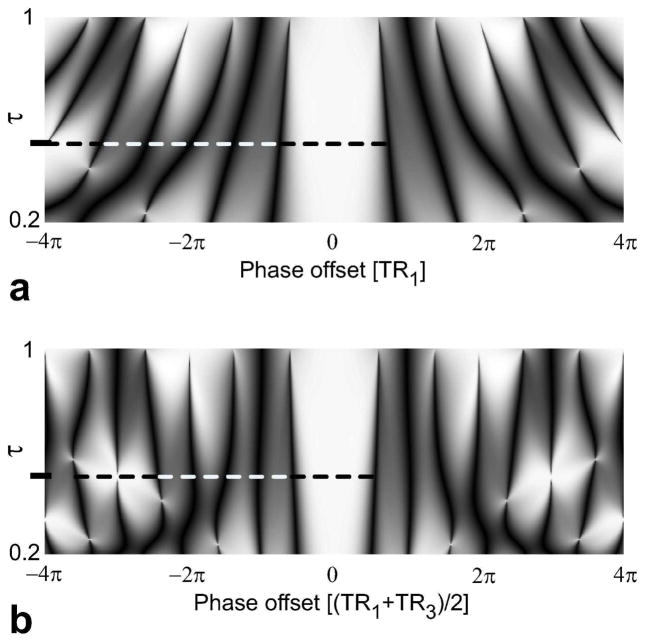
To analyze the multiple-TR (N = 4, TR1 = TR2, TR3 = TR4) response, we can keep either TR1 (the readout interval) or the total TR (2*[TR1+TR3]) constant, and vary TR3/TR1. Figure 5 demonstrates the resulting magnitude profiles simulated with the following parameters: τ = TR3/TR1 ∈ [0.2 1], α = 60°, T2/T1 = 0.2, and TR ≪ T1,T2. In the first case, decreasing τ shortens both TR3 and the total TR because TR1 is fixed. Defining the pass-band width to be the full width at half maximum, we can observe that it is a very weak function of τ for fixed TR1. The slight increase in the transition-band width can be attributed to the reduction of the total TR. In contrast, for a fixed total-TR, decreasing τ lengthens TR1, effectively decreasing the pass-band width. In this case, the pass-band response has a strong dependence on τ. It is important to note that τ = 0.5 creates a broad stop-band 1.67 times the extent of the corresponding pass-band. This ratio gives us a relative TR-pattern of 2-2-1-1. Finally, the multiple-TR sequence is identical to bSSFP for τ = 1.
Figure 5.
To demonstrate the effect of the TR-durations in multiple-TR bSSFP (N = 4, TR1 = TR2, TR3 = TR4), we can keep either TR1 (a) or the total TR (2*[TR1+TR3]) constant (b), and vary τ = TR3/TR1. In the first case, TR3 and the total TR are shortened by decreasing τ because TR1 is fixed. However, the pass-band width has a very weak dependence on τ for fixed TR1, if it is defined as the full width at half maximum. In contrast, TR1 is lengthened for smaller τ and a fixed total TR, effectively shrinking the pass-band. In both a and b, τ = 0.5 (marked with the ticks on the vertical axis) creates a stop-band (marked with the dashed white line) that has 1.67 times the width of the corresponding pass-band (marked with the dashed black line). Finally, τ = 1 produces a regular bSSFP response as expected.
The simulated spectral profiles indicate that a wide range of TR1 and TR3 values can be selected while maintaining a flat pass-band and a broad stop-band. Our simulation results also indicate that the mIP and phase-thresholding approaches will work well for a broad range of τ values. The pass-band flatness and signal are preserved within the [0.2 0.8] range for τ. If τ is increased beyond 0.8, the response converges to that of bSSFP, and the phase difference between the two echoes decreases gradually. As a result, the pass-band signal of the combinations decreases significantly, becoming zero at τ = 1.
Catalyzation of the Transient Response
Similar to bSSFP imaging, the multiple-TR transient signal has an oscillatory component that decays in time (32,35). Several techniques have been proposed to dampen these oscillations (32,36,37). A simple single-tip “α/2” preparation can be applied TR/2 prior to the first RF excitation, effectively placing the magnetization into its steady-state direction at on-resonance (36). This approach significantly reduces the oscillations; however, the magnitude of the magnetization vector still gradually decays from the thermal-equilibrium value to the steady-state value. The magnitude of this vector can be immediately reduced to its steady-state value using a single pulse followed by a crusher gradient prior to the “α/2” preparation (32).
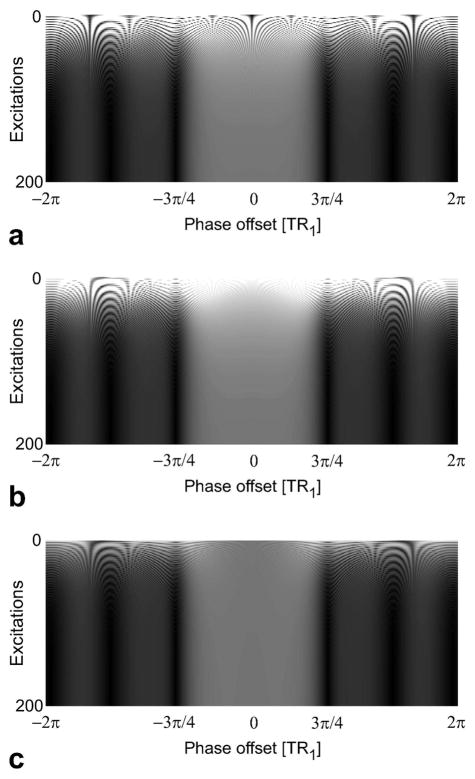
The transient signal from the 2-2-1-1 sequence was simulated for the pass- and stop-band frequency ranges without any preparation, with the single-tip preparation, and with the magnitude reduction followed by the single-tip preparation. α = 60° and T1/T2 = 1000/200 ms were assumed. The single-tip preparation was a −30° pulse applied TR4/2 prior to the first RF pulse (of the 2-2-1-1 sequence), which has zero phase. A single RF pulse with a 64° tip angle (determined by simulation) was used to reduce the magnetization to its steady-state value at on-resonance (0 Hz). Figure 6 shows the transient signal as a function of the number of excitations for each case. As expected, the signal oscillates significantly when no preparation is used. In contrast, these fluctuations are substantially reduced over the pass-band with the “α/2” preparation. The homogeneity of the pass-band signal improves the efficacy of the “α/2” preparation for multiple-TR sequences. Finally, the single pulse followed by a crusher gradient changes the magnitude of the magnetization to its steady-state value at on-resonance, and further reduces the amplitude of the signal oscillations in the pass- and stop-bands.
Figure 6.
The transient signal in the 2-2-1-1 pass- (phase offset in the ±3π/4 range) and stop-bands is shown as a function of the number of excitations with a: no preparation, b: a single-tip preparation, and c: a reduction of the magnitude of the magnetization vector followed by the single-tip preparation. Assuming α = 60° and T1/T2 = 1000/200 ms for the 2-2-1-1 sequence, the single-tip preparation was a −30° pulse applied TR4/2 prior to the first RF pulse (with zero phase), and a single 64° pulse was used to reduce the magnitude of the magnetization vector to its steady-state value at on-resonance. Without any preparation, there are significant signal oscillations, and the initial signal level is much higher than the steady-state level. The oscillations are substantially reduced over the pass-band with a single-tip preparation. Finally, the magnitude reduction instantly decreases the signal level to its steady-state value at on-resonance. This also reduces the signal oscillations in the stop-band. It is important to note that the flatness of the multiple-TR pass-band improves the efficacy of the single-tip preparation.
Methods
In this section, we first describe a scheme to optimize the parameters for a multiple-TR sequence. These parameters are then used to compare the multiple-TR technique with ATR-SSFP in phantom and in vivo studies.
Parameter Selection
In a multiple-TR sequence, the level of fat suppression can be quantified by computing the ratio of the mean water signal within a pass-band to the mean fat signal within a stop-band. The mean signal can be computed with uniform spectral weighting unless a priori information is available on the distribution of the field inhomogeneity across the imaging volume.
The transverse magnetization profiles of the multiple-TR sequence (N = 4, TR1 = TR2, TR3 = TR4) were simulated assuming T1/T2 = 1000/200 ms for water (blood), T1/T2 = 270/85 ms for fat, and a band of [−80 80] Hz around the water and fat resonances. The following practically useful range of parameters were prescribed: TR1 ∈ [2.5 4.5] ms, τ = TR3/TR1 ∈ [0.2 1], and three different flip angles: 30°, 45°, and 60°. The contour plots in Fig. 7 show the variation of the average water-to-fat signal ratio as a function of these parameters. Even though the level of suppression improves at higher flip angles, the optimal τ is in the [0.4 0.65] range and relatively insensitive to the flip angle. Finally, the highest level of suppression is attained around TR1 ≈ 3.4 ms and τ ≈ 0.5 for α = 60°, yielding a relative TR-pattern of 2-2-1-1.
Figure 7.
The contour plots show the average blood-to-fat signal ratio computed over a band of [−80 80] Hz around the water and fat resonances. The magnetization profiles for blood (T1/T2 = 1000/200 ms) and fat (T1/T2 = 270/85 ms) were simulated for a practically useful range of parameters: TR1 ∈ [2.5 4.5] ms, τ = TR3/TR1 ∈ [0.2 1], and three different flip angles: 30°, 45°, and 60°. The boundary conditions for the simulations were TR1 = TR2 and TR3 = TR4. The near-optimal values for the suppression ratio are achieved when τ is in the [0.4 0.65] range. The level of suppression improves at higher flip angles. Finally, the highest level of suppression is attained around TR1 ≈ 3.4 ms for α = 60°.
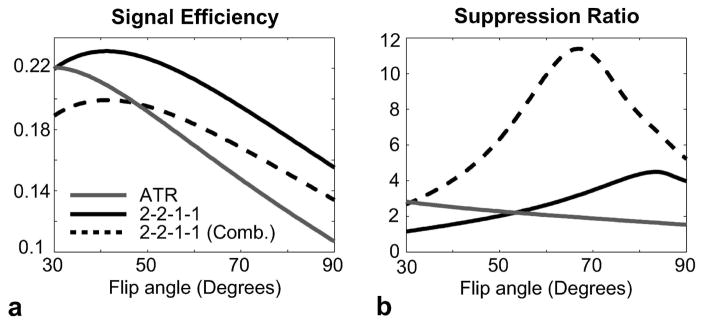
The previous simulation clearly demonstrates that the multiple-TR technique performs better at higher flip angles. However, the signal efficiency and SAR are the other two considerations that affect the choice of flip angle. The signal efficiency can be determined by normalizing the pass-band water signal by the square-root of the total TR. The same analysis can be performed for ATR-SSFP as a reference, after determining the optimal TR ratios. The following parameters were used for the comparison: α ∈ [30 90]°, TR1/TR2 = 3.45/1.15 ms for ATR-SSFP, (TR1,TR2)/(TR3,TR4) = 3.45/1.725 ms for 2-2-1-1. The two echoes in the 2-2-1-1 sequence were also linearly combined to improve the level of suppression. It is important to note that this sequence intrinsically takes twice the scan time of ATR-SSFP, assuming identical TR1’s and TR ratios for both.
Figure 8.a displays the signal efficiencies for the ATR-SSFP and 2-2-1-1 sequences. The homogeneous 2-2-1-1 pass-band yields higher signal efficiency compared to ATR-SSFP at all flip angles. Although the linear combination (Combination 1 in Fig. 3.b) slightly reduces the signal, it still has comparable efficiency and actually outperforms ATR-SSFP at flip angles above 50°. The water-to-fat suppression ratios for the three cases are shown in Fig. 8.b. The 2-2-1-1 sequence achieves better suppression than ATR at higher flip angles. Furthermore, the linear combination significantly improves the 2-2-1-1 stop-band as expected. The optimal suppression ratio with the linear combination is achieved around a flip angle of 60°. This is also approximately the maximum flip angle that can be prescribed without exceeding the SAR limits for the 2-2-1-1 sequence assuming (TR1,TR2)/(TR3,TR4) = 3.45/1.725 ms.
Figure 8.
The ATR-SSFP and 2-2-1-1 profiles were simulated for a range of flip angles. The 2-2-1-1 stop-band was further improved with a linear combination. a: To determine the signal efficiency, the average blood signal (T1/T2 = 1000/200 ms) over a [−80 80] Hz band was normalized by the square-root of the total TR. The flatter pass-band of the 2-2-1-1 sequence yields higher signal efficiency compared with ATR. Although the linear combination (Combination 1 in Fig. 3.b) slightly reduces the pass-band signal, it still has comparable efficiency to ATR. b: The water-to-fat suppression ratio was computed assuming T1/T2 = 270/85 ms and a [−300 −140] Hz band for fat. The 2-2-1-1 sequence achieves better suppression than ATR at higher flip angles. In addition, the linear combination significantly improves the 2-2-1-1 stop-band, and the suppression ratio is maximized around 60°.
Phantom Experiment
To demonstrate the simulated magnetization profiles with the multiple-TR sequences, images of a uniform water phantom (T1/T2 = 250/50 ms) were acquired on a 1.5 T GE Signa scanner with CV/i gradients (a maximum strength of 40 mT/m and a maximum slew rate of 150 T/m/s). A linear field gradient was used in the readout direction (vertical) to create varying precession frequency along that axis. The ATR-SSFP, 3-1-1 and 2-2-1-1 sequences were prescribed with the following parameters: α = 60°, TR1/TR2 = 3.45/1.15 ms for ATR, TR1/(TR2,TR3) = 3.1/0.9 ms for 3-1-1, (TR1,TR2)/(TR3,TR4) = 3.45/1.725 ms for 2-2-1-1. As demonstrated in Fig. 3.b, the 2-2-1-1 stop-band was enhanced by performing two different linear combinations and a final mIP on the two echoes.
In Vivo Experiments
Non-contrast-enhanced bSSFP-based MR angiography (10, 38) is a potential application that requires adequate fat suppression to clearly depict the underlying vessels. Lower leg angiograms were produced with 3D ATR-SSFP and 2-2-1-1 sequences, using linear extremity coils on 1.5 T and 3 T GE Signa scanners. At 1.5 T, the acquisition parameters were: α = 60°, 26 cm field-of-view (FOV), isotropic 1 mm resolution, 128×128 phase encoding, ±125 kHz bandwidth. TR1/TR2 = 3.45/1.15 ms for ATR (with NEX = 2), (TR1,TR2)/(TR3,TR4) = 3.45/1.725 ms for 2-2-1-1 (with NEX = 1) were used, yielding acquisition times of 2:31 and 2:50 respectively. Because the fat resonance at 3 T is not located in the center of the 2-2-1-1 stop-band, the TR values were scaled down to broaden this stop-band. For the 3 T experiment, TR1/TR2 = 3.38/1.12 ms for ATR, (TR1,TR2)/(TR3,TR4) = 3.00/1.36 ms for 2-2-1-1 were prescribed with the corresponding acquisition times of 2:28 and 2:23. All the remaining parameters were kept the same as in the 1.5 T experiment, except for an FOV of 22 cm and a phase-cycling of (0-180-180-0)° for ATR as discussed in Ref. (31).
The two echoes in the 2-2-1-1 datasets were first linearly combined, and then a mIP of these linear combinations was computed to improve the level of fat suppression. Only two linear combinations were used as shown in Fig. 3 because the additional ones did not improve the suppression significantly. The pass-band frequency range was determined by thresholding the absolute value of the phase difference between the two echoes to be less than 28.3°. Meanwhile, the two ATR-acquisitions were sum-of-squares combined. To enhance the visualization of the vasculature, the data were zero-padded prior to maximum-intensity projections (MIP).
Results
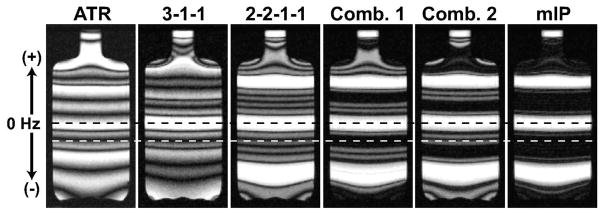
The phantom images acquired with the ATR-SSFP, 3-1-1 and 2-2-1-1 methods are displayed in Fig. 9. As expected, the multiple-TR sequences (N = 3 and N =4) have significantly more uniform pass-bands than ATR-SSFP. The 3-1-1 method creates a similar stop-band to ATR-SSFP, while the 2-2-1-1 sequence has the broadest stop-band with the highest level of suppression. Separate segments of the 2-2-1-1 stop-band are independently improved by linear combinations (Comb. 1 and 2 in Fig. 9). Finally, an mIP of these combinations yields enhanced suppression over the whole stop-band.
Figure 9.
Phantom images were acquired to demonstrate the created magnetization profiles, where the precession frequency was vertically varied with a linear field gradient in that direction. The ATR-SSFP, 3-1-1, and 2-2-1-1 images are shown in order from left to right. Water and fat resonances at 1.5 T are marked with the dashed black and white lines respectively. The multiple-TR sequences have significantly more uniform pass-bands than ATR. Meanwhile, the 2-2-1-1 sequence has the broadest stop-band and the highest level of suppression. The suppression in separate segments of the stop-band can be independently improved with linear combinations as shown in Comb. 1 and 2. Finally, a mIP of these combinations yields enhanced suppression over the whole stop-band.
Figure 10 shows the axial and coronal slices from the ATR and multiple-TR (2-2-1-1) lower leg acquisitions at 1.5 T along with the corresponding whole-volume MIPs. The superior suppression of the multiple-TR sequence is demonstrated through the detailed depiction of the underlying vasculature. The arrows in Fig. 10 point to the vessels that are lost within the surrounding fat tissue in ATR-SSFP, while these vessels are accurately visualized with multiple-TR bSSFP.
Figure 10.
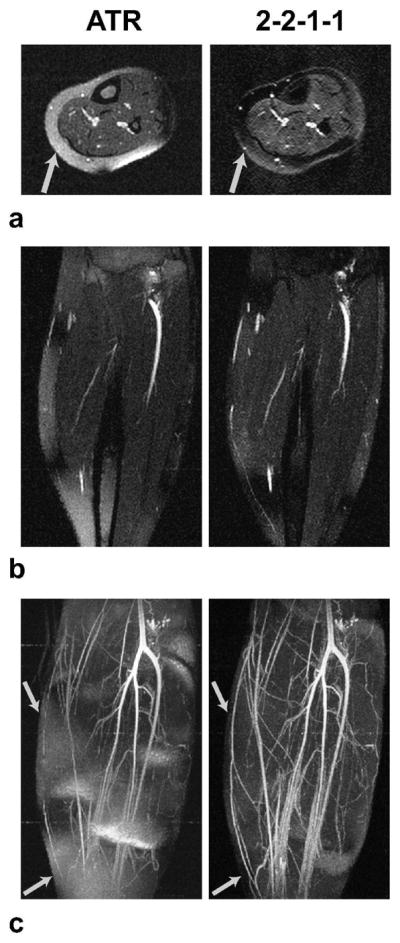
1.5 T results. Axial (a) and coronal slices (b) from ATR and multiple-TR acquisitions are displayed along with the corresponding whole-volume MIPs (c). Multiple-TR bSSFP has a broader stop-band with a higher level of suppression compared to ATR-SSFP. This improved suppression results in more detailed depiction of the underlying vasculature. Arrows point to the vessels that are lost within the surrounding fat tissue in ATR-SSFP, while these vessels are accurately visualized with multiple-TR bSSFP.
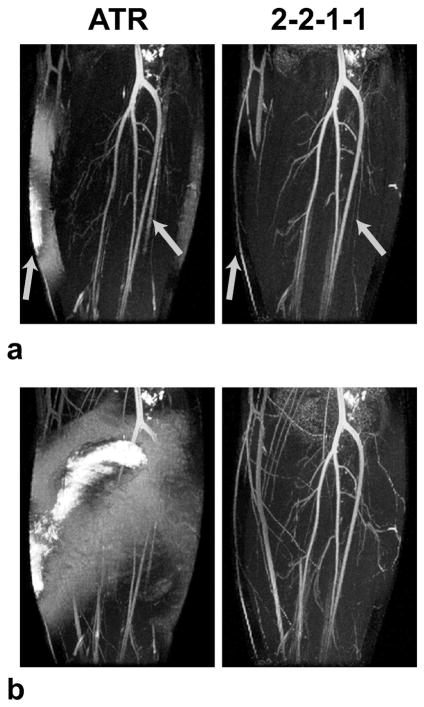
The lower leg angiograms produced at 3 T with the ATR and multiple-TR (2-2-1-1) methods are displayed in Fig. 11 as thin-slab and whole-volume MIPs. The broad stop-band of the multiple-TR sequence successfully suppresses the fat signal in regions where ATR-SSFP fails. Poor fat suppression deteriorates the vessel depiction with ATR-SSFP (Fig. 11.a). Furthermore, poor suppression of the bone-marrow signal in the fibula confounds the ATR-SSFP images. Finally, the whole-volume MIP of the ATR-SSFP angiogram has very bright fat signal in the peripheral regions (Fig. 11.b). With the increased field inhomogeneity at 3 T, the width of the ATR stop-band becomes insufficient, whereas the multiple-TR stop-band achieves adequate suppression over the whole volume.
Figure 11.
3 T results. The thin-slab (a) and whole-volume (b) MIPs of ATR and multiple-TR acquisitions are shown. The broad multiple-TR stop-band successfully reduces the fat signal in regions where ATR-SSFP fails. Poor fat suppression deteriorates the vessel depiction with ATR-SSFP as seen in a. Furthermore, improperly suppressed bone-marrow signal in the fibula with ATR-SSFP confounds the thin-slab MIPs. These regions are shown with arrows in a. The ATR-SSFP image in b has very bright fat signal in the peripheral regions. This indicates that the stop-band width of ATR-SSFP becomes insufficient with the increased field inhomogeneity at 3 T. In contrast, the multiple-TR image has adequate suppression over the whole volume.
Discussion
A pattern of varying TR-durations can enhance the shaping of the bSSFP spectrum. In particular, a broad stop-band can be created to suppress the fat signal without degrading the pass-band performance. The response can be further improved by increasing the number of TRs within a period. However, in a given TR-pattern, only the symmetric TRs of the same duration will have equivalent magnetization profiles. Therefore, increasing the number of TRs limits the percentage of time spent for data acquisition and reduces the scan efficiency.
We have analyzed the signal characteristics of two simple and efficient TR-patterns (with 3 and 4 TRs respectively). The 3-1-1 sequence achieves similar suppression to ATR-SSFP while creating a flat pass-band; however, the 2-2-1-1 sequence is of more interest due to its broader stop-band. The latter sequence also offers the benefit of improved suppression if the different phase behavior of the two echoes is exploited. The 2-2-1-1 sequence achieves up to an order of magnitude higher suppression than ATR-SSFP with the additional processing, while maintaining comparable scan efficiency.
The 2-2-1-1 sequence has a broad stop-band, which increases the immunity to relatively-large field inhomogeneities without the need for complex shimming procedures. While single-acquisition methods such as ATR-SSFP can robustly suppress the fat signal over a limited portion of their stop-bands, the level of suppression degrades with field inhomogeneity. Therefore, these techniques might be sub-optimal for applications such as high-field and 3D imaging.
Methods that spectrally shape the bSSFP spectrum have inherent limitations on the duration of the repetition times. While ATR-SSFP offers increased flexibility in parameter selection, several other methods including fluctuating-equilibrium MR (FEMR) (30) and linear-combination (LC) SSFP (21) impose stringent constraints on the optimal repetition time. Our simulations show that a wide and practically useful range of parameters can be prescribed without significantly affecting the performance of the multiple-TR technique.
Multiple-TR bSSFP generates a homogeneous pass-band signal, which is identical to the on-resonant bSSFP signal. There are two implications of this signal characteristic. First, the pass-band is flatter compared to many other techniques including bSSFP itself. This will reduce contrast variations due to off-resonance. Second, the multiple-TR sequence demonstrates identical contrast to bSSFP, whereas methods like FEMR, ATR-SSFP and LCSSFP have more T2-dominant signal. It might be more advantageous to use multiple-TR sequences in applications where bSSFP is used to achieve T1-weighting (39) or the T2/T1 dependence of the bSSFP signal is valuable.
Some of the operations performed to improve the 2-2-1-1 stop-band, namely mIP and phase thresholding, are nonlinear. Although this increases the sensitivity to partial volume effects for a voxel occupied by fat and water simultaneously, the fat signal is already reduced in the 2-2-1-1 acquisition and these effects become less significant. We did not observe considerable loss of water signal at the resolutions prescribed for the performed experiments.
The susceptibility to motion artifacts is increased with the 2-2-1-1 sequence due to lengthening of the minimum scan time compared to single-acquisition techniques such as ATR-SSFP. The prescribed TRs and the overall scan time for 3D imaging are relatively short; however, under unfavorable imaging conditions such as respiratory movement, motion-correction techniques might be required. Nevertheless, the two echoes are acquired in an interleaved manner in contrast with sequential techniques such as LCSSFP. This not only increases the immunity to patient motion, but also makes the technique more suitable for real-time imaging compared with sequential techniques.
The multiple-TR sequences are expected to be sensitive to unbalanced phase due to eddy-current effects and flow similar to ATR-SSFP and regular bSSFP imaging (6). Phase-encode pairing is used to minimize the eddy-current effects (40,41). Although significant flow artifacts were not observed in this work, phase-encode gradients can be first-moment nulled to reduce the flow sensitivity if necessary (42,43).
As a possible extension, the multiple-TR bSSFP scheme can be generalized to embody varying flip angles and RF phases (other than a simple sign change). When coupled with the varying repetition times, this can help improve the spectral shaping. However, the added design variables will complicate the analysis and selection of the optimal parameters. In future work, we will investigate if there are additional benefits to concurrently varying the RF flip angles and the repetition times.
Conclusion
Multiple-TR bSSFP offers a high level of suppression over a broad stop-band without compromising the homogeneity of the pass-band signal. This suppression is achieved over 1.67 times the width of the pass-band without sacrificing the signal efficiency. In addition, when multiple echoes are acquired in separate TRs within a period, they can be linearly combined to further improve the stop-band suppression. Meanwhile, the slight reduction in the pass-band signal can be avoided by a simple phase thresholding. Optimal parameters for multiple-TR bSSFP can be determined with straightforward simulations; however, a wide range of parameters can still be prescribed without substantially affecting the performance. This flexibility coupled with the effective fat suppression under large field inhomogeneity can be beneficial for bSSFP imaging applications.
Acknowledgments
This work was supported by National Institutes of Health (NIH) under Grant R01 HL039297, Grant R01 HL075803 and by GE Healthcare. The work of Tolga Çukur was supported by a Rambus Corporation Stanford Graduate Fellowship.
TÇ would like to thank William Overall for helpful discussions on the manuscript.
References
- 1.Carr HY. Steady-state free precession in nuclear magnetic resonance. Phys Rev. 1958;112:1693–1701. [Google Scholar]
- 2.Oppelt A, Graumann R, Barfuss H, Fischer H, Hartl W, Shajor W. FISP – a new fast MRI sequence. Electromedica. 1986;54:15–18. [Google Scholar]
- 3.Hawkes RC, Patz S. Rapid Fourier imaging using steady-state free precession. Magn Reson Med. 1987;4:9–23. doi: 10.1002/mrm.1910040103. [DOI] [PubMed] [Google Scholar]
- 4.Deshpande VS, Shea SM, Laub G, Simonetti OP, Finn JP, Li D. 3D magnetization-prepared True-FISP: A new technique for imaging coronary arteries. Magn Reson Med. 2001;46:494–502. doi: 10.1002/mrm.1219. [DOI] [PubMed] [Google Scholar]
- 5.Stuber M, Weiss RG. Coronary magnetic resonance angiography. J Magn Reson Imaging. 2007;26:219–234. doi: 10.1002/jmri.20949. [DOI] [PubMed] [Google Scholar]
- 6.Nayak KS, Lee HL, Hargreaves BA, Hu BS. Wideband SSFP: Alternating repetition time balanced steady state free precession with increased band spacing. Magn Reson Med. 2007;58:931–938. doi: 10.1002/mrm.21296. [DOI] [PubMed] [Google Scholar]
- 7.Hargreaves BA, Gold GE, Beaulieu CF, Vasanawala SS, Nishimura DG, Pauly JM. Comparison of new methods for magnetic resonance imaging of articular cartilage. Magn Reson Med. 2003;49:700–709. doi: 10.1002/mrm.10424. [DOI] [PubMed] [Google Scholar]
- 8.Vasanawala SS, Hargreaves BA, Pauly JM, Nishimura DG, Beaulieu CF, Gold GE. Rapid musculoskeletal MRI with phase-sensitive steady-state free precession: Comparison with routine knee MRI. AJR Am J Roentgenol. 2004;184:1450–1455. doi: 10.2214/ajr.184.5.01841450. [DOI] [PubMed] [Google Scholar]
- 9.Brittain JH, Olcott EW, Szuba A, Gold GE, Wright GA, Irarrazaval P, Nishimura DG. Three-dimensional flow-independent peripheral angiography. Magn Reson Med. 1997;38:343–354. doi: 10.1002/mrm.1910380302. [DOI] [PubMed] [Google Scholar]
- 10.Cukur T, Lee JH, Bangerter NK, Hargreaves BA, Nishimura DG. Comparison of phase-sensitive and alternating repetition time SSFP for flow-independent peripheral angiography. Proceedings of the 15th Annual Meeting of ISMRM; Berlin. 2007. p. 178. [Google Scholar]
- 11.Maki JH, Wilson GJ, Eubank WB, Glickerman DJ, Millan JA, Hoogeveen RM. Navigator-gated MR angiography of the renal arteries: A potential screening tool for renal artery stenosis. AJR Am J Roentgenol. 2007;188:540–546. doi: 10.2214/AJR.06.1138. [DOI] [PubMed] [Google Scholar]
- 12.Duerk JL, Lewin JS, Wendt M, Petersilge C. Remember true FISP? a high SNR near 1-second imaging method for T2-like contrast in interventional MRI at. 2 T. J Magn Reson Imaging. 1998;8:203–208. doi: 10.1002/jmri.1880080134. [DOI] [PubMed] [Google Scholar]
- 13.Dharmakumar R, Koktzoglou I, Li D. Generating positive contrast from off-resonant spins with steady-state free precession magnetic resonance imaging: theory and proof-of-principle experiments. Phys Med Biol. 2006;51:4201–4215. doi: 10.1088/0031-9155/51/17/006. [DOI] [PubMed] [Google Scholar]
- 14.Bieri O, Patil S, Quick HH, Scheffler K. Morphing steady-state free precession. Magn Reson Med. 2007;58:1242–1248. doi: 10.1002/mrm.21421. [DOI] [PubMed] [Google Scholar]
- 15.Deimling M, Heid O. True FISP imaging with inherent fat cancellation. Proceedings of the 8th Annual Meeting of ISMRM; Denver. 2000. p. 1500. [Google Scholar]
- 16.Scheffler K, Heid O, Hennig J. Magnetization preparation during the steady-state: Fat-saturated 3D true FISP. Magn Reson Med. 2001;45:1075–1080. doi: 10.1002/mrm.1142. [DOI] [PubMed] [Google Scholar]
- 17.Derbyshire JA, Herzka DA, McVeigh ER. S5FP: spectrally selective suppression with steady state free precession. Magn Reson Med. 2005;54:918–928. doi: 10.1002/mrm.20633. [DOI] [PMC free article] [PubMed] [Google Scholar]
- 18.Paul D, Hennig J, Zaitsev M. Intrinsic fat suppression in TIDE balanced steady-state free precession imaging. Magn Reson Med. 2006;56:1328–1335. doi: 10.1002/mrm.21084. [DOI] [PubMed] [Google Scholar]
- 19.Hargreaves BA, Vasanawala SS, Nayak KS, Hu BS, Nishimura DG. Fat-suppressed steady-state free precession imaging using phase detection. Magn Reson Med. 2003;50:210–213. doi: 10.1002/mrm.10488. [DOI] [PubMed] [Google Scholar]
- 20.Hargreaves BA, Nishimura DG. Quadratic fat/water separation in balanced SSFP. Proceedings of the 13th Annual Meeting of ISMRM; Miami Beach. 2005. p. 103. [Google Scholar]
- 21.Vasanawala SS, Pauly JM, Nishimura DG. Linear combination steady-state free precession MRI. Magn Reson Med. 2000;43:82–90. doi: 10.1002/(sici)1522-2594(200001)43:1<82::aid-mrm10>3.0.co;2-9. [DOI] [PubMed] [Google Scholar]
- 22.Huang TY, Chung HW, Wang FN, Ko CW, Chen CY. Fat and water separation in balanced steady-state free precession using the Dixon method. Magn Reson Med. 2004;51:243–247. doi: 10.1002/mrm.10686. [DOI] [PubMed] [Google Scholar]
- 23.Reeder SB, Wen Z, Yu H, Pineda AR, Gold GE, Markl M, Pelc NJ. Multicoil Dixon chemical species separation with an iterative least squares estimation method. Magn Reson Med. 2004;51:35–45. doi: 10.1002/mrm.10675. [DOI] [PubMed] [Google Scholar]
- 24.Reeder SB, Pineda AR, Wen Z, Shimakawa A, Yu H, Brittain JH, Gold GE, Beaulieu CH, Pelc NJ. Iterative decomposition of water and fat with echo asymmetry and least-squares estimation (IDEAL): application with fast spin-echo imaging. Magn Reson Med. 2005;54:636–644. doi: 10.1002/mrm.20624. [DOI] [PubMed] [Google Scholar]
- 25.Wieben O, Leupold J, Mannson S, Hennig J. Multi-echo balanced SSFP imaging for iterative Dixon reconstruction. Proceedings of the 13th Annual Meeting of ISMRM; Miami Beach. 2005. p. 2386. [Google Scholar]
- 26.Hardy CJ, Dixon WT. Steady-state free precession imaging with inherent fat suppression. Proceedings of the 10th Annual Meeting of ISMRM; Honolulu. 2002. p. 473. [Google Scholar]
- 27.Overall WR, Nishimura DG, Hu BS. Steady-state sequence synthesis and its application to efficient fat-suppressed imaging. Magn Reson Med. 2003;50:550–559. doi: 10.1002/mrm.10542. [DOI] [PubMed] [Google Scholar]
- 28.Absil J, Denolin V, Metens T. Fat attenuation using a dual steady-state balanced-SSFP sequence with periodically variable flip angles. Magn Reson Med. 2006;55:343–351. doi: 10.1002/mrm.20766. [DOI] [PubMed] [Google Scholar]
- 29.Lin H, Raman SV, Chung Y, Simonetti OP. Rapid phase-modulated water excitation steady-state free precession for fat suppressed cine cardiovascular MR. J Cardiovasc Magn Reson. 2008;10:22. doi: 10.1186/1532-429X-10-22. [DOI] [PMC free article] [PubMed] [Google Scholar]
- 30.Vasanawala SS, Pauly JM, Nishimura DG. Fluctuating equilibrium MRI. Magn Reson Med. 1999;42:876–883. doi: 10.1002/(sici)1522-2594(199911)42:5<876::aid-mrm6>3.0.co;2-z. [DOI] [PubMed] [Google Scholar]
- 31.Leupold J, Hennig J, Scheffler K. Alternating repetition time balanced steady state free precession. Magn Reson Med. 2006;55:557–565. doi: 10.1002/mrm.20790. [DOI] [PubMed] [Google Scholar]
- 32.Hargreaves BA, Vasanawala SS, Pauly JM, Nishimura DG. Characterization and reduction of the transient response in steady-state MR imaging. Magn Reson Med. 2001;46:149–158. doi: 10.1002/mrm.1170. [DOI] [PubMed] [Google Scholar]
- 33.Zur Y, Stokar S, Bendel P. An analysis of fast imaging sequences with steady-state transverse magnetization refocusing. Magn Reson Med. 1988;6:175–193. doi: 10.1002/mrm.1910060206. [DOI] [PubMed] [Google Scholar]
- 34.Scheffler K, Lehnhardt S. Principles and applications of balanced SSFP techniques. Eur Radiol. 2003;13:2409–2418. doi: 10.1007/s00330-003-1957-x. [DOI] [PubMed] [Google Scholar]
- 35.Schmitt P, Griswold MA, Gulani V, Haase A, Flentje M, Jakob PM. A simple geometrical description of the TrueFISP ideal transient and steady-state signal. Magn Reson Med. 2006;55:177–186. doi: 10.1002/mrm.20738. [DOI] [PubMed] [Google Scholar]
- 36.Deimling M, Heid O. Magnetization prepared True FISP imaging. Proceedings of the 2nd Annual Meeting of SMR; San Francisco. 1994. p. 495. [Google Scholar]
- 37.Le Roux P. Simplified model and stabilization of SSFP sequences. J Magn Reson. 2003;163:23–37. doi: 10.1016/s1090-7807(03)00115-0. [DOI] [PubMed] [Google Scholar]
- 38.Stafford RB, Sabati M, Mahallati H, Frayne R. 3D non-contrast-enhanced MR angiography with balanced steady-state free precession Dixon method. Magn Reson Med. 2008;59:430–433. doi: 10.1002/mrm.21479. [DOI] [PubMed] [Google Scholar]
- 39.Scheffler K, Hennig J. T1 quantification with inversion recovery TrueFISP. Magn Reson Med. 2001;45:720–723. doi: 10.1002/mrm.1097. [DOI] [PubMed] [Google Scholar]
- 40.Bieri O, Markl M, Scheffler K. Analysis and compensation of eddy currents in balanced SSFP. Magn Reson Med. 2005;54:129–137. doi: 10.1002/mrm.20527. [DOI] [PubMed] [Google Scholar]
- 41.Markl M, Leupold J, Bieri O, Scheffler K, Hennig J. Double average parallel steady-state free precession imaging: optimized eddy current and transient oscillation compensation. Magn Reson Med. 2005;54:965–974. doi: 10.1002/mrm.20615. [DOI] [PubMed] [Google Scholar]
- 42.Markl M, Alley MT, Elkins CJ, Pelc NJ. Flow effects in balanced steady state free precession imaging. Magn Reson Med. 2003;50:892–903. doi: 10.1002/mrm.10631. [DOI] [PubMed] [Google Scholar]
- 43.Nayak KS, Hargreaves BA, Hu BS, Nishimura DG, Pauly JM, Meyer CH. Spiral balanced SSFP cardiac imaging. Magn Reson Med. 2005;53:1468–1473. doi: 10.1002/mrm.20489. [DOI] [PubMed] [Google Scholar]


