Abstract
PURPOSE
To analyze the effects of variations in femtosecond laser energy level on corneal stromal cell death and inflammatory cell influx following flap creation in a rabbit model.
METHODS
Eighteen rabbits were stratified in three different groups according to level of energy applied for flap creation (six animals per group). Three different energy levels were chosen for both the lamellar and side cut: 2.7 μJ (high energy), 1.6 μJ (intermediate energy), and 0.5 μJ (low energy) with a 60 KHz, model II, femtosecond laser (IntraLase). The opposite eye of each rabbit served as a control. At the 24-hour time point after surgery, all rabbits were euthanized and the corneoscleral rims were analyzed for the levels of cell death and inflammatory cell influx with the terminal uridine deoxynucleotidyl transferase dUTP nick end labeling (TUNEL) assay and immunocytochemistry for monocyte marker CD11b, respectively.
RESULTS
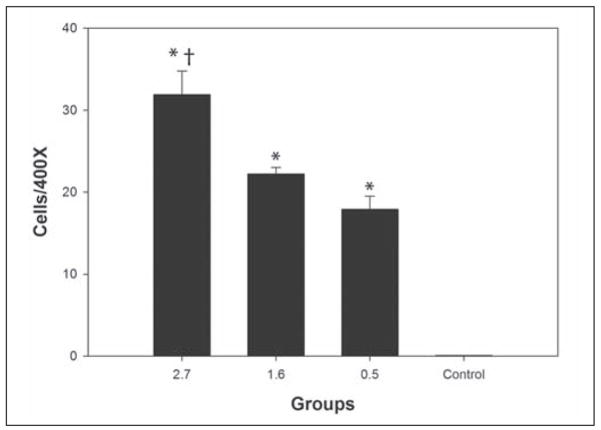
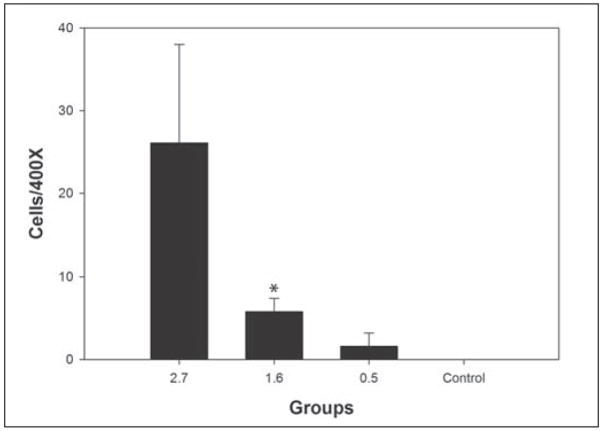
The high energy group (31.9±7.1 [standard error of mean (SEM) 2.9]) had significantly more TUNEL-positive cells in the central flap compared to the intermediate (22.2±1.9 [SEM 0.8], P=.004), low (17.9±4.0 [SEM 1.6], P≤.001), and control eye (0.06±0.02 [SEM 0.009], P≤.001) groups. The intermediate and low energy groups also had significantly more TUNEL-positive cells than the control groups (P≤.001). The difference between the intermediate and low energy levels was not significant (P=.56). The mean for CD11b-positive cells/400× field at the flap edge was 26.2±29.3 (SEM 12.0), 5.8±4.1 (SEM 1.7), 1.7±4.1 (SEM 1.7), and 0.0±0.0 (SEM 0.0) for high energy, intermediate energy, low energy, and control groups, respectively. Only the intermediate energy group showed statistically more inflammatory cells than control eyes (P=.015), most likely due to variability between eyes.
CONCLUSIONS
Higher energy levels trigger greater cell death when the femtosecond laser is used to create corneal flaps. Greater corneal inflammatory cell infiltration is observed with higher femtosecond laser energy levels.
Early clinical experience with the femtosecond laser has suggested good efficacy in creating LASIK flaps with fewer complications and better outcomes compared with microkeratomes from different manufacturers.1–6 For example, several studies have demonstrated less induction of optical aberrations following LASIK surgery performed with femtosecond lasers compared with microkeratomes.1–6
The corneal wound healing response after LASIK performed with the femtosecond laser has been associated with greater postoperative inflammation, mainly in the periphery, especially with the 15 kHz IntraLase laser (Model I and II; IntraLase, Irvine, Calif).7 After LASIK performed in humans with the 15 kHz laser, increased inflammation was often observed with the slit lamp at the flap interface and also with immunohistochemical detection of inflammatory cells at the flap edge and in the central interface in rabbit models.8 Studies with rabbit models performed in our laboratory8 suggested that decreased femtosecond laser energy resulted in decreased keratocyte necrosis and, therefore, decreased inflammation. However, three different IntraLase femtosecond laser models were used in our earlier studies. Design differences between the different lasers made it impossible to make firm conclusions regarding increases in stromal cell death and inflammation being related to higher energy levels.
In the present study, we investigated the effect of variations in side-cut and lamellar-cut energies with the 60 kHz model II IntraLase femtosecond laser on the early wound healing response after flap formation. Specifically, stromal cell death and inflammatory cell infiltration were measured using histological assays to determine whether these parameters varied with different energy levels using a single model of femtosecond laser.
MATERIALS AND METHODS
Eighteen 12- to 15-week-old female New Zealand white rabbits weighing 2.5 to 3.0 kg each were included in this study. One eye of each rabbit was selected at random for surgery or control. All rabbits had flaps cut with the 60 KHz Model II femtosecond laser (110-μm thickness, 8.0-mm diameter, 55° side-cut and hinge angle, 8-μm spot and line separation). Energy levels were the same for side cut and lamellar cut in each animal: low energy group (0.5 μJ), intermediate energy group (1.6 μJ), and high energy group (2.7 μJ).
Femtosecond LASIK flaps were not lifted in this study so as to evaluate only the effects of laser energy on corneal cell death and inflammatory cell infiltration. The eyelids were closed with temporary placement of a double-armed 5–0 suture immediately after femtosecond laser treatment. Animals were sacrificed 24 hours after surgery and the corneoscleral rims collected for cryofixation. This time point was selected because our prior study8 showed this was ideal for simultaneously monitoring cell death with the terminal uridine deoxynucleotidyl transferase dUTP nick end labeling (TUNEL) assay and inflammatory cell infiltration with the CD11b immunohistochemical assay. All animals were treated according to the Association for Research in Vision and Ophthalmology statement for the use of animals in ophthalmic and vision research.
The laser system used in these experiments underwent standard installation and maintenance provided by the manufacturer for human clinical use. The pulse energy was measured and controlled internally by the laser. The internal energy meter was calibrated by the manufacturer.
Tissue Fixation, Sectioning, and Tunel Assay and Immunocytochemistry
Corneoscleral rims of eyes with flaps and control eyes were embedded in liquid OCT compound (Tissue-Tek; Sakura Finetek, Torrance, Calif) within a 24×24×5-mm mold (Fisher Scientific, Pittsburgh, Pa). The tissue specimens were centered within the mold so the block could be bisected and transverse sections cut from the center of the cornea. The frozen tissue blocks were stored at −85°C until sectioning was performed.
Central corneal sections (8-μm thick) were cut using a cryostat (HM 505M; Micron GmbH, Walldorf, Germany). Sections were placed on microscope slides (Superfrost Plus, Fisher Scientific) and maintained at −85°C until staining was performed.
To detect fragmentation of DNA associated with cell death, tissue sections were fixed in acetone at −20°C for 2 minutes, dried at room temperature for 5 minutes, and then placed in balanced salt solution. Fluorescence-based TUNEL assay was performed according to the manufacturer’s instructions (ApopTag, Cat No. S7165; Intergen Co, Purchase, NY). The TUNEL assay detects the ends of fragments of DNA formed during apoptosis or, at times, necrosis.8 Thus, combined apoptosis and necrosis in corneas can be quantitated with this assay by performing counts of stained cells per unit tissue area. Control (unwounded) cornea slides were included in each assay.
Photographs were obtained with a Leica DM 5000 fluorescent microscope equipped with a QImage camera and ImagePro software (Leica Microsystems Inc, Bannockburn, Ill).
The monoclonal antibody for CD11b (DAKO Corp, Carpinteria, Calif), a marker of monocytes, was placed on the sections and incubated at room temperature for 1 hour (anti-CD11b). The working concentration for the CD11b antibody was 85 mg/L (1% BSA, pH 7.4). The secondary antibody for CD11b staining was Alexa Fluor 488 goat anti-rat IgG (Invitrogen Corp) 2 mg/mL diluted 1:100, which was applied for 1 hour at room temperature. Coverslips were mounted with Vectashield containing 4′,6 diamidino-2-phenylindole (DAPI; Vector Laboratories Inc, Burlingame, Calif) to observe all cell nuclei in the tissue.
Cell Counting for Quantitation of Tunel Assay and Immunohistochemistry
For TUNEL assay and immunocytochemistry for CD11b-positive monocytes, all of the stained cells in seven non-overlapping, full-thickness columns extending from the anterior stromal surface to the posterior stromal surface were counted, as previously described.8 The diameter of each column was that of a 400× microscope field. The columns in which counts were performed were selected at random from the central cornea (TUNEL assay) or peripheral cornea at the flap edge where the cut perforated the epithelium (CD11b immunohistochemistry) of each specimen. Care was taken to only count stromal cells, excluding epithelial cells, during dynamic counts at the microscope on tissue sections.
Statistical Analysis
Data were analyzed using statistical software (Statview 4.5; Abacus Concepts, Berkeley, Calif). Variations were expressed as standard errors of the mean. Statistical comparisons among the groups were performed using analysis of variance (ANOVA) with the Bonferroni–Dunn adjustment for multiple comparisons. When the ANOVA normality assumption was incorrect for CD11b data, non-parametric overall group comparisons were performed using the Kruskal-Wallis test with the Mann-Whitney rank sum test for multiple comparisons. All statistical tests were conducted at a significance level of α=.05.
RESULTS
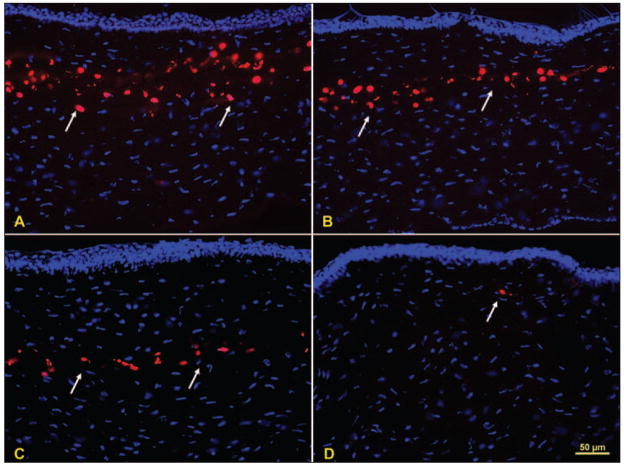
Six eyes were included in each group for both TUNEL-positive and CD11b-positive cell analyses. Figure 1 shows representative results from TUNEL staining in the different groups. The high energy group had significantly more TUNEL-positive cells (31.9±2.9) compared to the intermediate energy group (22.2±0.8, P=.004), low energy group (17.9±1.6, P≤.001), and control group (0.06±0.009, P≤.001). The intermediate and low energy groups had more TUNEL-positive cells than control groups (P≤.001), but the difference between the intermediate energy group and low energy group was not significant (P=.56). Figure 2 and Table 1 show the differences among the groups with respect to TUNEL-positive cells at the 24-hour time point.
Figure 1.
Stromal cell death after femtosecond laser treatment. TUNEL-positive cells (arrows) in the central cornea for the A) high energy 2.7 μJ, B) intermediate energy 1.6 μJ, and C) low energy 0.5 μJ groups, respectively. D) A cell undergoing apoptosis (arrow) in a control cornea, which is a rare event.
Figure 2.
Graph of TUNEL results for the three femtosecond groups and the unwounded control. * indicates results that are different compared to the unwounded control. † indicates that the result for the high energy group is significantly different than the result for the intermediate energy or low energy groups.
TABLE 1.
TUNEL Assay Results in Rabbit Eyes That Underwent 60 kHz IntraLase Femtosecond Treatment
| Group | No. Eyes | Mean±SD | SEM |
|---|---|---|---|
| High energy 2.7μm | 6 | 31.9±7.1 | 2.9 |
| Intermediate energy 1.6 μJ | 6 | 22.2±1.9 | 0.8 |
| Low energy 0.5 μJ | 6 | 17.9±4.0 | 1.6 |
| Control | 6 | 0.06±0.02 | 0.009 |
SD = standard deviation, SEM = standard error of mean
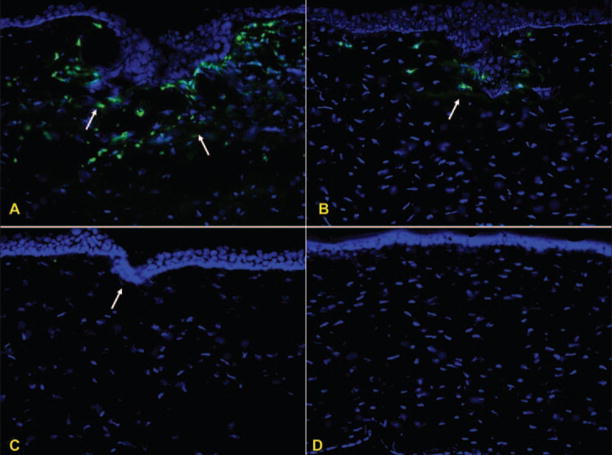
Figure 3 shows the inflammatory cell influx at the flap edge for representative sections from each group. The means for CD11b-positive cells/400× field were 26.2±12.0, 5.8±1.7, 1.7±1.7, and 0.0±0.0 for the high energy, intermediate energy, low energy, and control groups, respectively. Once normality failed for CD11b counts, the non-parametric Kruskal-Wallis one way ANOVA and Mann-Whitney rank sum test were applied for comparisons. Only the intermediate energy group showed statistically more inflammatory cells than control eyes (P=.015) due to variation in inflammatory cell infiltration in the high energy group. These results are shown in Figure 4 and Table 2.
Figure 3.
Inflammatory cell infiltration at the flap edge after femtosecond laser treatment. CD11b-positive cells for A) high energy 2.7 μJ, B) intermediate energy 1.6 μJ, and C) low energy 0.5 μJ groups. D) Unwounded control group.
Figure 4.
Graph of CD11b results for the three femtosecond laser groups and the unwounded control. * indicates a significant difference compared to the unwounded control. The result in the high energy group did not reach significance due to high variability in inflammatory cell infiltration in that group.
TABLE 2.
CD11b Results in Rabbit Eyes That Underwent 60 kHz IntraLase Femtosecond Treatment
| Groups | No. Eyes | Mean±SD | SEM |
|---|---|---|---|
| High energy 2.7 μJ | 6 | 26.1±29.3 | 11.9 |
| Intermediate energy 1.6 μJ | 6 | 5.8±4.1 | 1.6 |
| Low energy 0.5 μJ | 6 | 1.6±4.1 | 1.6 |
| Control | 6 | 0.005±0.01 | 0.005 |
SD = standard deviation, SEM = standard error of mean
DISCUSSION
The results of this study demonstrate that higher energy levels with the 60 kHz, Model II, IntraLase femtosecond laser result in more stromal cell death and greater stromal inflammatory cell influx at 24 hours after surgery. This time point was used because our previous study demonstrated that this was the optimal time after surgery to study both stromal cell death and inflammatory cell infiltration. Our previous study used transmission electron microscopy to show that stromal cell death after femtosecond flap formation is mediated by necrosis, even though it is detected by the TUNEL assay.8 The findings of this study regarding the femtosecond laser directly triggering keratocyte necrosis are likely to be generalized to other models of femtosecond lasers, and contrast with the results with microkeratomes, which primarily trigger keratocyte apoptosis in the first few hours to a day following surgery.8
Some variability in results was noted between different eyes with a particular treatment. Thus, for CD11b-positive monocytic cells in the high energy (2.7 μJ) group, the difference compared to the control did not reach statistical significance due to high variability in inflammatory cell infiltration in this analysis. This variability mandated a non-parametric evaluation of the data with respect to this parameter. However, some corneas in the high energy group had high inflammation and statistical significance would likely have been found if a larger number of eyes were included in both groups. Thus, this study confirms the results of previous studies performed in our laboratory with the 15 kHz, 30 kHz, and 60 kHz models,8 where we extrapolated results with the different models to conclude that laser energy level was an important factor in cell death and inflammatory cell infiltration with an individual laser.
Two major triggers of inflammation must be considered to optimize flap formation with femtosecond laser technology.8 The first trigger is the number of stromal cells that undergo necrosis as a direct result of the stromal laser ablation. Cell necrosis and release of intra-cellular components into the tissue has a direct chemotactic effect on inflammatory cells and may trigger surrounding surviving cells to produce chemokines to augment inflammatory cell infiltration. The second trigger of inflammation is the extent of damage to the corneal epithelium produced by the side cut. Damage to corneal epithelial cells results in the release of pro-inflammatory cytokines, such as interleukin-1, that not only attract inflammatory cells directly, but also bind to receptors on surviving keratocytes and stimulate the release of chemokines, such as monocyte chemotactic and inflammatory cell factor, that attract inflammatory cells from limbal blood vessels and the tear film.9,10 Earlier models of the IntraLase femtosecond laser, especially the 15 kHz and earlier models, not only used higher energy levels, but also used a pulse geometry that produced a larger width cut through the epithelium around the perimeter of the flap. This created a flap edge that was easier for the surgeon to visualize at the operating microscope, but resulted in greater epithelial damage, greater release of epithelial-derived cytokines, greater production of keratocyte-derived chemokines, and greater inflammatory cell infiltration, especially at the flap edge, although central diffuse lamellar keratitis was seen in some patients’ eyes in the early postoperative period with this early femtosecond laser model.8
Many studies have compared clinical results of LASIK performed with the femtosecond laser to LASIK performed with microkeratomes. Some studies have noted benefits to the laser technology with regards to parameters such as reduction in intraoperative complications (eg, the incidence of thin, irregular, or do-nut-shaped flaps), better outcomes in reducing, or at least maintaining, optical aberrations, and greater predictability of flap thickness.1–6,11,12 The present study indicates that inflammatory and wound healing differences between LASIK performed with the femtosecond laser and microkeratome can be minimized with careful choice of laser energy settings.
At the low end of the energy range with the femtosecond laser, from 0.7 to 1.6 μJ, only small differences were noted in cell death and inflammatory cell infiltration in the animal model. This has also been our observation in patients undergoing LASIK with the 60 kHz IntraLase laser (S.E. Wilson and W. Medeiros, unpublished data, 2007). Our approach is to use the lowest energy level within this range, for both the lamellar cut and side cut, that yields a flap that is relatively easy to lift. With our particular femtosecond laser, this is approximately 1.0 μJ for each cut, but this parameter must be established for each individual laser as variability exists from unit to unit. At this relatively low energy level, it is only necessary to use corticosteroids (eg, 1% prednisolone acetate) four times a day to control inflammation, unless the epithelium is damaged during the procedure or blood is retained in the interface. Thus, with improvements to the femtosecond laser and refinement in energy selection, postoperative corticosteroid treatment has become identical to what we use in LASIK performed with the microkeratome.
Acknowledgments
Supported in part by US Public Health Service grants EY10056 and EY15638 from National Eye Institute, National Institutes of Health, Bethesda, Md and Research to Prevent Blindness, New York, NY. Dr Wilson is the recipient of a Research to Prevent Blindness Physician-Scientist Award.
Footnotes
The authors have no proprietary or financial interest in the materials presented herein.
References
- 1.Mian SI, Shtein RM. Femtosecond laser-assisted corneal surgery. Curr Opin Ophthalmol. 2007;18:295–299. doi: 10.1097/ICU.0b013e3281a4776c. [DOI] [PubMed] [Google Scholar]
- 2.Montés-Micó R, Rodríguez-Galietero A, Alió JL. Femtosecond laser versus mechanical keratome LASIK for myopia. Ophthalmology. 2007;114:62–68. doi: 10.1016/j.ophtha.2006.07.019. [DOI] [PubMed] [Google Scholar]
- 3.Stonecipher K, Ignacio TS, Stonecipher M. Advances in refractive surgery: microkeratome and femtosecond laser flap creation in relation to safety, efficacy, predictability, and biomechanical stability. Curr Opin Ophthalmol. 2006;17:368–372. doi: 10.1097/01.icu.0000233957.88509.2d. [DOI] [PubMed] [Google Scholar]
- 4.Kezirian GM, Stonecipher KG. Comparison of the IntraLase femtosecond laser and mechanical keratomes for laser in situ keratomileusis. J Cataract Refract Surg. 2004;30:804–811. doi: 10.1016/j.jcrs.2003.10.026. [DOI] [PubMed] [Google Scholar]
- 5.Binder PS. Flap dimensions created with the IntraLase FS laser. J Cataract Refract Surg. 2004;30:26–32. doi: 10.1016/S0886-3350(03)00578-9. [DOI] [PubMed] [Google Scholar]
- 6.Medeiros FW, Stapleton WM, Hammel J, Krueger RR, Netto MV, Wilson SE. Wavefront analysis comparison of LASIK outcomes with the femtosecond laser and mechanical microkeratomes. J Refract Surg. 2007;23:880–887. doi: 10.3928/1081-597X-20071101-03. [DOI] [PubMed] [Google Scholar]
- 7.Kim JY, Kim MJ, Kim TI, Choi HJ, Pak JH, Tchah H. A femtosecond laser creates a stronger flap than a mechanical microkeratome. Invest Ophthalmol Vis Sci. 2006;47:599–604. doi: 10.1167/iovs.05-0458. [DOI] [PubMed] [Google Scholar]
- 8.Netto MV, Mohan RR, Medeiros FW, Dupps WJ, Jr, Sinha S, Krueger RR, Stapleton WM, Rayborn M, Suto C, Wilson SE. Femtosecond laser and microkeratome corneal flaps: comparison of stromal wound healing and inflammation. J Refract Surg. 2007;23:667–676. doi: 10.3928/1081-597x-20070901-05. [DOI] [PMC free article] [PubMed] [Google Scholar]
- 9.Hong JW, Liu JJ, Lee JS, Mohan RR, Mohan RR, Woods DJ, He YG, Wilson SE. Proinflammatory chemokine induction in keratocytes and inflammatory cell infiltration into the cornea. Invest Ophthalmol Vis Sci. 2001;42:2795–2803. [PubMed] [Google Scholar]
- 10.Wilson SE, Mohan RR, Netto M, Perez V, Possin D, Huang J, Kwon R, Alekseev A, Rodriguez-Perez JP. RANK, RANKL, OPG, and M-CSF expression in stromal cells during corneal wound healing. Invest Ophthalmol Vis Sci. 2004;45:2201–2211. doi: 10.1167/iovs.03-1162. [DOI] [PubMed] [Google Scholar]
- 11.Javaloy J, Vidal MT, Abdelrahman AM, Artola A, Alió JL. Confocal microscopy comparison of IntraLase femtosecond laser and Moria M2 microkeratome in LASIK. J Refract Surg. 2007;23:178–187. doi: 10.3928/1081-597X-20070201-10. [DOI] [PubMed] [Google Scholar]
- 12.Talamo JH, Meltzer J, Gardner J. Reproducibility of flap thickness with IntraLase FS and Moria LSK-1 and M2 microkeratomes. J Refract Surg. 2006;22:556–561. doi: 10.3928/1081-597X-20060601-07. [DOI] [PubMed] [Google Scholar]


