Abstract
Members of the cytochrome P450 (P450) enzyme families CYP1, CYP2, and CYP3 are responsible for the metabolism of approximately 75% of all clinically relevant drugs. With the increased prevalence of nonalcoholic fatty liver disease (NAFLD), it is likely that patients with this disease represent an emerging population at significant risk for alterations in these important drug-metabolizing enzymes. The purpose of this study was to determine whether three progressive stages of human NALFD alter hepatic P450 expression and activity. Microsomes isolated from human liver samples diagnosed as normal, n = 20; steatosis, n = 11; nonalcoholic steatohepatitis (NASH) (fatty liver), n = 10; and NASH (no longer fatty), n = 11 were analyzed for P450 mRNA, protein, and enzyme activity. Microsomal CYP1A2, CYP2D6, and CYP2E1 mRNA levels were decreased with NAFLD progression, whereas CYP2A6, CYP2B6, and CYP2C9 mRNA expression increased. Microsomal protein expression of CYP1A2, CYP2C19, CYP2D6, CYP2E1, and CYP3A4 tended to decrease with NAFLD progression. Likewise, functional activity assays revealed decreasing trends in CYP1A2 (p = 0.001) and CYP2C19 (p = 0.05) enzymatic activity with increasing NAFLD severity. In contrast, activity of CYP2A6 (p = 0.001) and CYP2C9 (diclofenac, p = 0.0001; tolbutamide, p = 0.004) was significantly increased with NAFLD progression. Increased expression of proinflammatory cytokines tumor necrosis factor α and interleukin 1β was observed and may be responsible for observed decreases in respective P450 activity. Furthermore, elevated CYP2C9 activity during NAFLD progression correlated with elevated hypoxia-induced factor 1α expression in the later stages of NAFLD. These results suggest that significant and novel changes occur in hepatic P450 activity during progressive stages of NAFLD.
The cytochrome P450 (P450) enzyme family of heme-containing proteins represents one of the largest and most functionally diverse superfamilies found in nature (Nelson et al., 1993). The main function of P450s is to facilitate the biotransformation of compounds by addition of functional groups suitable for conjugation and ultimate elimination from the organism (Danielson, 2002). Fifty-seven genes and five pseudogenes have been identified in the human genome, and together these enzymes are responsible for the metabolism of thousands of endogenous and xenobiotic substrates, including environmental pollutants, pharmaceuticals, steroids, prostaglandins, and fatty acids (Nelson et al., 2004). Although P450 expression occurs in a number of organs, including the intestine, lung, kidney, and heart (Wheeler and Guenthner, 1990; Guengerich, 1994; Kolars et al., 1994; Zordoky and El-Kadi, 2008), the highest concentration of most P450s responsible for drug metabolism is in the liver (Krishna and Klotz, 1994; Pelkonen et al., 2008). Members of the CYP1, CYP2, and CYP3 families are best known for their crucial involvement in Phase I drug metabolism and account for the biotransformation of approximately 75% of all known therapeutic drugs in humans (Danielson, 2002; Guengerich, 2008). Therefore, much of the research on P450s has been focused on the regulation, expression, and activity of the major drug-metabolizing hepatic enzymes in humans, specifically CYP1A2, CYP2C isoforms, CYP2D6, CYP2E1, and CYP3A4.
Differences in P450 expression, along with significant interindividual variation in drug metabolism, have been reported in humans. Because of this, it is of utmost importance to fully understand the factors responsible for the regulation of P450s. In normal human livers, genetic polymorphisms, endocrine imbalance, poor diet, and environmental factors can influence the expression of P450s (George et al., 1995a; Frye et al., 2006). Occurrence of one or more of these factors can predispose a patient to altered P450 metabolism and unwanted/negative consequences associated with standard doses of a drug.
Chronic liver disease is another factor that has been reported to impair P450 drug metabolism in patients (Villeneuve and Pichette, 2004). Studies on altered hepatic P450 function have been reported in patients with cholestasis, hepatitis B and C, alcoholic liver disease, and cirrhosis (George et al., 1995a; Yang et al., 2003; Tsunedomi et al., 2005; Frye et al., 2006; Li et al., 2006b). However, interpretations of the effect of specific diseases have been limited as patients with different types of liver diseases were often placed into a single category. In addition, in vitro studies of P450 activity in human liver samples from patients with liver disease have yielded conflicting results that have led some to postulate whether regulation of these enzymes may be disease-specific (Guengerich and Turvy, 1991; Lown et al., 1992; Lucas et al., 1993). More recently, it has been suggested that the severity of liver disease, rather than specific disease state, correlates with the extent of altered P450 metabolism (Frye et al., 2006).
Nonalcoholic fatty liver disease (NAFLD) is a condition that has received increased attention during the past 2 decades. Currently, NAFLD is the most prevalent liver disease in the United States, representing 20 to 30% of all liver disease cases (Bedogni et al., 2005). With obesity and obesity-related conditions (insulin resistance, dyslipidemia, and high blood pressure) identified as predisposing conditions, the occurrence of NAFLD is increasing as well (Huang et al., 2007; Targher et al., 2008). NAFLD composes a spectrum of etiologies ranging from simple fatty liver (steatosis) to the more severe nonalcoholic steatohepatitis (NASH). The proposed mechanism for progression of NAFLD involves a two-hit theory where lipid accumulation in hepatocytes (the “first hit”) is followed by a “second hit,” including insulin resistance, oxidative stress, and cytokine production (Bellentani et al., 2004). Therefore, the goal of the current study was to determine the effect of progressive stages of NAFLD on hepatic P450 expression and function in human tissue.
Materials and Methods
Human Liver Specimens.
Samples of frozen and formalin-fixed, paraffin-embedded adult explant livers [normal, n = 20; steatosis, n = 11; NASH (fatty liver), n = 10; NASH (no longer fatty), n = 11] were obtained from the Liver Tissue Cell Distribution System at the University of Minnesota, Virginia Commonwealth University, and the University of Pennsylvania. Histological slides were diagnosed using criteria from a scoring system for human NAFLD (Kleiner et al., 2005). Steatotic liver was diagnosed when >10% of hepatocytes showed fat deposition. NASH with fatty liver diagnosis was defined as having marked inflammation, fibrosis, and >5% of hepatocytes with fat deposition. NASH no longer fatty liver was diagnosed by marked inflammation, fibrosis, and <5% of hepatocytes with fat deposition. Diagnosis was first established by a Liver Tissue Cell Distribution System medical pathologist and confirmed by histological examination at the University of Arizona in a blinded fashion. Information on donors, including age and gender, can be seen in Supplemental Data Table 1.
Total RNA Isolation and Reverse Transcription.
Approximately 50 mg of each human liver sample was homogenized in 3 ml of Nucleic Acid Purification Lysis Solution (Applied Biosystems, Foster City, CA). Total RNA was isolated from each sample using the Applied Biosystems 6100 Nucleic Acid Prepstation. For reverse transcription, approximately 200 ng of total RNA from each sample was converted to cDNA following the manufacturer protocol for the Applied Biosystems High Capacity cDNA Archive Kit.
Quantitative Reverse Transcription-Polymerase Chain Reaction (TaqMan) Analysis.
CYP1A2, CYP2A6, CYP2B6, CYP2C8, CYP2C9, CYP2C19, CYP2D6, CYP2E1, and CYP3A4 cDNA from human liver samples was analyzed using gene-specific TaqMan primer/probe sets (Applied Biosystems). Reactions with the specific primer/probes for glyceraldehyde-3-phosphate dehydrogenase (GAPDH) were analyzed as an endogenous control for P450 expression. Amplifications were performed on an ABI 7900HT real-time polymerase chain reaction system (Applied Biosystems) in relative quantification mode for 40 amplification cycles using standard conditions for TaqMan-based assays. Threshold cycle (CT) determinations were performed by the ABI 7900HT system software for both P450 and GAPDH gene. Relative-fold mRNA content was determined for each sample relative to the endogenous control gene expression (GAPDH) using the relationship: Relative-fold mRNA Content = 2−ΔΔCt.
Human Liver Microsome Isolation.
Human liver samples (∼300 mg) were homogenized in 3 ml of buffer A (50.00 mM Tris-HCl, 1.00 mM EDTA, and 154.00 mM KCl, pH 7.4) with a Dounce homogenizer. Homogenate was centrifuged at 10,000g for 30 min at 4°C, and the supernatant was collected. After centrifugation at 100,000g for 60 min at 4°C, the supernatant was discarded, and the pellet was resuspended in 600 μl of buffer B (100.0 mM sodium pyrophosphate and 0.1 mM EDTA, pH 7.4). Samples in buffer B were centrifuged at 100,000g for 60 min at 4°C. The supernatant was resuspended in 300 μl of buffer C (10.0 mM KPO4, 1.0 mM EDTA, and 20.0% glycerol, pH 7.4) and stored at −80°C until analysis.
Western Blot Analysis of Microsomal P450 Levels.
Microsomal protein concentrations were determined using a Bio-Rad Protein Assay Reagent Kit (Bio-Rad Laboratories, Hercules, CA) as described by the manufacturer. Microsomal protein levels of P450s and GAPDH (loading control) were determined using a mouse monoclonal antibody specific for human CYP1A2 (Abcam Inc., Cambridge, MA), polyclonal rabbit anti-human CYP2A6, CYP2B6, CYP2C8, CYP2D6, CYP3A4, and CYP2E1 (XenoTech LLC, Lenexa, KS), CYP2C9 and CYP2C19 (Fitzgerald Industries International Inc., Concord, MA), and a monoclonal rabbit anti-GAPDH antibody (Cell Signaling Technology, Inc., Danvers, MA). Microsomes (10 μg/well) or 10 μg of respective recombinant human P450 protein (BD Gentest from BD Biosciences, San Jose, CA) was separated by SDS-polyacrylamide gel electrophoresis as previously reported (Augustine et al., 2008). Quantification of relative protein expression was determined using image processing and analysis with Image J in JAVA (National Institutes of Health, Bethesda, MD) and normalized to respective GAPDH protein expression.
P450 Enzymatic Activity Determination.
Microsomal activities for human CYP1A2, CYP2A6, CYP2B6, CYP2C8, CYP2C9, CYP2C19, CYP2D6, CYP2E1, and CYP3A4/5 were determined using specific marker substrates according to established procedures listed in Supplemental Data Table 2. Human liver microsomes (∼0.01–0.04 mg/ml) incubated at 37°C in potassium phosphate buffer (100 mM, pH 7.4), NADPH (1 mM), and substrate were added to each incubation in methanol or acetonitrile so that the final solvent concentration was 0.1%. Reactions were started by addition of NADPH and stopped after indicated time points by addition of organic solvent. The amount of product formed was quantified using validated liquid chromatography/tandem mass spectrometry methodologies. In each analytical run, at least six calibration standards and 12 quality control samples (at three different concentration levels) were used to ensure the quality of the analytical run.
Statistics.
P450 and other expression levels are continuous outcomes with skewed distribution. This asymmetry suggests that median rather than mean values should be compared. Therefore, graphs in this manuscript show box-whisker plots rather than mean values with error bars. The disease groups examined in the current study can be ordered by their severity: normal < steatosis < NASH with fatty liver < NASH no longer fatty. We initially performed two-sample comparisons between each disease state and normal using the Wilcoxon rank-sum test. This is the appropriate alternative to the two-sample t test when skewed continuous outcomes exist in samples of modest size. For comparing all the groups together, we performed a nonparametric test for trend (Cuzick, 1985) rather than using analysis of variance, which assumes unordered categories. Thus, instead of simply looking for differences between categories, we used the more appropriate and logical approach of testing whether expression levels increased or decreased consistently over the ordered disease states. Under Results, NAFLD progression refers to increasing severity of disease state. A significance level of 0.05 was used.
Immunohistochemical Staining of Paraffin-Embedded Liver Samples.
Formalin-fixed sections of paraffin-embedded livers were deparaffinized in xylenes and rehydrated through a graded alcohol series. Antigen retrieval was performed by incubating slides in citrate buffer (10 mM) for 10 min in a Kenmore 1200-W microwave set (Sears Roebuck and Co.) on defrost, and endogenous peroxidase activity was blocked with 3% (v/v) H2O2 for 10 min at room temperature. Deparaffinized sections were incubated overnight with either a rabbit polyclonal interleukin 1β (IL-1β) antibody (H-153; Santa Cruz Biotechnology, Inc., Santa Cruz, CA), mouse monoclonal tumor necrosis factor α (TNFα), or mouse monoclonal hypoxia-induced factor 1α (HIF-1α) (Abcam Inc.) diluted 1:50 in phosphate-buffered saline. Protein-antibody complexes were visualized using the Vectastain Elite ABC kit and developed with 3,3′-diaminobenzidine as per manufacturer's protocol (Vector Laboratories, Burlingame, CA). Negative control staining of human liver sections was performed by incubating without primary antibody.
Results
Histopathology of Human Livers with Progressive Stages of NAFLD.
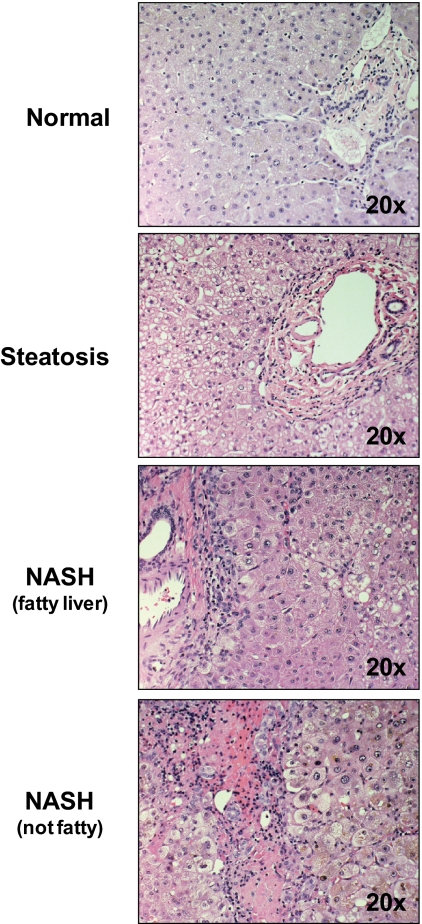
Hematoxylin and eosin staining of donor livers was used to assess the severity of NAFLD. Representative images of hematoxylin and eosin-stained livers from normal, steatotic, NASH with fatty liver, and NASH no longer fatty can be seen in Fig. 1.
Fig. 1.
Histological staining of progressive stages of NAFLD. Hematoxylin and eosin-stained slides of human liver donor samples were diagnosed histologically using a previously established NAS scoring system. Livers were identified as normal, steatosis (>10% hepatocyte with fat deposition), NASH with fatty liver (inflammation, fibrosis, and >5% hepatocytes with fat deposition) or NASH no longer fatty (inflammation, fibrosis, and <5% hepatocytes with fat deposition). All of the representative images are shown at 20× magnification.
Hepatic P450 mRNA Expression during NAFLD Progression.
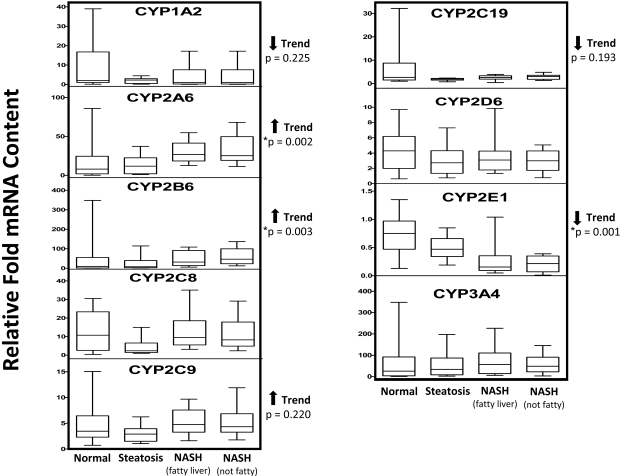
There were decreasing trends of CYP1A2 and CYP2C19 mRNA expression associated with progressive stages of NAFLD (p values of 0.225 and 0.193, respectively); however, these trends were not statistically significant (Fig. 2). CYP2E1 mRNA expression showed a statistically significant decreasing trend (p = 0.001) with NAFLD progression. Conversely, CYP2C9 mRNA expression tended to increase with NAFLD progression but did not reach statistical significance (p = 0.220). Likewise, CYP2A6 and CYP2B6 mRNA expression significantly increased with NAFLD progression, with p values of 0.002 and 0.003, respectively. NAFLD progression had little effect on CYP2C8, CYP2D6, or CYP3A4 mRNA expression levels.
Fig. 2.
Hepatic P450 mRNA content in progressive stages of NAFLD. Relative mRNA content of hepatic P450s was determined for all the samples (normal, n = 20; steatosis, n = 11; NASH with fatty liver, n = 10; NASH no longer fatty, n = 11) by quantitative real-time polymerase chain reaction. Relative-fold mRNA content was determined for each sample relative to the endogenous control gene expression (GAPDH) using the relationship: Relative-fold mRNA content = 2−ΔΔCT. Arrows indicate an increasing or decreasing trend in relative mRNA content with respect to NAFLD progression as determined by nonparametric test for trend. Asterisks indicate statistically significant trend as determined by nonparametric test for trend (p < 0.05).
Microsomal P450 Protein Expression in Progressive Stages of NAFLD.
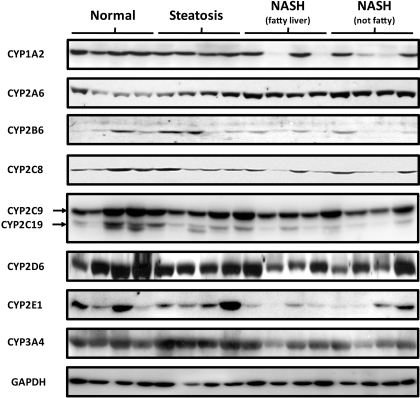
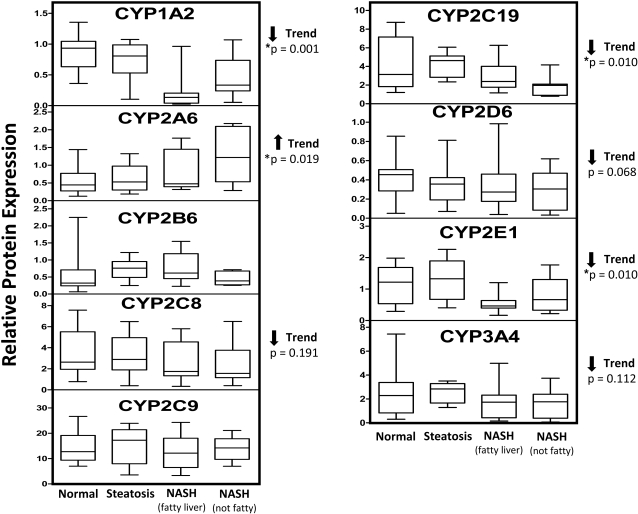
Representative Western blots of microsomal CYP1A2, CYP2A6, CYP2B6, CYP2C8, CYP2C9/19, CYP2D6, CYP2E1, CYP3A4, and GAPDH are shown in Fig. 3. In addition, relative protein expression of P450s for all the donor samples was determined by densitometry and normalized to GAPDH expression and is seen in Fig. 4. Similar to mRNA expression, CYP2A6 protein expression was significantly increased with NAFLD progression (p = 0.019). CYP2C8, CYP2D6, and CYP3A4 protein expression tended to decrease with progression of NAFLD (p values of 0.191, 0.068, and 0.112, respectively); however, this trend was not statistically significant. CYP1A2 (p = 0.0001), CYP2C19 (p = 0.01), and CYP2E1 (p = 0.01) protein levels significantly decreased with NAFLD progression.
Fig. 3.
Representative microsomal P450 protein expression in progressive stages of NAFLD. Ten micrograms of normal, steatosis, NASH with fatty liver, or NASH no longer fatty microsomal protein was resolved by SDS-polyacrylamide gel electrophoresis. Antibodies specific for respective P450s or GAPDH were used to identify protein expression of representative individuals from each diagnosis group. The same individuals were used for each P450.
Fig. 4.
Quantification of microsomal P450 protein expression in progressive stages of NAFLD. After Western blot identification of P450 protein levels, densitometry values of all the samples (normal, n = 20; steatosis, n = 11; NASH with fatty liver, n = 10; NASH no longer fatty, n = 11) were normalized to respective GAPDH densitometry values. Arrows indicate an increasing or decreasing trend in protein expression with respect to NAFLD progression as determined by nonparametric test for trend. Asterisks indicate statistically significant trend as determined by nonparametric test for trend (p < 0.05).
Microsomal P450 Enzyme Activity during NAFLD Progression.
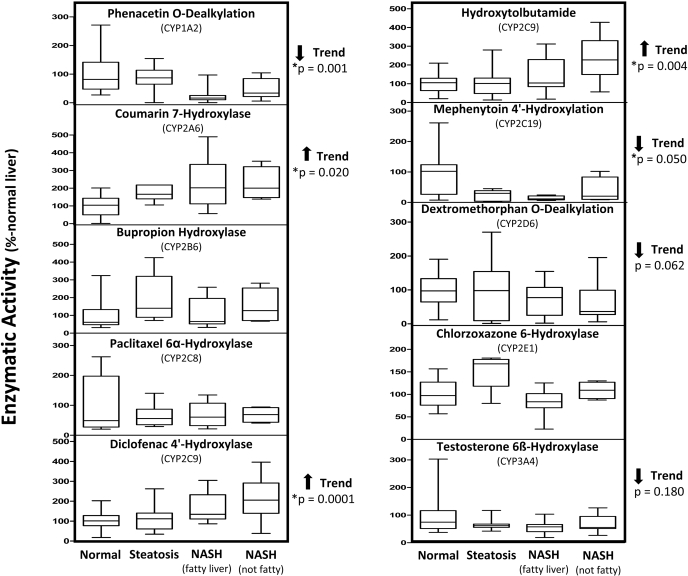
Phenacetin O-dealkylation by CYP1A2 significantly decreased (p = 0.001) as the severity of NAFLD increased (Fig. 5). Similar to CYP1A2, there was a decreased rate of CYP2C19-mediated mephenytoin 4′-hydroxylation with NAFLD progression (p = 0.05). CYP2D6 and CYP3A4 activity toward dextromethorphan and testosterone, respectively, also displayed a decreasing trend with NAFLD progression (p values of 0.062 and 0.18), but these trends did not reach statistical significance. In contrast, CYP2A6 hydroxylation of coumarin was significantly increased with NAFLD progression (p = 0.02). Finally, the enzymatic activity of CYP2C9 was determined using two specific substrates of this enzyme. CYP2C9 enzyme activity, determined by diclofenac 4′-hydroxylase and hydroxytolbutamide metabolite formation, was significantly increased with NAFLD progression, with p values of 0.0001 and 0.004, respectively.
Fig. 5.
Enzymatic activity of microsomal P450s in progressive stages of NAFLD. Human microsomes were incubated with specific enzyme substrates. Enzymatic activity was determined by quantification of respective substrate metabolite formation using liquid chromatography/tandem mass spectrometry methodologies; data are expressed as percentage of normal liver P450 activity. Arrows indicate an increasing or decreasing trend in protein expression with respect to NAFLD progression as determined by nonparametric test for trend. Asterisks indicate significant trend as determined by nonparametric test for trend (p < 0.05).
Results of Two-Group Comparisons between Each Disease State and Normal.
The rank-sum tests did not reveal statistically significant differences between each disease state considered separately versus normal. Given the modest sample size and the high degree of variability observed in the outcomes, this was not unexpected. However, separate consideration of each disease state discards important information available from the inherent ordering of the disease states. Statistical analysis for trends across ordered categories has the greater power to detect systematic differences than two-sample tests. Thus, the balance of the analyses focused on the use of a nonparametric trend test (Cuzick, 1985) to detect such systematic changes in outcome as a function of NAFLD progression.
Immunohistochemical Staining of HIF-1α during NAFLD Progression.
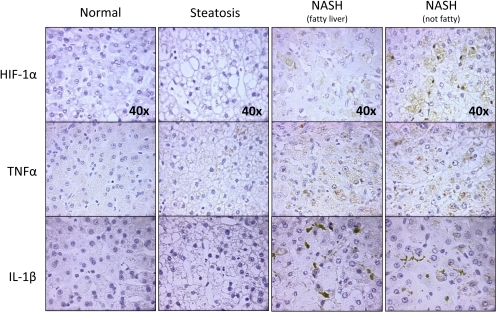
To determine whether NAFLD induces hypoxia, immunohistochemical staining of donor livers from normal and progressive stages of NAFLD was used to identify expression of known markers, specifically, HIF-1α. Although staining was not observed in normal livers (Fig. 6), and only moderate staining was observed in steatotic livers, there was pronounced HIF-1α expression in the cytosol of NASH fatty liver samples and both cytosolic and nuclear staining in NASH no longer fatty liver samples, suggesting that hypoxia occurs in the later stages of NAFLD.
Fig. 6.
HIF-1α, TNFα, and IL-1β expression in progressive stages of NAFLD. Immunohistochemical staining was performed on formalin-fixed paraffin-embedded liver sections from normal, steatosis, NASH with fatty liver, and NASH no longer fatty liver. Tissues were counterstained with hematoxylin, and images of all the groups were taken 40× magnification.
Immunohistochemical Staining of Proinflammatory Cytokines in Progressive Stages of NAFLD.
Little to no cytokine staining was observed in normal or steatotic liver tissue (Fig. 6). However, there was marked increased expression of TNFα and IL-1β in both stages of NASH, strongly suggesting the presence of inflammation in these stages of NAFLD.
Discussion
P450s have been shown to be particularly susceptible to alterations in expression and activity (Frye et al., 2006). Decreased P450 enzymatic activity can potentially lead to reduced metabolism of therapeutics, ultimately leading to increased bioavailability and possible toxicity. Conversely, increased activity of hepatic P450s present the potential to increase the metabolism of known substrates, thereby decreasing their pharmacotherapeutic effect or increasing the generation of reactive metabolites and oxidative stress. The aim of the current study was to determine whether expression and function of the major drug-metabolizing P450s are altered in human livers diagnosed with progressive stages of NAFLD. To our knowledge, this is the first report of P450 enzyme expression and activity in progressive stages of human NAFLD.
Previous studies have reported up to a 50% decrease in hepatic CYP1A2 protein levels in cirrhotic liver patients when compared with normal liver (George et al., 1995b; Congiu et al., 2002). Guengerich and Turvy (1991) noted similar findings in CYP1A2 immunohistochemical staining of livers with sclerosing cholangitis and cirrhosis. CYP1A2 metabolic activity has also been shown to be decreased in primary biliary cirrhosis, alcoholic steatohepatitis, and cirrhotic patients as seen by reduced clearance of known substrates antipyrine, theophylline, and caffeine (Bechtel et al., 2000; Lelouët et al., 2001; Villeneuve and Pichette, 2004). Although we report only a slight downward trend in mRNA expression of CYP1A2, the protein (p = 0.0001) and enzyme activity levels (p = 0.001) were significantly decreased with NAFLD progression. CYP1A2 has been reported to be significantly decreased in the presence of proinflammatory cytokines TNFα and IL-1β (Zhou et al., 2008) and may explain decreased expression and function in the current study.
CYP2A6 plays a role in the metabolism of several clinically relevant drugs, including halothane, disulfiram, and valproic acid (Raunio et al., 2001). In the current study, we show that mRNA (p = 0.002), protein (0.019), and enzyme activity (p = 0.020) of CYP2A6 increased with progressive stages of NAFLD. Significantly elevated levels of CYP2A6 enzymatic activity have been reported in patients with hepatitis, primary biliary cirrhosis, and alcoholic cirrhosis (Kirby et al., 1996; Bechtel et al., 2000; Lelouët et al., 2001). In addition, induction of CYP2A5, the mouse ortholog of human CYP2A6, has been shown to be induced during oxidative injury to the endoplasmic reticulum, as well as during altered redox status (Gilmore et al., 2003; Nichols and Kirby, 2008). It is well documented that oxidative stress occurs in NAFLD patients, as shown by NASH patients who show significantly increased systemic levels of lipid peroxidation products (Chalasani et al., 2004; Videla et al., 2004). Therefore, it is possible that oxidative stress induced during NAFLD plays a role in the increased CYP2A6 expression and activity reported in this study.
CYP2C9 is generally accepted as the second-most abundant P450 in the human liver and is responsible for the metabolism of a number of clinically relevant drugs substrates, including S-warfarin, losartan, rosiglitazone, fluoxetine, and tamoxifen (Danielson, 2002). Hepatic CYP2C9 mRNA expression showed an increasing trend with progressive stages of NAFLD (p = 0.220); however, there was little overall change in protein expression between samples. Nevertheless, CYP2C9 metabolism of diclofenac was significantly increased with the severity of NAFLD (p = 0.0001). To verify these results, CYP2C9 enzymatic activity was also determined using a second high affinity substrate, tolbutamide. Similar to diclofenac, hydroxytolbutamide formation by CYP2C9 significantly increased with progressive states of NAFLD (p = 0.004).
Several studies have shown that CYP2C9 activity is increased during hypoxia, potentiating metabolism of arachidonic acid into 11,12-epoxyeicosatrienoic acid (Michaelis et al., 2005). 11,12-Epoxyeicosatrienoic acid in turn attenuates vascular smooth muscle cell hyperpolarization and resultant vasoconstriction during acute and chronic hypoxic conditions (Earley et al., 2003). Although no data are available with regard to hypoxia in cases of NAFLD, an experimental model of ethanol-induced steatohepatitis in rats showed a significant increase in HIF-1α expression in hepatocytes (Li et al., 2006a). In an attempt to explain the observed increase in CYP2C9 activity, we investigated the possibility of hypoxia occurring during NAFLD progression. Figure 6 shows increased cytosolic expression of HIF-1α in NASH with fatty liver samples, whereas both cytosolic expression and nuclear accumulation of HIF-1α was observed in NASH no longer fatty samples. The increased expression and nuclear localization of HIF-1α suggest that hypoxia occurs in the later stages of NAFLD and provides a plausible mechanism for the elevated CYP2C9 activity reported in the current study.
CYP2C19 has been identified as one of the more sensitive P450s to the presence of liver diseases such as hepatocellular carcinoma, hepatitis C, and chronic hepatitis and cirrhosis (Ohnishi et al., 2005; Frye et al., 2006). In addition, it has also been shown to be affected earlier than the other important drug-metabolizing P450s (Villeneuve and Pichette, 2004). Results in the current study support these observations as the protein expression (p = 0.010) and enzymatic activity (p = 0.05) showed statistically significant decreases with progressive states of NAFLD.
Hepatic CYP2C8 mRNA and enzyme activity appeared unaffected by different stages of the disease. It is interesting to note that although CYP2C8 expression and activity remained relatively constant with NAFLD progression, two other relevant members of this subfamily were alternately affected by NAFLD, with increased CYP2C9 activity and decreased CYP2C19 activity. The alternative regulation of CYP2C enzymes observed in this study have not been reported in other liver diseases and warrant further investigation to determine whether these changes are specific to NAFLD.
In addition to CYP1A2 and CYP2C19, CYP3A4 regulation and expression have been reported to be particularly sensitive to other liver diseases; however, its activity can selectively change with different disease states (Villeneuve and Pichette, 2004). A study by Yang et al. (2003) reported that CYP3A4 activity was significantly altered in patients with cirrhosis yet remained unchanged by obstructive jaundice. In the current study CYP3A4 mRNA expression was not different between disease groups, but CYP3A4 protein expression and activity showed decreasing trends with respect to the severity of NAFLD (p = 0.112 and p = 0.180, respectively). Although those trends did not reach statistical significance, they do seem to indicate that CYP3A4 expression and activity may be decreased with the progression of NAFLD.
CYP2E1 mRNA and protein expression significantly decreased with NAFLD progression, whereas CYP2E1 metabolism of chlorzoxazone was unaltered by NAFLD progression. The finding that CYP2E1 mRNA and protein decrease during NAFLD conflicts with previously published data, which noted increases in livers from patients with NAFLD (Weltman et al., 1998; Chtioui et al., 2007).
In the current study we report that a number of the major hepatic drug-metabolizing P450s are differentially regulated in progressive stages of NAFLD. The expression and activity of CYP1A2, CYP2C19, CYP2D6, and CYP3A4 tended to decrease with increasing severity of NAFLD. However, CYP2A6 and CYP2C9 enzyme activity was significantly increased with progressive stages of NAFLD. With the incidence of NAFLD increasing at an alarming rate, the effect of this disease on major drug-metabolizing enzymes is of critical importance. The current study offers a comprehensive analysis of the major hepatic P450 expression and activity in three progressive stages of NAFLD and may provide a valuable framework for physicians when determining the pharmacotherapeutic options and dosing regimens to patients with this disease.
Supplementary Material
Acknowledgments.
We thank the National Institutes of Health-sponsored Liver Tissue and Cell Distribution System for providing continuous support during almost 2 years of collecting liver samples from patients with various stages of NAFLD. We also thank Marion Namenwirth (University of Minnesota), Melissa Thompson (Virginia Commonwealth University), and Dr. Steven Strom and Kenneth Dorko (University of Pittsburgh).
 The online version of this article (available at http://dmd.aspetjournals.org) contains supplemental material.
This work was supported in part by the National Institutes of Health National Institute of Environmental Health Sciences [Grant ES007091]; the National Institutes of Health National Institute of Diabetes and Digestive and Kidney Diseases [Grant DK068039]; and the National Institutes of Health National Center for Complementary and Alternative Medicine [Grant AT002842]. The Liver Tissue Cell Distribution System was sponsored by the National Institutes of Health [Contract N01-DK-7-0004/HHSN267200700004C].
Article, publication date, and citation information can be found at http://dmd.aspetjournals.org.
- P450
- cytochrome P450
- NAFLD
- nonalcoholic fatty liver disease
- NASH
- nonalcoholic steatohepatitis
- GAPDH
- glyceraldehyde-3-phosphate dehydrogenase
- CT
- threshold cycle
- IL-1β
- interleukin 1β
- TNFα
- tumor necrosis factor α
- HIF-1α
- hypoxia-induced factor 1α.
References
- Augustine LM, Fisher CD, Lickteig AJ, Aleksunes LM, Slitt AL, Cherrington NJ. (2008) Gender divergent expression of Nqo1 in Sprague Dawley and August Copenhagen x Irish rats. J Biochem Mol Toxicol 22:93–100 [DOI] [PubMed] [Google Scholar]
- Bechtel YC, Haffen E, Lelouët H, Brientini MP, Paintaud G, Miguet JP, Bechtel PR. (2000) Relationship between the severity of alcoholic liver cirrhosis and the metabolism of caffeine in 226 patients. Int J Clin Pharmacol Ther 38:467–475 [DOI] [PubMed] [Google Scholar]
- Bedogni G, Miglioli L, Masutti F, Tiribelli C, Marchesini G, Bellentani S. (2005) Prevalence of and risk factors for nonalcoholic fatty liver disease: the Dionysos nutrition and liver study. Hepatology 42:44–52 [DOI] [PubMed] [Google Scholar]
- Bellentani S, Bedogni G, Miglioli L, Tiribelli C. (2004) The epidemiology of fatty liver. Eur J Gastroenterol Hepatol 16:1087–1093 [DOI] [PubMed] [Google Scholar]
- Chalasani N, Deeg MA, Crabb DW. (2004) Systemic levels of lipid peroxidation and its metabolic and dietary correlates in patients with nonalcoholic steatohepatitis. Am J Gastroenterol 99:1497–1502 [DOI] [PubMed] [Google Scholar]
- Chtioui H, Semela D, Ledermann M, Zimmermann A, Dufour JF. (2007) Expression and activity of the cytochrome P450 2E1 in patients with nonalcoholic steatosis and steatohepatitis. Liver Int 27:764–771 [DOI] [PubMed] [Google Scholar]
- Congiu M, Mashford ML, Slavin JL, Desmond PV. (2002) UDP glucuronosyltransferase mRNA levels in human liver disease. Drug Metab Dispos 30:129–134 [DOI] [PubMed] [Google Scholar]
- Cuzick J. (1985) A Wilcoxon-type test for trend. Stat Med 4:87–90 [DOI] [PubMed] [Google Scholar]
- Danielson PB. (2002) The cytochrome P450 superfamily: biochemistry, evolution and drug metabolism in humans. Curr Drug Metab 3:561–597 [DOI] [PubMed] [Google Scholar]
- Earley S, Pastuszyn A, Walker BR. (2003) Cytochrome p-450 epoxygenase products contribute to attenuated vasoconstriction after chronic hypoxia. Am J Physiol Heart Circ Physiol 285:H127–H136 [DOI] [PubMed] [Google Scholar]
- Frye RF, Zgheib NK, Matzke GR, Chaves-Gnecco D, Rabinovitz M, Shaikh OS, Branch RA. (2006) Liver disease selectively modulates cytochrome P450–mediated metabolism. Clin Pharmacol Ther 80:235–245 [DOI] [PubMed] [Google Scholar]
- George J, Liddle C, Murray M, Byth K, Farrell GC. (1995a) Pre-translational regulation of cytochrome P450 genes is responsible for disease-specific changes of individual P450 enzymes among patients with cirrhosis. Biochem Pharmacol 49:873–881 [DOI] [PubMed] [Google Scholar]
- George J, Murray M, Byth K, Farrell GC. (1995b) Differential alterations of cytochrome P450 proteins in livers from patients with severe chronic liver disease. Hepatology 21:120–128 [PubMed] [Google Scholar]
- Gilmore WJ, Hartmann G, Piquette-Miller M, Marriott J, Kirby GM. (2003) Effects of lipopolysaccharide-stimulated inflammation and pyrazole-mediated hepatocellular injury on mouse hepatic Cyp2a5 expression. Toxicology 184:211–226 [DOI] [PubMed] [Google Scholar]
- Guengerich FP. (1994) Catalytic selectivity of human cytochrome P450 enzymes: relevance to drug metabolism and toxicity. Toxicol Lett 70:133–138 [DOI] [PubMed] [Google Scholar]
- Guengerich FP. (2008) Cytochrome p450 and chemical toxicology. Chem Res Toxicol 21:70–83 [DOI] [PubMed] [Google Scholar]
- Guengerich FP, Turvy CG. (1991) Comparison of levels of several human microsomal cytochrome P-450 enzymes and epoxide hydrolase in normal and disease states using immunochemical analysis of surgical liver samples. J Pharmacol Exp Ther 256:1189–1194 [PubMed] [Google Scholar]
- Huang HL, Lin WY, Lee LT, Wang HH, Lee WJ, Huang KC. (2007) Metabolic syndrome is related to nonalcoholic steatohepatitis in severely obese subjects. Obes Surg 17:1457–1463 [DOI] [PubMed] [Google Scholar]
- Kirby GM, Batist G, Alpert L, Lamoureux E, Cameron RG, Alaoui-Jamali MA. (1996) Overexpression of cytochrome P-450 isoforms involved in aflatoxin B1 bioactivation in human liver with cirrhosis and hepatitis. Toxicol Pathol 24:458–467 [DOI] [PubMed] [Google Scholar]
- Kleiner DE, Brunt EM, Van Natta M, Behling C, Contos MJ, Cummings OW, Ferrell LD, Liu YC, Torbenson MS, Unalp-Arida A, et al. (2005) Design and validation of a histological scoring system for nonalcoholic fatty liver disease. Hepatology 41:1313–1321 [DOI] [PubMed] [Google Scholar]
- Kolars JC, Lown KS, Schmiedlin-Ren P, Ghosh M, Fang C, Wrighton SA, Merion RM, Watkins PB. (1994) CYP3A gene expression in human gut epithelium. Pharmacogenetics 4:247–259 [DOI] [PubMed] [Google Scholar]
- Krishna DR, Klotz U. (1994) Extrahepatic metabolism of drugs in humans. Clin Pharmacokinet 26:144–160 [DOI] [PubMed] [Google Scholar]
- Lelouët H, Bechtel YC, Paintaud G, Brientini MP, Miguet JP, Bechtel PR. (2001) Caffeine metabolism in a group of 67 patients with primary biliary cirrhosis. Int J Clin Pharmacol Ther 39:25–32 [DOI] [PubMed] [Google Scholar]
- Li L, Chen SH, Zhang Y, Yu CH, Li SD, Li YM. (2006a) Is the hypoxia-inducible factor-1 alpha mRNA expression activated by ethanol-induced injury, the mechanism underlying alcoholic liver disease? Hepatobiliary Pancreat Dis Int 5:560–563 [PubMed] [Google Scholar]
- Li S, Hu ZH, Miao XH. (2006b) [Effects of chronic HBV infection on human hepatic cytochrome P450 3A4]. Zhonghua Yi Xue Za Zhi 86:2703–2706 [PubMed] [Google Scholar]
- Lown K, Kolars J, Turgeon K, Merion R, Wrighton SA, Watkins PB. (1992) The erythromycin breath test selectively measures P450IIIA in patients with severe liver disease. Clin Pharmacol Ther 51:229–238 [DOI] [PubMed] [Google Scholar]
- Lucas D, Berthou F, Dréano Y, Lozac'h P, Volant A, Ménez JF. (1993) Comparison of levels of cytochromes P-450, CYP1A2, CYP2E1, and their related monooxygenase activities in human surgical liver samples. Alcohol Clin Exp Res 17:900–905 [DOI] [PubMed] [Google Scholar]
- Michaelis UR, Fisslthaler B, Barbosa-Sicard E, Falck JR, Fleming I, Busse R. (2005) Cytochrome P450 epoxygenases 2C8 and 2C9 are implicated in hypoxia-induced endothelial cell migration and angiogenesis. J Cell Sci 118:5489–5498 [DOI] [PubMed] [Google Scholar]
- Nelson DR, Kamataki T, Waxman DJ, Guengerich FP, Estabrook RW, Feyereisen R, Gonzalez FJ, Coon MJ, Gunsalus IC, Gotoh O. (1993) The P450 superfamily: update on new sequences, gene mapping, accession numbers, early trivial names of enzymes, and nomenclature. DNA Cell Biol 12:1–51 [DOI] [PubMed] [Google Scholar]
- Nelson DR, Zeldin DC, Hoffman SM, Maltais LJ, Wain HM, Nebert DW. (2004) Comparison of cytochrome P450 (CYP) genes from the mouse and human genomes, including nomenclature recommendations for genes, pseudogenes and alternative-splice variants. Pharmacogenetics 14:1–18 [DOI] [PubMed] [Google Scholar]
- Nichols KD, Kirby GM. (2008) Microarray analysis of hepatic gene expression in pyrazole-mediated hepatotoxicity: identification of potential stimuli of Cyp2a5 induction. Biochem Pharmacol 75:538–551 [DOI] [PubMed] [Google Scholar]
- Ohnishi A, Murakami S, Akizuki S, Mochizuki J, Echizen H, Takagi I. (2005) In vivo metabolic activity of CYP2C19 and CYP3A in relation to CYP2C19 genetic polymorphism in chronic liver disease. J Clin Pharmacol 45:1221–1229 [DOI] [PubMed] [Google Scholar]
- Pelkonen O, Turpeinen M, Hakkola J, Honkakoski P, Hukkanen J, Raunio H. (2008) Inhibition and induction of human cytochrome P450 enzymes: current status. Arch Toxicol 82:667–715 [DOI] [PubMed] [Google Scholar]
- Raunio H, Rautio A, Gullstén H, Pelkonen O. (2001) Polymorphisms of CYP2A6 and its practical consequences. Br J Clin Pharmacol 52:357–363 [DOI] [PMC free article] [PubMed] [Google Scholar]
- Targher G, Bertolini L, Rodella S, Zoppini G, Lippi G, Day C, Muggeo M. (2008) Non-alcoholic fatty liver disease is independently associated with an increased prevalence of chronic kidney disease and proliferative/laser-treated retinopathy in type 2 diabetic patients. Diabetologia 51:444–450 [DOI] [PubMed] [Google Scholar]
- Tsunedomi R, Iizuka N, Hamamoto Y, Uchimura S, Miyamoto T, Tamesa T, Okada T, Takemoto N, Takashima M, Sakamoto K, et al. (2005) Patterns of expression of cytochrome P450 genes in progression of hepatitis C virus-associated hepatocellular carcinoma. Int J Oncol 27:661–667 [PubMed] [Google Scholar]
- Videla LA, Rodrigo R, Orellana M, Fernandez V, Tapia G, Quinones L, Varela N, Contreras J, Lazarte R, Csendes A, et al. (2004) Oxidative stress-related parameters in the liver of non-alcoholic fatty liver disease patients. Clin Sci (Lond) 106:261–268 [DOI] [PubMed] [Google Scholar]
- Villeneuve JP, Pichette V. (2004) Cytochrome P450 and liver diseases. Curr Drug Metab 5:273–282 [DOI] [PubMed] [Google Scholar]
- Weltman MD, Farrell GC, Hall P, Ingelman-Sundberg M, Liddle C. (1998) Hepatic cytochrome P450 2E1 is increased in patients with nonalcoholic steatohepatitis. Hepatology 27:128–133 [DOI] [PubMed] [Google Scholar]
- Wheeler CW, Guenthner TM. (1990) Spectroscopic quantitation of cytochrome P-450 in human lung microsomes. J Biochem Toxicol 5:269–272 [DOI] [PubMed] [Google Scholar]
- Yang LQ, Li SJ, Cao YF, Man XB, Yu WF, Wang HY, Wu MC. (2003) Different alterations of cytochrome P450 3A4 isoform and its gene expression in livers of patients with chronic liver diseases. World J Gastroenterol 9:359–363 [DOI] [PMC free article] [PubMed] [Google Scholar]
- Zhou M, Maitra SR, Wang P. (2008) The potential role of transcription factor aryl hydrocarbon receptor in downregulation of hepatic cytochrome P-450 during sepsis. Int J Mol Med 21:423–428 [PMC free article] [PubMed] [Google Scholar]
- Zordoky BN, El-Kadi AO. (2008) Modulation of cardiac and hepatic cytochrome P450 enzymes during heart failure. Curr Drug Metab 9:122–128 [DOI] [PubMed] [Google Scholar]
Associated Data
This section collects any data citations, data availability statements, or supplementary materials included in this article.


