Abstract
3-Methylindole (3MI), a respiratory tract toxicant, can be metabolized by a number of cytochromes P450 (P450), primarily through either dehydrogenation or epoxidation of the indole. In the present study, we assessed the bioactivation of 3MI by recombinant CYP2A13, a human P450 predominantly expressed in the respiratory tract. Four metabolites were detected, and the two principal ones were identified as indole-3-carbinol (I-3-C) and 3-methyloxindole (MOI). Bioactivation of 3MI by CYP2A13 was verified by the observation of three glutathione (GSH) adducts designated as GS-A1 (glutathione adduct 1), GS-A2 (glutathione adduct 2), and GS-A3 (glutathione adduct 3) in a NADPH- and GSH-fortified reaction system. GS-A1 and GS-A2 gave the same molecular ion at m/z 437, an increase of 305 Da over 3MI. Their structures are assigned to be 3-glutathionyl-S-methylindole and 3-methyl-2-glutathionyl-S-indole, respectively, on the basis of the mass fragmentation data obtained by high-resolution mass spectrometry. Kinetic parameters were determined for the formation of I-3-C (Vmax = 1.5 nmol/min/nmol of P450; Km = 14 μM), MOI (Vmax = 1.9 nmol/min/nmol of P450; Km = 15 μM) and 3-glutathionyl-S-methylindole (Vmax = 0.7 nmol/min/nmol of P450; Km = 13 μM). The structure of GS-A3, a minor adduct with a protonated molecular ion at m/z 453, is proposed to be 3-glutathionyl-S-3-methyloxindole. We also discovered that 3MI is a mechanism-based inactivator of CYP2A13, given that it produced a time-, cofactor-, and 3MI concentration-dependent loss of activity toward 4-(methylnitrosamino)-1-(3-pyridyl)-1-butanone, with a relatively low KI value of ∼10 μM and a kinact of 0.046 min−1. Thus, CYP2A13 metabolizes 3MI through multiple bioactivation pathways, and the process can lead to a suicide inactivation of CYP2A13.
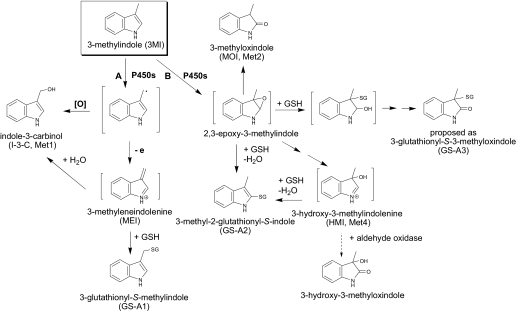
3-Methylindole (3MI) is a potent pneumotoxicant and nasal toxicant in several animal species studied, including ruminants, rabbits, and rodents (Adams et al., 1988; Carlson and Yost, 1989; Yost, 1989; Gaskell, 1990). The pulmonary toxicity of 3MI has been attributed to bioactivation by cytochrome P450 (P450) enzymes, which catalyze the formation of reactive intermediates that can bind to cellular proteins (Yost, 1989) and DNA (Regal et al., 2001). Evidence for P450 involvement comes from studies on in vitro metabolism of 3MI using vaccinia-expressed P450s (Thornton-Manning et al., 1991, 1996; Lanza and Yost, 2001), as well as studies in which P450 inhibitors were found to decrease covalent binding and toxicity associated with 3MI metabolism (Huijzer et al., 1989). Bioactivation of 3MI results in the formation of at least three potentially toxic species via two distinct pathways: 3-methyleneindolenine (MEI), via dehydrogenation, and both 2,3-epoxy-3MI and 3-hydroxy-3-methylindolenine (HMI), via epoxidation on the pyrrole moiety (Scheme 1 ). Extensive studies seemed to show that dehydrogenation of 3MI is the major route of metabolism that results in toxicity (Skiles and Yost, 1996; reviewed in Yost, 2001). A study of the metabolism of 3MI in human liver microsomes revealed additional metabolic pathways that can lead to formation of potentially toxic intermediates; one such pathway is oxidation of the benzene ring, resulting in benzoquinone intermediates (Yan et al., 2007). It is noteworthy that P450-catalyzed dehydrogenation of 3MI-containing compounds also has the potential to inactivate P450s (Kassahun et al., 2005; Sun and Yost, 2008); the formation of MEI from 3MI has been implicated in the inactivation of CYP2F1 and CYP2F3 (Kartha and Yost, 2008).
Scheme 1.
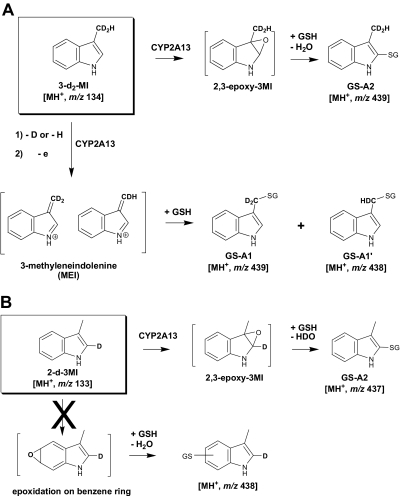
P450-mediated metabolic activation of 3MI, and consequent GSH-adduct formation. Pathway A represents dehydrogenation, whereas pathway B represents epoxidation.
There is evidence suggesting that 3MI is potentially toxic to humans as well as to other animals. Previous studies have shown that, in human lung microsomes, 3MI can be bioactivated to reactive intermediates that can bind to cellular proteins (Ruangyuttikarn et al., 1991). Humans are exposed to 3MI mainly through dietary sources (Fordtran et al., 1964) and cigarette smoke (Hoffmann and Rathkamp, 1970). Thus, metabolic activation of either inhaled or systemically derived 3MI in the lung could potentially lead to tissue toxicity.
The lung-specific toxicity of 3MI observed in animal models is believed to be related to the selective expression of certain P450s in tissues. Therefore, the identification of P450s that can bioactivate 3MI and that are also expressed in the human lung supports the idea that 3MI causes toxicity in humans. In vitro studies have demonstrated that human CYP1A1, 1A2, 1B1, 2A6, 2E1, and 2F1 can all metabolize 3MI (Thornton-Manning et al., 1996; Lanza et al., 1999; Lanza and Yost, 2001); among those, CYP2F1 seems to be the most efficient in dehydrogenating 3MI (Lanza et al., 1999). CYP2F1 is a lung-selective P450, and it may play a major role in the potential pneumotoxicity of 3MI to humans. However, a frequent allelic variant of CYP2F1, which encodes a nonfunctional CYP2F1 protein, was recently identified (Tournel et al., 2007). Thus, other P450s may play major roles in 3MI bioactivation in individuals who carry the defective CYP2F1 allele.
CYP2A13, a human P450 expressed predominantly in the respiratory tract (Su et al., 2000; Zhang et al., 2007), has been shown to be involved in the bioactivation of several toxicants, such as 4-(methylnitrosamino)-1-(3-pyridyl)-1-butanone (NNK) and other nitrosamines (Su et al., 2000), aflatoxin B1 (He et al., 2006), naphthalene (Fukami et al., 2008), and 4-aminobiphenyl (Nakajima et al., 2006). The substrate specificity of CYP2A13 overlaps with those of CYP2E1, CYP1A2, and CYP2A6, all enzymes known to be able to metabolize 3MI in vitro (Thornton-Manning et al., 1996; Lanza and Yost, 2001). Accordingly, we speculated that CYP2A13 can also bioactivate 3MI.
In the present study, we determined, using heterologously expressed CYP2A13, whether CYP2A13 can catalyze the bioactivation of 3MI. We identified 3MI metabolites in the presence or absence of GSH as a trapping reagent. We subsequently determined kinetic parameters for the formation of the major metabolites detected. In light of the known inactivation of CYP2F1 by 3MI, we also investigated the potential of 3MI to inactivate CYP2A13. Our findings indicate not only that CYP2A13 can catalyze multiple bioactivation pathways of 3MI but also that bioactivation of 3MI can lead to inactivation of CYP2A13.
Materials and Methods
Enzymes and Chemicals.
Reagents and solvents used in the current study were of the highest grade available. Purified human cytochrome P450 reductase (CPR) was purchased from Invitrogen (Carlsbad, CA). [5-3H]NNK (10.9 Ci/mmol; purity >98%) was purchased from Moravek Biochemicals (Brea, CA), and unlabeled NNK was purchased from Chemsyn Science Laboratories (Lenexa, KS). Radiolabeled NNK was further purified by reverse-phase high-performance liquid chromatography (HPLC) before use. Stable isotope-labeled GSH, γ-glutamyl-cysteinyl-[13C2-15N]-glycine (GSX), was obtained from Cambridge Isotope Laboratories (Andover, MA). Pooled human liver cytosol was purchased from BD Biosciences (Woburn, MA). Heterologous expression of CYP2A13 protein in Spodoptera frugiperda (Sf9) insect cells and preparation of microsomal fractions were performed as described previously (Su et al., 2000; Zhang et al., 2002). 3-([2H2]-methyl)indole (3-d2-MI) and 2-[2H]-3-methylindole (2-d-3MI) were synthesized as described previously (Skordos et al., 1998b). The authentic standards for 3-glutathionyl-S-methylindole and GSX-3MI (3-glutathionyl-S-methylindole, except that it contains GSX instead of GSH) were synthesized similarly to 3-[(N-acetylcystein-S-yl)methyl]indole (3MINAC) (Skiles and Yost 1996). All other reagents were purchased from Sigma-Aldrich (St. Louis, MO).
Incubations with Heterologously Expressed CYP2A13 for Metabolite Identification.
Reaction mixtures contained 100 mM potassium phosphate, pH 7.4, 1 mM EDTA, 3 mM MgCl2, 1 mM NADPH, 10 or 50 μM 3MI, 30 pmol of purified human CPR, and 10 pmol of CYP2A13 in a final volume of 0.5 ml. For trapping experiments, GSH was added at a concentration of 5 mM. Reactions were carried out at 37°C for 0 or 60 min and terminated with an equal volume of ice-cold acetonitrile. The samples were centrifuged, and 30-μl aliquots of the supernatant were analyzed by LC/UV/MS as described below. In a separate set of experiments, 10 μM MOI or I-3-C was used as the substrate in place of 3MI, and reactions were otherwise set up and performed as described above.
For experiments using human liver cytosol, the reaction mixtures were set up and incubated as described above; after the 60-min incubation, 1 to 2 mg of human liver cytosol and 0 or 100 μM menadione were added, and the reactions were allowed to continue for another 10 to 30 min before being stopped with an equal volume of ice-cold acetonitrile. The samples were centrifuged, and 30-μl aliquots of the supernatant were analyzed by LC/UV/MS as described below.
For experiments using 3-d2-MI and 2-d-3MI, reaction mixtures contained 50 mM potassium phosphate, pH 7.4, 2.5 mM NADPH, 2 mM GSH, 100 μM 3-d2-MI or 2-d-3MI, 30 pmol of purified human CPR, and 18 pmol of CYP2A13 in a final volume of 0.4 ml. Reactions were carried out at 37°C for 20 min and terminated with 40 μl of trichloroacetic acid. The samples were centrifuged and purified by solid-phase extraction using a StrataX (30 mg/1 ml) column (Phenomenex, Torrance, CA). The analytes were eluted with methanol; the eluate was dried under speed vacuum, and the residues were dissolved in 15% acetonitrile and analyzed by LC/MS as described below.
Determination of Catalytic Activity.
For determination of kinetic parameters for MOI and I-3-C formation from 3MI, reaction mixtures contained 100 mM potassium phosphate (pH 7.4), 1 mM EDTA, 3 mM MgCl2, 1 mM NADPH, 0 to 100 μM 3MI, 30 pmol of purified human CPR, and 10 pmol of CYP2A13, in a final volume of 0.25 ml. Reactions were performed at 37°C for 10 min, using conditions under which the rates of product formation were linear with time, and were terminated with 2 volumes of ice-cold 90% acetonitrile, containing 500 nM methylphenidate, as an internal standard. The samples were centrifuged, and 5-μl aliquots of the supernatant were analyzed by LC/MS as described below.
For determination of kinetic parameters for GS-A1 formation from 3MI, reaction mixtures contained 50 mM potassium phosphate (pH 7.4), 2.5 mM NADPH, 2 mM GSH, 0 to 200 μM 3MI, 30 pmol of purified human CPR, and 18 pmol of CYP2A13, in a final volume of 0.4 ml. Reactions were performed at 37°C for 5 min, using conditions under which the rates of product formation were linear with time and were terminated with the addition of 2 volumes of ice-cold methanol, containing 7.5 μM GSX-3MI, as an internal standard. The samples were centrifuged, and the supernatant was dried under vacuum. The residues were dissolved in water and purified by solid-phase extraction using a StrataX (30 mg/1 ml) column, before LC/MS analysis.
For all kinetic determinations, peak area ratios of authentic standards to the internal standard were used to generate a standard curve permitting calculation of the amounts of each metabolite produced. Nonlinear regression and enzyme kinetic analyses were performed with GraphPad Prism 5 (GraphPad Software Inc., San Diego, CA).
Time-, Concentration-, and NADPH-Dependent Inactivation of CYP2A13 by 3MI.
Primary incubations contained 100 mM potassium phosphate, pH 7.4, 0 to 50 μM 3MI, 1 mM NADPH, 0 or 2 mM GSH, 50 pmol of CYP2A13, and 150 pmol of purified human CPR. Primary reactions were carried out at 30°C for 0, 5, 10, or 15 min. At the indicated time points, aliquots of the primary incubation mixtures, each containing 10 pmol of CYP2A13, were transferred to a secondary incubation mixture containing 100 mM potassium phosphate, pH 7.4, 1 mM EDTA, an NADPH-generating system (5 mM glucose 6-phosphate, 3 mM MgCl2, 1 mM NADPH, and 1.2 U of glucose-6-phosphate dehydrogenase), and 10 μM NNK (containing 1 μCi of [5-3H]NNK), in a final volume of 0.4 ml. The secondary reactions were performed at 30°C for 10 min and terminated with 50 μl each of 25% zinc sulfate and saturated barium hydroxide. The samples were centrifuged, and 75-μl aliquots of the supernatant were analyzed using an HPLC system equipped with an on-line radioactivity detector (Radiomatic Series A-500; PerkinElmer Life and Analytical Sciences, Waltham, MA) for keto aldehyde formation from NNK, as described previously (D'Agostino et al., 2008).
LC/UV/MS for Metabolite Identification.
Detection of 3MI metabolites and GSH adducts, as well as MOI metabolites, was conducted using an LC/UV/MS system, which consisted of a Waters 2690 Separations Module (Milford, MA), a Surveyor photodiode array detector (Thermo Fisher Scientific, Waltham, MA), and a Thermo Fisher TSQ Quantum Ultra triple-quadrupole mass spectrometer or a Thermo Fisher LCQ DECA XP ion trap mass spectrometer. The structural elucidation of GS-A1 and GS-A2 was conducted using an LC/UV/MS system that consisted of an Agilent 1100 Series capillary LC system (Agilent Technologies, Santa Clara, CA), an Agilent photodiode array detector, and a Thermo Fisher LTQ Orbitrap mass spectrometer. Chromatographic separations were achieved on a Waters Atlantis dC18 column (3 μm, 4.6 × 150 mm) using mobile phase A (94.9% water, 5% acetonitrile, and 0.1% formic acid) and mobile phase B (100% acetonitrile). The HPLC elution gradient started with an equilibration at 5% B for 5 min, followed by an increase to 55% B over the next 5 min, and a further increase to 60% B over 20 min. The column was then washed with 100% B for 10 min before returning to the initial conditions. The column was equilibrated for 10 min between injections. The flow rate was 0.3 ml/min, and all gradients were linear. The HPLC column effluent was analyzed sequentially by the photodiode array detector (scanning from 200 to 550 nm) and by the mass spectrometer, equipped with an electron spray ionization source. The mass spectrometer was operated in the positive ion mode, with nitrogen as the sheath gas and auxiliary gas. Adjusted so as to obtain the maximum sensitivity based on the parent molecule, the source temperature was set to 350°C, the electron spray voltage was 4.5 kV for the ion trap and 5.0 kV for both the triple-quadrupole and the Orbitrap spectrometers, and normalized collision energy was at 40 to 55 eV. All samples were analyzed with full scan, data-dependent, or single ion monitoring mass acquisition. For the Orbitrap spectrometer, all experimental data were acquired using external calibration performed on the day of analysis, with a resolving power of 7500 at m/z 400. Data were processed using Xcalibur software (Thermo Fisher Scientific).
Detection of GSH adducts formed by metabolism of 3-d2-MI and 2-d-3MI was conducted using a LC/MS system, which consisted of a Thermo Fisher Surveyor LC pump, Thermo Fisher Surveyor autosampler, and a Thermo Fisher LCQ Advantage Max ion trap mass spectrometer. Chromatographic separations were achieved on a Phenomenex Luna C18 column (5 μm, 2.0 × 150 mm), using mobile phase A (99.9% water and 0.1% formic acid) and mobile phase B (100% acetonitrile). The HPLC elution gradient started with an equilibration at 15% B for 14 min, followed by an increase to 95% B over the next 4 min, held at 95% B for 5 min, and then returned to 15% B over 3 min. The column was equilibrated for 10 min between injections. The flow rate was 0.2 ml/min, and all gradients were linear. The HPLC column effluent was analyzed by the mass spectrometer equipped with an electron spray ionization source. The mass spectrometer was operated in the positive ion mode, with nitrogen as the sheath gas. Adjusted so as to obtain the maximum sensitivity based on the parent molecule, the source temperature was set to 215°C, the electron spray voltage was 5.0 kV, and the normalized collision energy was at 23 eV. All samples were analyzed with full-scan and zoom-scan mass acquisition. Data were processed using Xcalibur software.
LC/MS for Quantitative Analysis.
The quantitative analysis of I-3-C and MOI was performed with an LC/MS system, which consisted of a Waters Acquity Ultra Performance LC system and an ABI 4000 Q-Trap Linear Ion Trap mass spectrometer (Applied Biosystems/MDS Sciex, Foster City, CA). Chromatographic separations were achieved on a Waters Acquity Ultra Performance LC BEH C18 reversed-phase column (1.7 μm, 2.0 × 50 mm) using mobile phase A (99.9% water, 0.1% formic acid) and mobile phase B (99.9% acetonitrile, 0.1% formic acid). The HPLC elution gradient started with an equilibration at 5% B for 0.5 min, followed by an increase to 100% B over 1.0 min, held at 100% B for 0.5 min, and returned to initial conditions and equilibrated for 0.7 min. The flow rate was 0.6 ml/min. The HPLC column effluent was analyzed by the mass spectrometer equipped with a TurboIonSpray ionization source. The mass spectrometer was operated in the positive ion mode. Adjusted so as to obtain the maximum sensitivity based on the parent molecule, the source temperature was set to 600°C, the ion spray voltage was 4.5 kV, and normalized collision energies of 40 (I-3-C), 50 (MOI), or 75 (methylphenidate) eV were used. All samples were analyzed with selected reaction monitoring using the m/z transitions 130 to 77 for I-3-C, 148 to 77 for MOI, and 234 to 84 for methylphenidate.
The quantitative analysis of GS-A1 was performed using the same LC/MS system, chromatographic separation, and mass spectrometer settings as have been described above for the experiments with 3-d2-MI and 2-d-3MI. All samples were analyzed with selected reaction monitoring using the m/z transitions 440 to 311 for GSX-3MI and 437 to 308 for GS-A1.
Results
Metabolism of 3MI by CYP2A13.
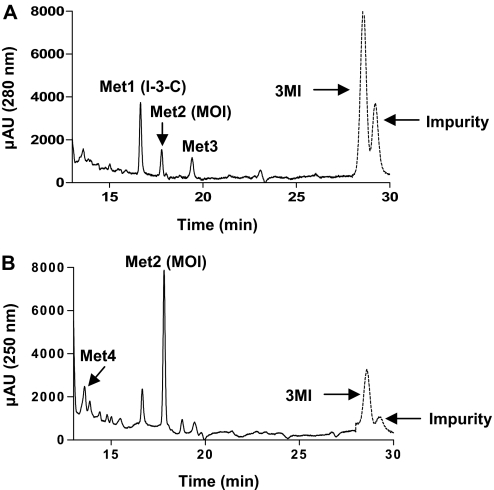
Three metabolites were detected in an LC/UV chromatogram at a wavelength of 280 nm; they were designated as Met1, Met2, and Met3 based on their elution order (Fig. 1 A). All three metabolites were produced in an NADPH-dependent manner. Both Met1 and Met3 exhibited UV absorbance peaks at ∼228 and at 280 nm, whereas Met2 exhibited maximum UV absorbance at ∼250 nm (data not shown). An impurity that had a retention time of 29.5 min was detected; the abundance of the impurity was unaffected by either incubation with NADPH or omission of 3MI (data not shown). Another metabolite, Met4, eluted at 13.6 min, and was detected in an LC/UV chromatogram at a wavelength of 250 nm (Fig. 1B); it also was produced in an NADPH-dependent manner.
Fig. 1.
HPLC detection of metabolites formed from 3MI in incubations with heterologously expressed CYP2A13. Incubation mixtures, reaction conditions, and analysis of the resulting metabolites are described under Materials and Methods. Four metabolites, Met1, Met2, Met3, and Met4, were detected at 16.6, 17.8, 19.4, and 13.6 min, respectively. A peak representing an impurity was found among the extracted metabolites, as well as in control reactions. The chromatograms shown were obtained by subtracting the background absorbance of a control incubation (reaction terminated before the addition of NADPH) from the absorbance of a 60-min reaction (terminated after a 60-min incubation with NADPH), for all signals before the substrate peak (indicated by the dotted line). Metabolites were detected by monitoring of UV absorption at 280 nm (A) or 250 nm (B).
Identification of 3MI Metabolites Generated by CYP2A13.
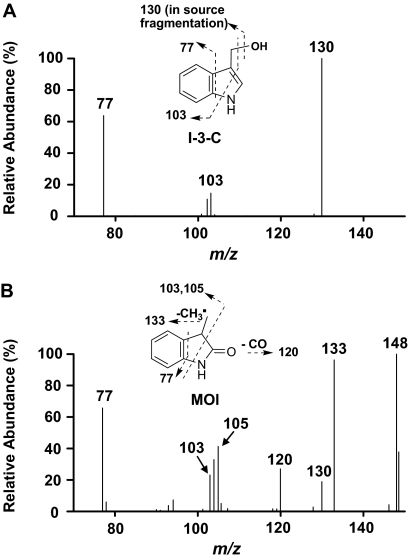
The metabolites Met1 and Met2 were confirmed to be I-3-C and MOI, respectively, based on coelution with authentic standards under the same LC conditions and on matching of MS2 spectra (Fig. 2 ) and UV spectra (data not shown) with authentic standards. The theoretical molecular ion of I-3-C is 148; however, it was only detected at m/z 130 under the current LC/MS conditions, indicating an instability of the molecular ion that resulted in the loss of water in the electrospray ionization ion source of the mass spectrometer. The fragmentation of the ion at m/z 130 yielded two major product ions, at m/z 103 and 77, representing an ethylene-benzene cation and a benzene cation, respectively (Fig. 2A). The MS2 spectrum of the MOI molecular ion, at m/z 148, revealed multiple product ions, including ions at m/z 133 (loss of a methyl radical), 130 (loss of a water), 120 (loss of a CO), 103/105 (ethylene-benzene cation and ethylbenzene cation, respectively), and 77 (benzene cation) (Fig. 2B). The loss of a CO is diagnostic and indicates the presence of a carbonyl group in MOI. Accordingly, we selected the mass transitions 130 to 77 and 148 to 77 for establishment of a robust quantitative analysis method for I-3-C and for MOI, respectively.
Fig. 2.
MS2 product ion spectra of Met1 and Met2 formed from 3MI, in incubations with heterologously expressed CYP2A13. Incubation mixtures, reaction conditions, and analysis of the resulting metabolites are described under Materials and Methods. A, Met1, identified as I-3-C. B, Met2, identified as MOI.
We were unable to identify the metabolite Met3, because of the lack of a matching reference compound, as well as the apparent absence of ionization in MS analysis. Met3 cannot be 2′-aminoacetophenone, a metabolite of 3MI previously identified in incubations with pig liver microsomes (Diaz et al., 1999), given that the two compounds had differing UV absorption spectral properties (data not shown).
Met4 showed a molecular ion at m/z 148, and it had a MS2 fragmentation pattern similar to that for MOI, indicating that oxidation occurred at the pyrrole ring. When human liver cytosol, representing a source of aldehyde oxidase, was added to reaction mixtures at 60 min after initiation of the P450 reaction, a cytosol- and time-dependent decrease in the levels of Met4, but not of the other metabolites, was observed (data not shown). Met4 was also partially protected from the cytosol- and time-dependent loss by the addition of menadione (data not shown), an aldehyde oxidase inhibitor (Johns, 1967). The time-dependent loss of Met4 in the presence of cytosol and the protection by an aldehyde oxidase inhibitor are consistent with the conversion of HMI to 3-hydroxy-3-methyloxindole (Diaz and Squires 2000). We have previously shown (Skordos et al., 1998b) that 3-hydroxy-3-methyloxindole is efficiently formed from HMI by aldehyde oxidase enzymes from goat, mouse, rat, and rabbit lung and liver cytosolic fractions. In fact, incubations of 3MI with goat lung microsomes and cytosol showed that the carbonyl oxygen of 3-hydroxy-3-methyloxindole was derived from water, not molecular oxygen, confirming catalysis of the HMI imine by aldehyde oxidase. We propose, on the basis of these data, that Met 4 is HMI, a reactive metabolite, which, although it is somewhat unstable (Diaz et al., 1999), has previously been detected in reactions of 3MI with human and pig liver microsomes (Diaz et al., 1999; Yan et al., 2007).
Metabolism of MOI and I-3-C by CYP2A13.
To test whether Met3 was formed by CYP2A13-mediated metabolism of MOI or I-3-C, we performed incubations using MOI or I-3-C as a substrate. Incubation of MOI with CYP2A13 produced one major and several minor metabolites; however, none matched the retention time of Met3 under the same LC conditions (data not shown). The major MOI metabolite, designated as Met1*, exhibited maximum UV absorbance at 250 nm and was detected at m/z 164; the latter represents an addition of 16 Da relative to the molecular ion of MOI. Tandem MS of Met1* revealed a base product ion at m/z 146, corresponding to a neutral loss of water. This result suggests that the hydroxylation of MOI occurred at an aliphatic carbon, either at the C-3 position or the methyl group. Thus, Met1* is likely to be 3-hydroxy-3-methyloxindole or 3-hydroxymethyloxindole. However, Met1* was not observed in incubations of CYP2A13 with 3MI, suggesting that the levels of MOI formed under the latter conditions were not sufficient to support further metabolism. No metabolites were observed when I-3-C was used as a substrate with CYP2A13 (data not shown).
GSH Adducts Formed by CYP2A13.
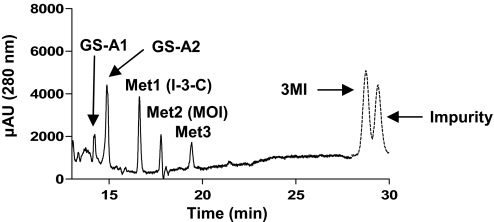
For identification of reactive intermediates formed by CYP2A13-mediated 3MI metabolism, reaction mixtures were fortified with reduced GSH (5 mM), and the resulting samples were analyzed by LC/UV/MS. Two major GSH adducts were detected on a LC/UV chromatograph at 280 nm and were designated as GS-A1 and GS-A2 based on their elution order (Fig. 3 ). A minor peak at ∼13.8 min, corresponding to a third adduct identified later by LC/MS, was designated as GS-A3. GS-A1 and GS-A2 gave the same protonated molecular ion, at m/z 437.
Fig. 3.
HPLC detection of GSH adducts formed by CYP2A13-mediated metabolism of 3MI in the presence of GSH. Incubation mixtures, reaction conditions, and analysis of the resulting GSH adducts are described under Materials and Methods. Two GSH adducts, GS-A1 and GS-A2, were detected at 14.2 and 14.9 min, respectively. The chromatogram was obtained by subtracting the background absorbance of a control incubation (reaction terminated before the addition of NADPH) from the absorbance of a 60-min reaction, for all signals before the substrate peak (indicated by dotted line). Metabolites were detected by monitoring of UV absorption at 280 nm.
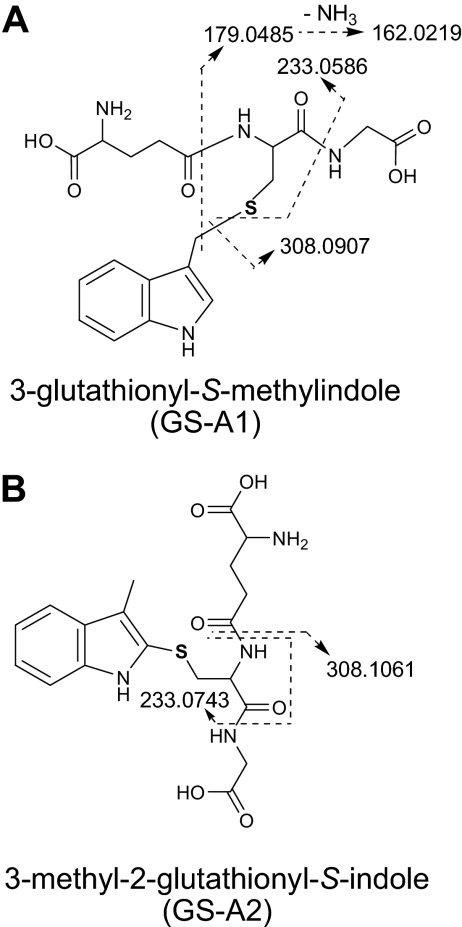
The structures of GS-A1 and GS-A2 were further elucidated on the basis of high-resolution mass information collected from an LTQ Orbitrap mass spectrometer. In full-scan mass spectra, GS-A1 and GS-A2 gave protonated molecules at m/z 437.1486 (Table 1 ). These molecular ions were 305 Da greater in mass than the molecular ion of 3MI (132 Da) and corresponded to a direct GSH addition to the parent molecule with a minor mass error (−0.69 ppm). In the product ion spectra of GS-A1 and GS-A2, there were diagnostic ions at m/z 308.0907 and at 308.1061, respectively. The former fragment ion represented a protonated GSH molecule with a mass accuracy of −1.30 ppm, whereas the latter fragment ion was proposed to be formed due to a neutral loss of a pyroglutamate moiety (129 Da) with a mass accuracy of −2.60 ppm. Correct assignment of the elemental compositions and structures for these two ions was assured by the much greater magnitude of the size difference (>50 ppm) than of the mass errors.
TABLE 1.
Molecular ions [MH+] and main product ions of GS-A1 and GS-A2 detected by high-resolution mass spectrometry
| Determined MH+ | Theoretical MH+ (Elemental Composition) | Mass Error | Characterization | |
|---|---|---|---|---|
| ppm | ||||
| GS-A1 | 437.1486 | 437.1489 (C19H25N4O6S) | −0.69 | Molecular ion |
| MS2 of GS-A1 | 308.0907 | 308.0911 (C10H18N3O6S) | −1.30 | Protonated GSH |
| MS3 of GS-A1 | 233.0586 | 233.0596 (C8H13N2O4S) | −4.29 | Further loss of glycine |
| 179.0485 | 179.0490 (C5H11N2O3S) | −2.79 | Further loss of pyroglutamate | |
| 162.0219 | 162.0225 (C5H8NO3S) | −3.70 | Further loss of pyroglutamate and NH3 | |
| GS-A2 | 437.1486 | 437.1489 (C19H25N4O6S) | −0.69 | Molecular ion |
| MS2 of GS-A2 | 308.1061 | 308.1069 (C14H18N3O3S) | −2.60 | Neutral loss of pyroglutamate |
| MS3 of GS-A2 | 233.0743 | 233.0749 (C12H13N2OS) | −2.57 | Further loss of glycine |
Further fragmentation (MS3) of the ion at m/z 308.0907 (GS-A1) displayed three major product ions that were indicative of cleavage of the GSH moiety. The three fragment ions were at m/z 233.0586 (loss of a glycine), 179.0485 (loss of a pyroglutamate residue), and 162.0219 (loss of an amino-pyroglutamate moiety) (Table 1; Fig. 4 A). The MS3 product ion spectrum of the ion at m/z 308.1061 (GS-A2) revealed a fragment ion at m/z 233.0743, which resulted from a neutral loss of a glycine (Table 1; Fig. 4B). The empirical elemental compositions of the molecular ions and fragment ions of the two adducts were calculated with a high mass accuracy ranging from −4.29 to −0.69 ppm. These unique mass fragmentation patterns strongly suggest that the GSH moiety was attached to an aliphatic carbon in GS-A1 and to an aromatic carbon in GS-A2. Along with the discovered metabolic pathways mediated by CYP2A13, GS-A1 and GS-A2 were thus assigned to be 3-glutathionyl-S-methylindole and 3-methyl-2-glutathionyl-S-indole, respectively, and were proposed to be formed via GSH addition to MEI and via GSH addition to 2,3-epoxy-3MI followed by loss of a water (Scheme 1). The identity of GS-A1 as 3-glutathionyl-S-methylindole was further confirmed by coelution under the same LC conditions and matching MS2 spectra with a synthesized standard (data not shown).
Fig. 4.
Proposed mass fragmentation patterns for two GSH adducts, GS-A1 and GS-A2, that are formed by CYP2A13-mediated metabolism of 3MI. The mass fragmentation patterns were based on MSn product ion spectra obtained using a LTQ Orbitrap instrument, as described under Materials and Methods. A, GS-A1, identified as 3-glutathionyl-S-methylindole. B, GS-A2, identified as 3-methyl-2-glutathionyl-S-indole.
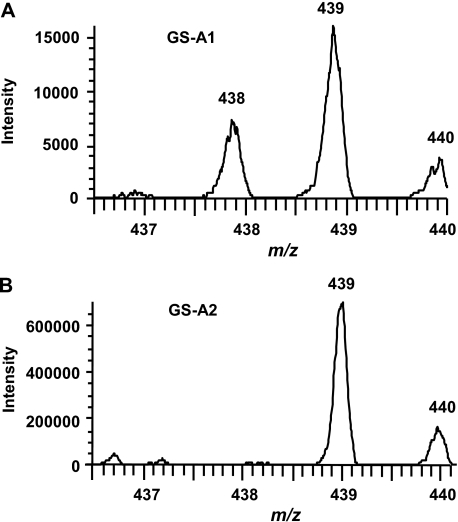
To further confirm the structural assignments and elucidate the pathways of formation for GS-A1 and GS-A2, we incubated CYP2A13 with deuterated analogs of 3MI, 3-d2-MI, and 2-d-3MI, and we analyzed the resulting GSH adducts by LC/MS. When 3-d2-MI was used as a substrate, GS-A1 showed two molecular ions at m/z 438 and 439, derived from loss of a deuterium and a hydrogen from the 3-methyl group, respectively, in addition to direct GSH conjugation (Fig. 5 A; Scheme 2 ). An obvious hydrogen isotope effect was evidenced by our calculation of the intermolecular isotope effect value for the dehydrogenated product, Kh/Kd, as 4.3. These results clearly indicated that GS-A1 was formed by the dehydrogenation pathway initiated by a hydrogen abstraction at the 3-methyl group.
Fig. 5.
Zoom-scan spectra of two GSH adducts, GS-A1 and GS-A2, formed by CYP2A13-mediated metabolism of 3-d2-MI. Incubation mixtures, reaction conditions, and analysis of the resulting GSH adducts are described under Materials and Methods. A, zoom-scan spectrum of GS-A1. B, zoom-scan spectrum of GS-A2.
Scheme 2.
Fates of the deuterium label in the formation of GS-A1 and GS-A2 from deuterium-labeled 3MI. A, 3-d2-MI. B, 2-d-3MI.
On the contrary, in the incubation with 3-d2-MI, GS-A2 only showed one molecular ion at m/z 439, indicating retention of both deuterium atoms (Fig. 5B; Scheme 2). This observation suggests that GS-A2 was not formed through the dehydrogenation pathway. When 2-d-3MI was used as a substrate in the reaction mixture, GS-A2 showed a molecular ion at m/z 437 (data not shown), indicating that the deuterium at the C-2 position was lost and that oxidation occurred at the pyrrole moiety, rather than at the benzene moiety (Scheme 2). Therefore, the formation of GS-A2 can be rationalized in terms of a sequence of 2,3-epoxidation followed by GSH addition at the C-2 position and loss of water. The results from experiments using 3-d2-MI and 2-d-3MI are consistent with the structural assignments of GS-A1 and GS-A2 proposed based on the high-resolution mass analyses.
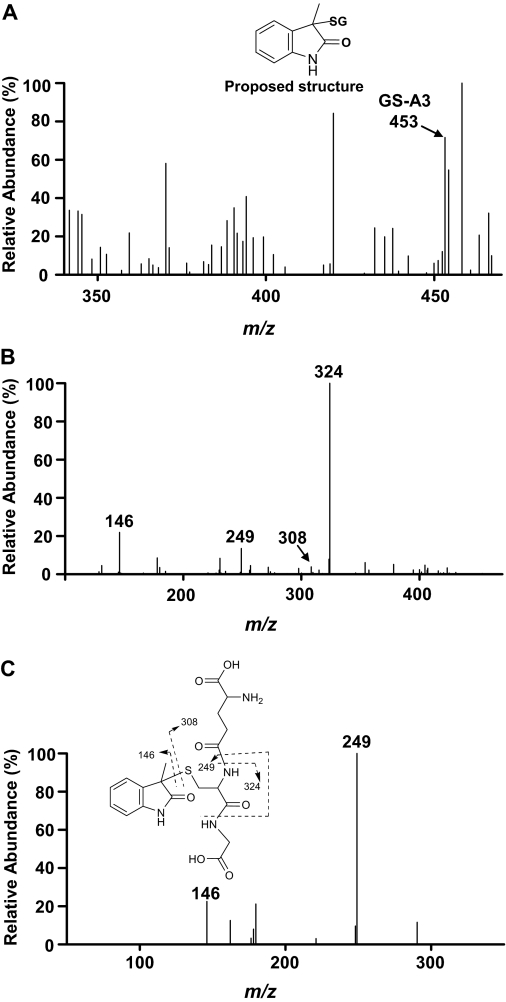
GS-A3, a minor GSH adduct based on its abundance in the LC/UV chromatogram, exhibits a molecular ion at m/z 453; this mass value is 321 Da greater than the mass of the molecular ion of 3MI (Fig. 6 A). The collision-induced dissociation of GS-A3 (m/z 453) generated ions at m/z 324 and 249, which resulted from a neutral loss of pyroglutamate and from a neutral loss of both the pyroglutamate and glycine residues, respectively. A diagnostic MS2 product ion at m/z 146, due to loss of a GSH (307 Da), indicated the cleavage of the thioether bond between GSH and 3MI (Fig. 6, B and C). GS-A3 was not detected by high-resolution mass analysis. In an earlier report, incubations with human liver microsomes produced at least seven distinct GSH adducts detected at m/z 453 (Yan et al., 2007; Zhu et al., 2007); however, cleavage of the thioether bond in the MS2 product ion spectrum is only consistent with 3-glutathionyl-S-3-methyloxindole. Therefore, we propose GS-A3 to be 3-glutathionyl-S-3-methyloxindole; its formation could be rationalized in terms of a nucleophilic attack of 2,3-epoxy-3MI by GSH at the C-3 position, followed by loss of water to form an imine and subsequent oxidation to a lactone (Scheme 1), as was suggested recently (Yan et al., 2007).
Fig. 6.
MSn product ion spectra of a GSH adduct, GS-A3. Incubation mixtures, reaction conditions, and analysis of the resulting GSH adduct are described under Materials and Methods. A, full scan. The inset shows the proposed structure of GS-A3. B, MS2 spectrum of GS-A3 (m/z 453). C, MS3 spectrum of GS-A3 (m/z 324). The inset shows proposed mass fragmentation pattern based on the product ion spectra.
Kinetic Parameters for the Formation of MOI and I-3-C by CYP2A13.
The kinetic parameters of CYP2A13-catalyzed formation of MOI and I-3-C were determined at 3MI concentrations ranging from 0 to 100 μM, whereas the kinetic parameters of CYP2A13-catalyzed formation of GS-A1 were determined with 3MI concentrations ranging from 0 to 200 μM, using conditions under which the rates of product formation were linear with time. The apparent Km and Vmax values are shown in Table 2 . The Km value for the formation of MOI (14.8 μM) is lower than the reported values for any other human P450s examined previously, whereas the Km value for formation of I-3-C (14.3 μM) is very similar to that for CYP1B1, the human P450 previously found to have the lowest Km value (Lanza and Yost, 2001). The Km value for the formation of GS-A1 by CYP2A13 (12.6 μM) is similar to the Km value for the formation of the corresponding NAC-trapped MEI (3MINAC) by CYP2F1, the human P450 previously found to have the lowest Km for 3MI dehydrogenation (Lanza et al., 1999).
TABLE 2.
Apparent kinetic parameters for the formation of I-3-C, MOI, and GS-A1 from 3MI by heterologously expressed CYP2A13
Rates of metabolite formation were determined as described under Materials and Methods. Values represent the means ± S.D. (n = 3) from three separate determinations.
| Metabolite | Vmax | Km | Vmax/Km |
|---|---|---|---|
| nmol/nmol P450/min | μM | ||
| I-3-C | 1.5 ± 0.2 | 14.3 ± 4.6 | 0.10 |
| MOI | 1.9 ± 0.3 | 14.8 ± 6.9 | 0.13 |
| GS-A1 | 0.7 ± 0.0 | 12.6 ± 3.0 | 0.05 |
The catalytic efficiency, expressed as the ratio of Vmax to Km, of CYP2A13 was similar to the catalytic efficiency of CYP2E1, for the formation of MOI (0.10) and also to the catalytic efficiency of CYP1A2, for the formation of I-3-C (0.10); CYP2E1 and CYP1A2 are the most efficient human P450s found previously for these reactions (Lanza and Yost, 2001). In addition, the catalytic efficiency for the formation of GS-A1 (0.05) by CYP2A13 is only slightly lower than the catalytic efficiency for the formation of 3MINAC (0.07) by CYP2F1 (Lanza et al., 1999). These results indicate that CYP2A13 is a highly efficient enzyme for the bioactivation of 3MI, forming I-3-C, MOI, and MEI.
CYP2A13 Inactivation by 3MI.
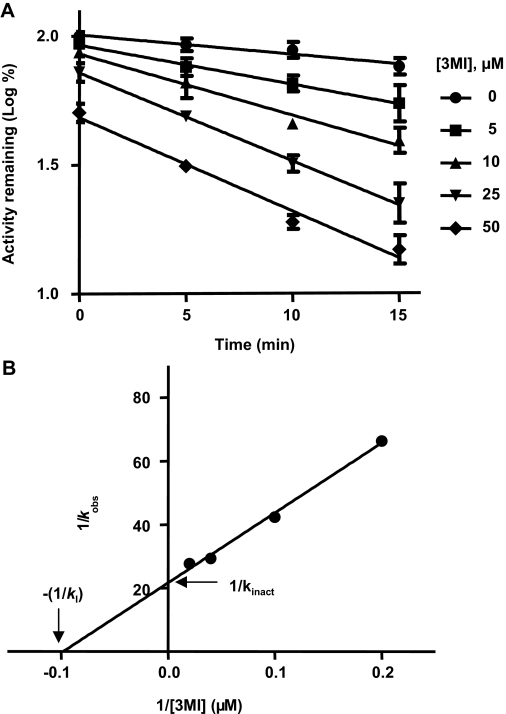
Preincubation of 3MI with CYP2A13 resulted in NADPH-, time-, and concentration-dependent inactivation of CYP2A13, as measured by CYP2A13-mediated metabolism of NNK to keto aldehyde (Fig. 7 ). For unknown reasons, a significant loss in CYP2A13 activity over time, upon incubation at 37°C with no added substrate in the primary incubation mixtures, was observed; the same phenomenon had been reported in a previous study (von Weymarn et al., 2006). Thus, we used a lower incubation temperature, 30°C, for the inhibition kinetic analysis, resulting in significant decreases in 3MI-independent loss of CYP2A13 activity. The observed first-order rate constants (kobs) of the inactivation reaction, at a given 3MI concentration, were calculated from the slopes of the linear regressions of log percent CYP2A13 activity remaining versus preincubation time (Fig. 7A). CYP2A13 lost approximately 85% activity, compared with control reactions preincubated without 3MI, over the 15-min preincubation period, when it was preincubated with 50 μM 3MI. Addition of GSH (to 2 mM final concentration) in the primary reaction mixtures did not protect against the observed loss of activity (data not shown), a result supporting the suicide nature of the inhibition. Figure 7B shows the double reciprocal Kitz-Wilson plot of the first-order rate constants (kobs) against the concentration of 3MI (Kitz and Wilson, 1962; Silverman, 1995). The KI was determined to be 10.2 μM, the kinact was determined to be 0.046 min−1, and the t1/2 of inactivation was determined to be 15.1 min (0.693/kinact). The KI value for the inactivation of CYP2A13 by 3MI is lower than the value reported previously for the inactivation of CYP2F1-mediated metabolism of 7-ethoxycoumarin (49 μM) by 3MI, whereas the kinact value for the inactivation of CYP2A13 by 3MI is higher than the value reported for the inactivation of CYP2F1-mediated metabolism of 7-ethoxycoumarin (0.025 min−1) by 3MI (Kartha and Yost, 2008).
Fig. 7.
NADPH-, time-, and concentration-dependent inactivation of CYP2A13 by 3MI. Incubation and assay conditions were as described under Materials and Methods. The concentrations of 3MI were 0 (control, ●), 5 (■), 10 (▲), 25 (▼), and 50 (♦) μM. Control incubations were carried out in the presence of NADPH but not 3MI. The data represent the means (±S.D.) of three separate determinations. A, plots of preincubation time against activity remaining (log scale; % of 0-min, 0 μM value). The slope of each plot represents the kobs for the inactivation reaction for the given concentration. B, Kitz-Wilson plot for data from A. The KI, kinact, and t1/2 values were calculated to be 10.2 μM, 0.046 min−1, and 15.1 min, respectively.
Discussion
Previous studies (Lanza and Yost, 2001) have shown that epoxidation of the pyrrole moiety of 3MI is one of the major metabolic pathways that can produce toxic consequences, through formation of the reactive intermediates 2,3-epoxy-3MI and HMI (Scheme 1). Epoxidation of 3MI is not the only possible mechanism for formation of MOI; however, in incubations of 3MI with goat lung microsomes, the major portion of the MOI formed was apparently derived from an epoxide intermediate, as demonstrated by the observation of incorporation of an 18O from atmospheric 18O2 into MOI and an NIH shift of hydride from the C-2 carbon to the C-3 carbon (Skordos et al., 1998b). Further evidence for the formation of an epoxide intermediate at the pyrrole moiety came from thiol trapping experiments. In one such experiment, 3-glutathionyl-S-3-methyloxindole, a thioether adduct at the C-3 position of the 2,3-epoxide, was identified in metabolic reactions of 3MI with GSH-fortified human liver microsome (Yan et al., 2007). Additional studies showed that 3-methyl-2-glutathionyl-S-indole was not derived primarily from MEI in human liver microsomal reactions and that the corresponding NAC adduct was not primarily derived from MEI in goat lung microsomal reactions (Skordos et al., 1998a; Yan et al., 2007). The studies presented here have identified MOI and most likely HMI as products of CYP2A13-mediated 3MI metabolism, a result suggesting that CYP2A13 catalyzes the epoxidation of 3MI. In GSH-fortified metabolism reactions with 3MI or 3-d2-MI, we further demonstrated that the formation of GS-A3 and GS-A2 occurred primarily via 2,3-epoxidation.
In a previous study, human liver microsomes were shown to be able to oxidize MOI to a number of metabolites, including GSH adducts in GSH-fortified reactions; this finding led the authors to speculate that further metabolism of MOI is also implicated in 3MI toxicity (Yan et al., 2007). The present studies have indicated that CYP2A13 can catalyze the hydroxylation of MOI; however, the main metabolite, Met1*, was not observed when 3MI was used as the substrate. It is likely that MOI does not accumulate to a sufficiently high concentration that it can compete with the higher concentration of 3MI in the reaction mixture. The situation may be different in vivo, where MOI could accumulate, because of metabolism of 3MI to MOI by other P450s besides CYP2A13. This notion is supported by the fact that the majority of P450s tested to date catalyze the formation of MOI from 3MI.
Another major bioactivation pathway of 3MI involves an initial abstraction of a hydrogen atom from the 3-methyl group to form the putative indolylmethyl radical intermediate; this intermediate subsequently undergoes either oxygen rebound to form I-3-C or a further one-electron oxidation to form MEI (which can also react with water to form I-3-C) (Scheme 1) (Ruangyuttikarn et al., 1991; Skiles and Yost, 1996). It remains unclear whether oxygen rebound or hydration of MEI is the major metabolic pathway for CYP2A13-catalyzed formation of I-3-C from 3MI; nevertheless, the latter pathway was shown to be the primary pathway of I-3-C formation in incubations of 3MI with goat lung microsomes (Skiles and Yost, 1996). Our structural and mechanistic studies on GS-A1 demonstrated that CYP2A13 can catalyze the formation of MEI through dehydrogenation of 3MI. Although many human P450s can metabolize 3MI, relatively few can catalyze the dehydrogenation of 3MI into MEI (Thornton-Manning et al., 1996; Lanza and Yost, 2001). The fact that CYP2A13 can catalyze the formation of MEI from 3MI is significant, because dehydrogenation of 3MI represents a major bioactivation pathway leading to the ultimate pneumotoxicity of the compound (reviewed by Yost, 2001).
The kinetic parameters determined in our study indicate that CYP2A13 is efficient at both 2,3-epoxidation and dehydrogenation of 3MI, producing MOI, I-3-C, and MEI. This versatility is a rather unique property of CYP2A13; most human P450s studied (except CYP1A2) only efficiently metabolize 3MI into either MOI, I-3-C, or MEI (Thornton-Manning et al., 1996; Lanza and Yost, 2001). The catalytic efficiencies of CYP2A13 for the formation of MOI and I-3-C are, respectively, similar to those of CYP2E1 and CYP1B1, the most efficient human enzymes reported previously (Lanza and Yost, 2001). Furthermore, the catalytic efficiency (0.05) of CYP2A13 for the formation of GS-A1, the GSH adduct of the dehydrogenation metabolite MEI, is very close to the catalytic efficiency (0.07) for the formation of 3MINAC (Lanza et al., 1999), the corresponding NAC adduct of MEI, by CYP2F1; CYP2F1 is the most efficient P450 enzyme reported previously for the dehydrogenation of 3MI. CYP2F1 and CYP2A13 are approximately 3- and 2-fold, respectively, more efficient than is the next most efficient enzyme, CYP1A2 (0.02). Therefore, CYP2A13 may play a major role in the bioactivation of 3MI in the human lung, especially at low substrate concentrations. The contribution of CYP2A13 to 3MI bioactivation also depends on other factors, such as the relative expression of the P450 enzymes in human lung and the extent to which each P450 is inactivated by 3MI (if any inactivation occurs).
The fact that CYP2A13 and CYP2F1, both expressed in the human lung, can efficiently dehydrogenate 3MI into the highly reactive intermediate MEI suggests the potential of 3MI to cause pneumotoxicity in humans. Furthermore, CYP2A13 can also efficiently metabolize 3MI into potentially toxic intermediates through other pathways, such as formation of 2,3-epoxy-3MI and HMI. Given the frequency of human exposures to 3MI through diet and cigarette smoke, it is critical that we further investigate the potential toxicity of 3MI to humans and the roles that CYP2A13 and CYP2F1 or other P450 enzymes may play in 3MI bioactivation in vivo.
CYP2A13-mediated metabolism of 3MI results in inactivation of CYP2A13 in a NADPH-, time-, and concentration-dependent manner, probably due to interaction between CYP2A13 and the MEI intermediate. Inactivation of CYP2F1 by 3MI is also proposed to occur through interaction with MEI (Kartha and Yost, 2008). It is noteworthy that despite the finding that CYP2F1-catalyzed metabolism of 3MI results in inactivation of CYP2F1 (Kartha and Yost, 2008), there is evidence indicating that CYP2F1 nonetheless still plays a significant role in the toxicity of 3MI. For example, it has been demonstrated that BEAS-2B cells overexpressing CYP2F1 showed decreased (by 66%) cell viability when treated with 3MI, compared with the control cells at 48 h after the treatment (Nichols et al., 2003).
Inactivation of CYP2A13 in the human lung resulting from exposure to 3MI, could have a significant impact on the ability of CYP2A13 to metabolize other xenobiotics. This is particularly important in the case of CYP2A13-mediated metabolism of NNK, because both NNK and 3MI are found in cigarette smoke and because CYP2A13 is believed to play a major role in NNK bioactivation in human lung (Su et al., 2000; Zhang et al., 2007). The catalytic efficiency of CYP2A13-catalyzed α-methylene hydroxylation of NNK, ranging from 0.36 to 3.9 (reviewed by Jalas et al., 2005), is at least 7-fold greater than the efficiency determined for GS-A1 (0.05) formation in this study. However, the level of 3MI in mainstream smoke (∼14 μg/cigarette) (Hoffmann and Rathkamp, 1970) seems to be higher than the level of NNK in mainstream smoke (from <4 to 1749 ng/cigarette) (Fischer et al., 1990). On the other hand, numerous other chemicals are present in cigarette smoke, including ones known to inhibit CYP2A13, such as nicotine (von Weymarn et al., 2006). The presence of these other compounds, which can serve as either competitive or suicide inactivators for CYP2A13, is expected to decrease the activity of CYP2A13 toward 3MI and to thereby reduce the chances of suicide inactivation of the enzyme by 3MI. In any case, whether suicide inactivation of CYP2A13 occurs in vivo and to what extent it affects the role of CYP2A13 in the bioactivation of 3MI and NNK, warrant further study.
In summary, we have demonstrated that CYP2A13 is active in both epoxidation and dehydrogenation of 3MI, forming multiple reactive intermediates that can lead to cytotoxicity. We also discovered that CYP2A13 is inactivated by 3MI in a time-, concentration-, and NADPH-dependent manner. Further investigations into the toxicological consequences of 3MI metabolism by CYP2A13, in cell-based models or CYP2A13-transgenic mice, are needed, if we are to predict the impact of CYP2A13-catalyzed metabolism of 3MI in human lung and nasal mucosa.
Acknowledgments.
We thank Dr. Adriana Verschoor of the Wadsworth Center for reading the manuscript.
This work was supported in part by the National Institutes of Health National Cancer Institute [Grant CA092596]; the National Institutes of Health National Institute of Environmental Health Sciences [Grant ES007462]; the National Institutes of Health National Institute of General Medical Sciences [Grant GM074249]; and the National Institutes of Health National Heart, Lung, and Blood Institute [Grant HL13645].
Article, publication date, and citation information can be found at http://dmd.aspetjournals.org.
- 3MI
- 3-methylindole
- P450
- cytochrome P450
- MEI
- 3-methyleneidolenine
- HMI
- 3-hydroxy-3-methyleneindolenine
- NNK
- 4-(methylnitrosamino)-1-(3-pyridyl)-1-butanone
- CPR
- NADPH-cytochrome P450 reductase
- HPLC
- high-performance liquid chromatography
- GSH
- glutathione
- GSX
- γ-glutamyl-cysteinyl-[13C2-15N]-glycine
- 3-d2-MI
- 3-([2H2]-methyl)indole
- 2-d-3MI
- 2-[2H]-3-methylindole
- 3MINAC
- 3-[ (N-acetylcystein-S-yl)methyl]indole
- LC
- liquid chromatography
- MS
- mass spectrometry
- MOI
- 3-methyloxindole
- I-3-C
- indole-3-carbinol
- GS-A1
- glutathione adduct 1
- GS-A2
- glutathione adduct 2
- GS-A3
- glutathione adduct 3
- NAC
- N-acetylcysteine.
References
- Adams JD, Jr, Laegreid WW, Huijzer JC, Hayman C, Yost GS. (1988) Pathology and glutathione status in 3-methylindole-treated rodents. Res Commun Chem Pathol Pharmacol 60:323–336 [PubMed] [Google Scholar]
- Carlson JR, Yost GS. (1989) 3-methylindole-induced acute lung injury resulting from ruminal fermentation of tryptophan, in Toxicants of Plant Origin ( Cheeke PR. ed) vol 3, pp 107–123, CRC Press, Boca Raton, FL [Google Scholar]
- D'Agostino J, Zhang X, Wu H, Ling G, Wang S, Zhang QY, Liu F, Ding X. (2008) Characterization of CYP2A13*2, a variant cytochrome P450 allele previously found to be associated with decreased incidences of lung adenocarcinoma in smokers. Drug Metab Dispos 36:2316–2323 [DOI] [PMC free article] [PubMed] [Google Scholar]
- Diaz GJ, Skordos KW, Yost GS, Squires EJ. (1999) Identification of phase I metabolites of 3-methylindole produced by pig liver microsomes. Drug Metab Dispos 27:1150–1156 [PubMed] [Google Scholar]
- Diaz GJ, Squires EJ. (2000) Role of aldehyde oxidase in the hepatic in vitro metabolism of 3-methylindole in pigs. J Agric Food Chem 48:833–837 [DOI] [PubMed] [Google Scholar]
- Fischer S, Spiegelhalder B, Preussmann R. (1990) Tobacco-specific nitrosamines in European and USA cigarettes. Arch Geschwulstforsch 60:169–177 [PubMed] [Google Scholar]
- Fordtran JS, Scroggie WB, Polter DE. (1964) Colonic absorption of tryptophan metabolites in man. J Lab Clin Med 64:125–132 [PubMed] [Google Scholar]
- Fukami T, Katoh M, Yamazaki H, Yokoi T, Nakajima M. (2008) Human cytochrome P450 2A13 efficiently metabolizes chemicals in air pollutants: naphthalene, styrene, and toluene. Chem Res Toxicol 21:720–725 [DOI] [PubMed] [Google Scholar]
- Gaskell BA. (1990) Nonneoplastic changes in the olfactory epithelium—experimental studies. Environ Health Perspect 85:275–289 [DOI] [PMC free article] [PubMed] [Google Scholar]
- He XY, Tang L, Wang SL, Cai QS, Wang JS, Hong JY. (2006) Efficient activation of aflatoxin B1 by cytochrome P450 2A13, an enzyme predominantly expressed in human respiratory tract. Int J Cancer 118:2665–2671 [DOI] [PubMed] [Google Scholar]
- Hoffmann D, Rathkamp G. (1970) Quantitative determination of l-alkylindoles in cigarette smoke. Anal Chem 42:366–370 [DOI] [PubMed] [Google Scholar]
- Huijzer JC, Adams JD, Jr, Jaw JY, Yost GS. (1989) Inhibition of 3-methylindole bioactivation by the cytochrome P450 suicide substrates 1-aminobenotrazole and α-methylbenzylaminobenzotriazole. Drug Metab Dispos 17:37–42 [PubMed] [Google Scholar]
- Jalas JR, Hecht SS, Murphy SE. (2005) Cytochrome P450 enzymes as catalysts of metabolism of 4-(methylnitrosamino)-1-(3-pyridyl)-1-butanone, a tobacco specific carcinogen. Chem Res Toxicol 18:95–110 [DOI] [PubMed] [Google Scholar]
- Johns DG. (1967) Human liver aldehyde oxidase: differential inhibition of oxidation of charged and uncharged substrates. J Clin Invest 46:1492–1505 [DOI] [PMC free article] [PubMed] [Google Scholar]
- Kartha JS, Yost GS. (2008) Mechanism-based inactivation of lung-selective cytochrome P450 CYP2F enzymes. Drug Metab Dispos 36:155–162 [DOI] [PubMed] [Google Scholar]
- Kassahun K, Skordos K, McIntosh I, Slaughter D, Doss GA, Baillie TA, Yost GS. (2005) Zafirlukast metabolism by cytochrome P450 3A4 produces an electrophilic α,β-unsaturated iminium species that results in the selective mechanism-based inactivation of the enzyme. Chem Res Toxicol 18:1427–1437 [DOI] [PubMed] [Google Scholar]
- Kitz R, Wilson IB. (1962) Esters of methanesulfonic acid as irreversible inhibitors of acetylcholinesterase. J Biol Chem 237:3245–3249 [PubMed] [Google Scholar]
- Lanza DL, Code E, Crespi CL, Gonzalez FJ, Yost GS. (1999) Specific dehydrogenation of 3-methylindole and epoxidation of naphthalene by recombinant human CYP2F1 expressed in lymphoblastoid cells. Drug Metab Dispos 27:798–803 [PubMed] [Google Scholar]
- Lanza DL, Yost GS. (2001) Selective dehydrogenation/oxygenation of 3-methylindole by cytochrome P450 enzymes. Drug Metab Dispos 29:950–953 [PubMed] [Google Scholar]
- Nakajima M, Itoh M, Sakai H, Fukami T, Katoh M, Yamazaki H, Kadlubar FF, Imaoka S, Funae Y, Yokoi T. (2006) CYP2A13 expressed in human bladder metabolically activates 4-aminobiphenyl. Int J Cancer 119:2520–2526 [DOI] [PubMed] [Google Scholar]
- Nichols WK, Mehta R, Skordos K, Macé K, Pfeifer AM, Carr BA, Minko T, Burchiel SW, Yost GS. (2003) 3-Methylindole-induced toxicity to human bronchial epithelial cell lines. Toxicol Sci 71:229–236 [DOI] [PubMed] [Google Scholar]
- Regal KA, Laws GM, Yuan C, Yost GS, Skiles GL. (2001) Detection and characterization of DNA adducts of 3-methylindole. Chem Res Toxicol 14:1014–1024 [DOI] [PubMed] [Google Scholar]
- Ruangyuttikarn W, Appleton ML, Yost GS. (1991) Metabolism of 3-methylindole in human tissues. Drug Metab Dispos 19:977–984 [PubMed] [Google Scholar]
- Silverman RB. (1995) Mechanism-based enzyme inactivators. Methods Enzymol 249:240–283 [DOI] [PubMed] [Google Scholar]
- Skiles GL, Yost GS. (1996) Mechanistic studies on the cytochrome P450-catalyzed dehydrogenation of 3-methylindole. Chem Res Toxicol 9:291–297 [DOI] [PubMed] [Google Scholar]
- Skordos KW, Laycock JD, Yost GS. (1998a) Thioether adducts of a new imine reactive intermediate of the pneumotoxin 3-methylindole. Chem Res Toxicol 11:1326–1331 [DOI] [PubMed] [Google Scholar]
- Skordos KW, Skiles GL, Laycock JD, Lanza DL, Yost GS. (1998b) Evidence supporting the formation of 2,3-epoxy-3-methylindoline: a reactive intermediate of the pneumotoxin 3-methylindole. Chem Res Toxicol 11:741–749 [DOI] [PubMed] [Google Scholar]
- Su T, Bao Z, Zhang QY, Smith TJ, Hong JY, Ding X. (2000) Human cytochrome P450 CYP2A13: predominant expression in the respiratory tract and its high efficiency metabolic activation of a tobacco-specific carcinogen, 4-(methylnitrosamino)-1-(3-pyridyl)-1-butanone. Cancer Res 60:5074–5079 [PubMed] [Google Scholar]
- Sun H, Yost GS. (2008) Metabolic activation of a novel 3-substituted indole-containing TNF-α inhibitor: dehydrogenation and inactivation of CYP3A4. Chem Res Toxicol 21:374–385 [DOI] [PubMed] [Google Scholar]
- Thornton-Manning J, Appleton ML, Gonzalez FJ, Yost GS. (1996) Metabolism of 3-methylindole by vaccinia-expressed P450 enzymes: correlation of 3-methyleneindolenine formation and protein-binding. J Pharmacol Exp Ther 276:21–29 [PubMed] [Google Scholar]
- Thornton-Manning JR, Ruangyuttikarn W, Gonzalez FJ, Yost GS. (1991) Metabolic activation of the pneumotoxin, 3-methylindole, by vaccinia-expressed cytochrome P450s. Biochem Biophys Res Commun 181:100–107 [DOI] [PubMed] [Google Scholar]
- Tournel G, Cauffiez C, Billaut-Laden I, Allorge D, Chevalier D, Bonnifet F, Mensier E, Lafitte JJ, Lhermitte M, Broly F, et al. (2007) Molecular analysis of the CYP2F1 gene: identification of a frequent non-functional allelic variant. Mutat Res 617:79–89 [DOI] [PubMed] [Google Scholar]
- von Weymarn LB, Brown KM, Murphy SE. (2006) Inactivation of CYP2A6 and CYP2A13 during nicotine metabolism. J Pharmacol Exp Ther 316:295–303 [DOI] [PubMed] [Google Scholar]
- Yan Z, Easterwood LM, Maher N, Torres R, Huebert N, Yost GS. (2007) Metabolism and bioactivation of 3-methylindole by human liver microsomes. Chem Res Toxicol 20:140–148 [DOI] [PubMed] [Google Scholar]
- Yost GS. (1989) Mechanisms of 3-methylindole pneumotoxicity. Chem Res Toxicol 2:272–279 [DOI] [PubMed] [Google Scholar]
- Yost GS. (2001) Bioactivation of toxicants by cytochrome P450-mediated dehydrogenation mechanisms. Adv Exp Med Biol 500:53–62 [DOI] [PubMed] [Google Scholar]
- Zhang X, D'Agostino J, Wu H, Zhang QY, von Weymarn L, Murphy SE, Ding X. (2007) CYP2A13: variable expression and role in human lung microsomal metabolic activation of the tobacco-specific carcinogen 4-(methylnitrosamino)-1-(3-pyridyl)-1-butanone. J Pharmacol Exp Ther 323:570–578 [DOI] [PubMed] [Google Scholar]
- Zhang X, Su T, Zhang QY, Gu J, Caggana M, Li H, Ding X. (2002) Genetic polymorphisms of the human CYP2A13 gene: identification of single-nucleotide polymorphisms and functional characterization of an Arg257Cys variant. J Pharmacol Exp Ther 302:416–423 [DOI] [PubMed] [Google Scholar]
- Zhu M, Ma L, Zhang H, Humphreys WG. (2007) Detection and structural characterization of glutathione-trapped reactive metabolites using liquid chromatography-high-resolution mass spectrometry and mass defect filtering. Anal Chem 21:8333–8341 [DOI] [PubMed] [Google Scholar]


