

Abstract
In the present article we describe the gas-phase dissociation behavior of the dimeric form of monocyte chemoattractant protein-1 (MCP-1) using quadrupole-traveling wave ion mobility-time of flight mass spectrometry (q-TWIMS-TOF MS) (Waters Synapt™). Through investigation of the 9+ charge state of the dimer, we were able to monitor dissociation product ion (monomer) formation as a function of activation energy. Using ion mobility, we were able to observe precursor ion structural changes occurring throughout the activation process. Arrival time distributions (ATDs) for the 5+ monomeric MCP-1 product ions, derived from the gas-phase dissociation of the 9+ dimer, were then compared with ATDs obtained for the 5+ MCP-1 monomer isolated directly from solution. The results show that the dissociated monomer is as compact as the monomer arising from solution, regardless of the trap collision energy (CE) used in the dissociation. The solution-derived monomer, when collisionally activated, also resists significant unfolding within measure. Finally, we compared the collisional activation data for the MCP-1 dimer with an MCP-1 dimer non-covalently bound to a single molecule of the semi-synthetic glycosaminoglycan (GAG) analog Arixtra™; the latter a therapeutic anti-thrombin III-activating pentasaccharide. We observed that while dimeric MCP-1 dissociated at relatively low trap CEs, the Arixtra-bound dimer required much higher energies, which also induced covalent bond cleavage in the bound Arixtra molecule. Both the free and Arixtra-bound dimers became less compact and exhibited longer arrival times with increasing trap CEs, albeit the Arixtra-bound complex at slightly higher energies. That both dimers shifted to longer arrival times with increasing activation energy, while the dissociated MCP-1 monomers remained compact, suggests that the longer arrival times of the Arixtra-free and Arixtra-bound dimers may represent a partial breach of non-covalent interactions between the associated MCP-1 monomers, rather than extensive unfolding of individual subunits. The fact that Arixtra preferentially binds MCP-1 dimers and prevents dimer dissociation at comparable activation energies to the Arixtra-free dimer, may suggest that the drug interacts across the two monomers, thereby inhibiting their dissociation.
Keywords: ion mobility, non-covalent complex, nano-electrospray ionization, chemokine, glycosaminoglycan
1. Introduction
The introduction of electrospray ionization (ESI) [1-4] allowed for the explosive growth of mass spectral analysis to each of the key classes of biological molecules. Complementing this expansion were several early studies describing the non-covalent associations of biomolecules by mass spectrometry (MS) [5-7]. In the years since, MS analysis of non-covalent complexes has materialized as a valuable asset in the structural biology toolbox [8-11]. While both benefits and drawbacks to MS-non-covalent analysis exist, the particular advantages of speed and sensitivity continue to drive wide-spread applications especially in cases of heterogeneous or quantity-limited samples [12-15].
Ion mobility spectrometry (IMS) is an analytical technique capable of gas-phase structural analysis. Fundamentally, all variations of the technique rely on the reduced mobility of a gas-phase ion upon collisions with neutral gas molecules. A separation is achieved based on the collision cross section available for interaction with the gas. Compact molecular ions drift faster, while those with more extended structures drift slower allowing for separation [16-21]. Mass spectrometers are frequently employed as detectors at the back end of ion mobility instruments adding the additional dimension of mass analysis to the mobility separated ions [20, 22].
Since its inception IMS-MS analysis has remained the realm of the laboratories which designed and constructed their own specialized instruments [21]. However, two IMS-MS configurations have recently been made commercially available, one based on a traveling wave ion mobility spectrometry (TWIMS) [23-25], and another based on field-asymmetric waveform ion mobility spectrometry (FAIMS) [26, 27]. With these developments, the number of practitioners of IMS-MS and the range of applications are expected to increase dramatically.
Monocyte chemoattractant protein-1 (MCP-1, also called CCL2) is a member of the family of chemo-attractant cytokines, or chemokines [28]. These small 8-10 kDa proteins are responsible for directing leukocyte migration in various immune and inflammatory responses [29-32]. MCP-1, like many other chemokines, exists in equilibrium between monomer, dimer, and possibly higher oligomeric forms [33-36]. Oligomerization has also been shown to be related to glycosaminoglycan (GAG) binding [33, 37]. While the MCP-1 monomer activates its cognate receptors, both GAG-binding and oligomerization have proven indispensible for in vivo activity [38]. Thus the investigation of such properties may potentiate alternative strategies to modulate the chemokine system for therapeutic benefit.
Previously our group has identified the non-covalent interactions of MCP-1 with heparin, and heparan sulfate oligosaccharides, other homologous chemokines, and screened inhibitors based on their ability to interrupt the chemokine-GAG interaction [35, 36, 39, 40]. In the present study we have applied nano-electrospray (nESI) coupled quadrupole-traveling wave ion mobility-time of flight mass spectrometry (q-TWIMS-TOF MS, Waters Synapt) to probe the non-covalent MCP-1 dimer, the MCP-1 monomer, and the MCP-1 dimer associated with a single molecule of the GAG analog, Arixtra. Through a series of collisional activation experiments we probed the Arixra-free MCP-1 dimer for its dissociation behavior and activation-associated structural transitions. The results of these experiments prompted us to also investigate the behavior of the MCP-1 monomer when subjected to collisional activation. Finally we compared the results for the Arixtra-free dimer to those obtained for a MCP-1 dimer bound non-covalently to a single molecule of Arixtra. The 9+ Arixtra-free dimer became less compact (shifted to longer arrival time) with increasing activation energy and also dissociated predominantly in a mass to charge symmetric manner (to 5+ and 4+ monomers). The shift of the dimer to longer arrival time was largely complete with the application of 21V trap collision energy (CE), however it completely dissociated with the application of 27 V trap CE. Symmetric mass to charge partitioning suggests that each of the dissociated monomers is similarly folded or compact. In order to address this, the ATDs of the gas-phase-dissociated and solution-derived monomers were compared to assess differences in the 5+ charge state. Interestingly the monomer generated from the gas-phase dissociation of dimer was as compact as the solution-derived monomer. Likewise, the solution derived monomer resisted significant measurable unfolding with increased activation energies, suggesting a particularly stable structure. The Arixtra-bound dimer also became less compact when collisionally activated, but resisted dissociation to product ions over the voltages used to dissociate the Arixtra-free dimer. Complete dissociation of the dimer plus Arixtra complex required the application of 72 V trap CE, and complex dissociation was concomitant with covalent bond cleavage in the bound Arixtra molecule. Given that Arixtra stabilizes the MCP-1 dimer suggests that it does so by interacting with both monomers composing the dimer. This hypothesis is also consistent with the observation that Arixtra preferentially binds MCP-1 dimers [35].
2. Materials and Methods
2.1. Protein expression
Monocyte chemoattractant protein-1 (MCP-1; Met-, M64I) was expressed and purified as previously described [36, 39]. Briefly, the soluble protein was expressed in E. coli (TAP 302 variant) with both disulfide bonds intact. The protein was initially purified by cation exchange fast protein liquid chromatography (FPLC) using two tandem HiTrap™ SP HP columns (GE Healthcare Bio-Sciences Corp, Piscataway, NJ). The product was acidified, centrifuged to remove precipitate, and filtered prior to semi-preparative C18 reverse-phase high performance liquid chromatography (RP-HPLC) on a Waters YMC ODS column (Waters Corp, Milford, MA). The sample was then freeze-dried to remove chromatography solvents, resuspended in 75 mM Tris, pH 8, and treated with aminopeptidase M (Peprotech, Rocky Hill, NJ) to remove the N-terminal methionine. The amino acid sequence of the final protein product was QPDAINAPVT CCYNFTNRKI SVQRLASYRR ITSSKCPKEA VIFKTIVAKE ICADPKQKWV QDSIDHLDKQ TQTPKT [41]. Finally the protein was re-purified by RP-HPLC, freeze-dried, and stored at -80° C. Working stock solutions (approximately 500 μM protein) were stored in 100 mM NH4OAc (ammonium acetate), pH 6.8, at -80° C. The final product was analyzed by ESI-MS yielding the appropriate molecular mass of 8662.5 Da for the doubly disulfide-bonded MCP-1 monomer. A small amount of truncated MCP-1 (8,438 Da) which results from cleavage between proline-2 and aspartate-3 during the acidification step was also present in the final solution along with a small amount of contaminant of 5,101 Da.
2.2. GAG preparation
The GAG analog Arixtra® (fondaparinux, fully-protonated neutral mass 1506.95 Da) which is used therapeutically as an anti-coagulant was purchased from GlaxoSmithKline (Research Triangle Park, NC). The fully-sodiated structure of Arixtra, as provided by the manufacturer [42], is provided in FIGURE 5. The figure was adapted using ChemDraw (www.cambridgesoft.com). Prior to MS analysis, 100 μl of a 5 mg/ml solution of Arixtra were subjected to dialysis using a dispo-biodialyzer (The Nest Group, Southborough, MA) with a 1000 molecular weight cut-off regenerated cellulose membrane.
FIGURE 5.

The chemical structure for Arixtra. The structure shown displays the sodiated version of the drug which is provided by the manufacturer as a sodium salt. As described in the methods section we desalted the drug prior to mass spectral analysis. A desalted fully protonated version of the drug has a theoretical molecular mass of 1506.95 Da.
2.3. Non-covalent complex assembly and borosilicate capillary production
Non-covalent complexes were prepared by mixing the requisite components in 100 mM NH4OAc, pH 6.8 (Sigma-Aldrich, St. Louis, MO). Nano-electrospray of the non-covalent complex containing solutions was performed using in-house prepared, gold-coated, 1mm O.D., 0.78 mm I.D. borosilicate glass capillaries (Sutter Instrument Company, Novato, CA). The capillaries were pulled on a Sutter P-97 Flaming/Brown micropipette puller, and gold coated using a Quorum Technologies SC7640 sputter coater (Ringmer, East Sussex, UK).
2.4. IMS-MS parameters
IMS-MS analyses were performed on a Waters Synapt™ HDMS™ system (Waters Corp, Milford, MA). Generally the following parameters were used without modification: nESI capillary voltage, 0.6 kV; sample cone, 5 V; extraction cone, 0 V; transfer CE, 5 V; trap gas flow, 2.5 ml/min (Ar); IMS gas flow, 24 ml/min (N2); trap direct current bias, 15 V. To minimize unintended ion activation each of the preceding voltages was chosen to run as low as possible while facilitating ion transmission. As source pressure has previously been observed to affect the observance of non-covalent complexes in mass spectral analyses [43-45], we also optimized the backing pressure on the Synapt to preserve non-covalent oligomers of MCP-1. This pressure was set to 3.5 mBar using a Speedi valve regulating the vacuum supplied to the ion source by the backing Scroll pump. The traveling wave height was ramped over 100% of the IMS cycle between 0 and 20 V. The time of flight analyzer (TOF) was calibrated with a solution of cesium iodide and set to detect ions up to 4,000 m/z. This TOF mass range corresponds to a pusher period of 90 μs. The value of 90 μs is important because it is the minimal difference in arrival time distinguishable in ion mobility experiments, as each scan of the mass spectrum defines each bin of the mobility separation. The radio frequency (RF) generator supplying the quadrupole allowed for isolation of ions up to 8,000 m/z. Full mass spectra in figures 1A and 6 were acquired with a trap CE of 5 V, and the quadrupole set for fixed mass of 1000 m/z in RF-only mode. For mass to charge-selected ions (in resolving quad-mode) LM resolution was set to 7.0, and HM resolution to 15.0 with the quadrupole set to isolate the m/z of interest; 1926 m/z for the 9+ Arixtra-free MCP-1 dimer, 2093 m/z for the 9+ Arixtra-bound dimer, and 1733 m/z for the 5+ MCP-1 monomer. Collisional activation of mass to charge-selected ions was performed by manually increasing the trap CE to the indicated values while successive spectra were individually acquired. Generally, each spectrum was acquired for 3 minutes, with the exception of that shown in figure 8, which was acquired for 10 minutes to improve the fragment ion data.
FIGURE 1.
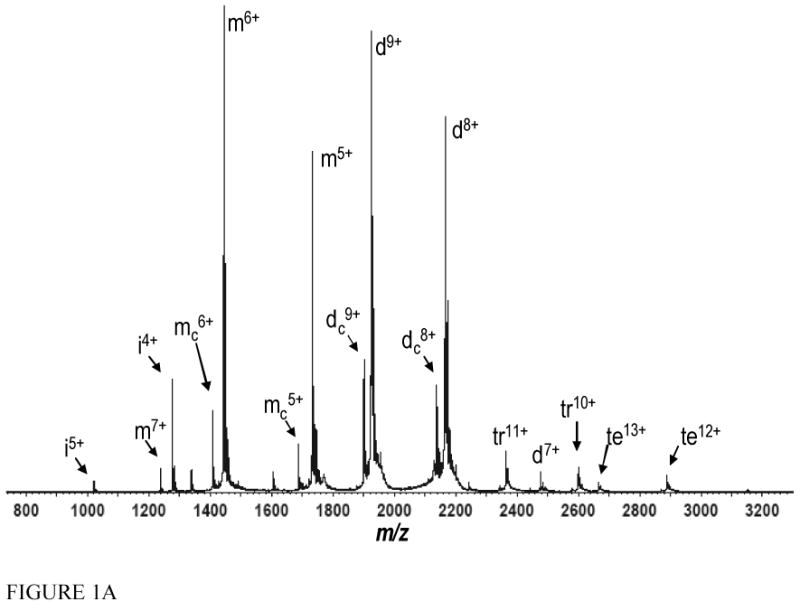

Figure 1A. The full mass spectrum obtained from a solution of 10 μM MCP-1 in 100 mM NH4OAc. Monomers, dimers, trimers, and tetramers are denoted m, d, tr, and te, respectively. mc represents a truncated version of MCP-1 which has been cleaved between proline two and aspartate three, measured mass 8,438 Da (see methods). dc is dimer composed of one truncated MCP-1 monomer and one full length monomer. i is an impurity with a measured mass of 5,101 Da. Full length MCP-1 has a molecular mass of 8662.5 Da.
Figure 1B. Ion mobility heat map plotting arrival time versus m/z with intensity represented by the color scale provided. Data represents the same 10 μM solution of MCP-1 shown in figure 1A. Species from monomers to tetramers are denoted using the same notation as in 1A.
FIGURE 6.
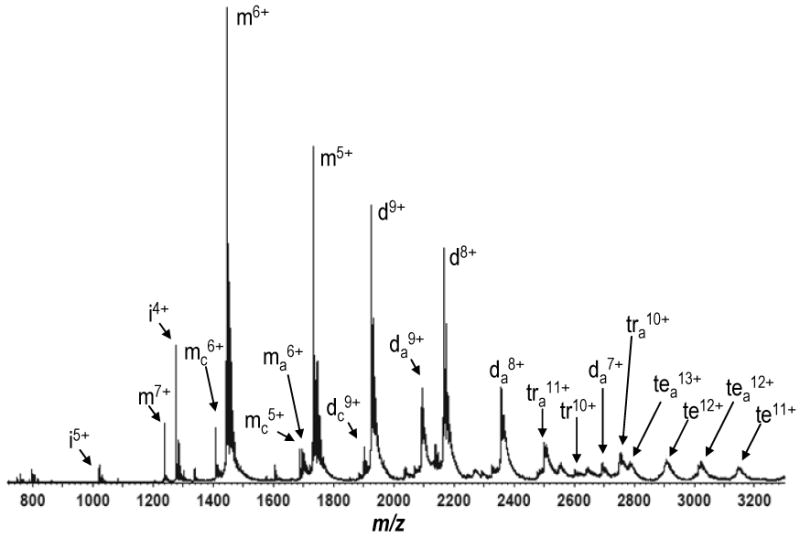
The full mass spectrum obtained after spraying a solution of 10 μM MCP-1 and 20 μM Arixtra in 100 mM NH4OAc. Annotations are the same as in figure 1A, with the exception that Arixtra-bound species are denoted with the subscript a.
FIGURE 8.
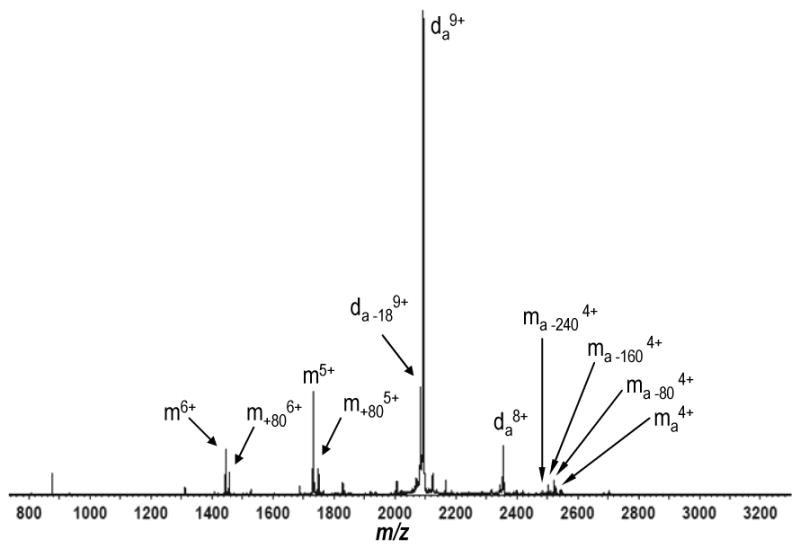
Mass spectrum obtained for the mass to charge-selected 9+ MCP-1 dimer: Arixtra complex (da9+) with the application of 57V trap collision energy. Included in the dissociation products is a 4+ MCP-1 monomer still bound by a single molecule of Arixtra, ma4+. 4+ MCP-1 monomers bound to Arixtra with sequential losses of 80 Daltons are also observed denoted as ma -80, ma -160, and ma -240. These ions represent losses of SO3 from the bound molecule of Arixtra. We also observe un-adducted 6+, and 5+ monomers of MCP-1 as well as each carrying an 80-Dalton adduct which represents a non-covalently bound SO3 group dissociated from the Arixtra, denoted m+80. Water loss is observed from the 9+ dimer plus Arixtra complex, da -189+, and a proton-stripped dimer: Arixtra complex is present, da8+.
3. Results and Discussion
3.1. At 10 μM, MCP-1exists predominantly in monomer/dimer equilibrium
Gentle spray conditions, particularly nESI, in combination with IMS-MS, can be a particularly useful combination for identifying oligomers present in a protein solution. In addition to low sample consumption and high efficiency [46, 47], nESI, which operates at lower voltages, has been described as an even gentler ionization process than traditional ESI [8, 48, 49]. Furthermore given the smaller initial droplet size attained in nESI, non-specific aggregation may also be mitigated [48]. Meanwhile in IMS analysis, due to a decrease in exposed surface area and collision cross section per subunit in the oligomeric state, oligomers will almost always drift faster than monomers of the same mass to charge ratio [20, 24, 50, 51]. With regards to MCP-1, the m/z ratios of some odd charge states help differentiate dimers from monomers in the full scan mass spectrum. For instance the 9+ charge state of the MCP-1 dimer occurs at a m/z where no monomer can be observed, because a monomer will never carry 4.5 charges. However IMS can be employed to verify whether monomers, dimers, or both exist in significant proportions when MS alone proves ambiguous as these structures will have different cross sections leading to different ATDs [50]. Using nESI IMS-MS, we were able to establish that at a10 μM solution of MCP-1 in 100 mM NH4OAc (pH 6.8) exists primarily as monomers and dimers, which is in agreement with our previous work and analytical ultracentrifugation [33, 36] (FIGURE 1A and 1B). At much lower intensity, trimers and tetramers are also observed, however the specificity of these low intensity oligomers is questionable (FIGURE 1A and 1B). We also observed that chemokine oligomer arrival times tend to roughly fall into line through the charge states of a given oligomer (FIGURE 1B). This property has been an aid in correctly annotating mass spectral data, and has been observed previously (in terms of cross section) for oligomers of a mutant amyloid β-42 protein [50].
3.2. The gas-phase 9+ MCP-1 dimer is a labile assembly which dissociates in a mass to charge symmetric manner
The MCP-1 dimer was isolated in the quadrupole of the mass spectrometer, prior to trap and IMS regions, facilitating further study. For our experiments, the 9+ charge state of the dimer at 1926 m/z was chosen for isolation so that the appearance of dissociation product monomers could be monitored at separate m/z ratios from the mass to charge-selected dimer. We observed that at the lowest applicable voltages permitting ion transmission (including 3 V trap CE), a small percentage of the dimer dissociates (Figure 2) signifying that the gas-phase MCP-1 dimer is not particularly stable. Using a 6 V trap CE, with all other voltages held constant, the amount of dimer dissociating is essentially unchanged, indicating that at these low voltages the dissociation is independent of the voltage applied at the trap (data not shown). However, application of trap CEs greater than 6 V induce further dissociation of the dimer, and at 27 V dissociation is complete (Figures 2). The fact that the dimer begins to dissociate at the lowest activation energies suggests that it is not particularly stable in the gas-phase.
FIGURE 2.

Mass spectra obtained after isolating the 9+ dimer of MCP-1 at 1926 m/z in the quadrupole region of the instrument. In successive acquisitions the trap collision energy was increased to the voltages at right to impart dissociation of the dimer. Monomers and dimers are denoted as m, and d, respectively.
It is of further interest that mass to charge partitioning in the dissociation products is predominantly symmetric. Studies suggest that asymmetric mass to charge partitioning correlates with a loss of tertiary structure within the dissociated monomer [52-54]. The MCP-1 monomer is relatively small protein of 76 amino acids, which contains two intramolecular disulfide bonds (C11-C36 and C12-C52) which lock in some of the three-dimensional structure [34]. The observance of symmetric mass to charge partitioning upon dissociation of the MCP-1 dimer suggests that each monomer remains at least partially folded after the dissociation process, if not completely compact. The disulfide bonds likely facilitate this outcome. Our observations regarding the naturally occurring MCP-1 dimer are somewhat analogous to that of Williams and coworkers when studying cytochrome C [54]. In this example the authors were able to force cytochrome C dimers to dissociate in a mass to charge symmetric manner by addition of conformational constraints (intramolecular cross-links). Similarly the same authors showed that dimers containing one disulfide-reduced, and one disulfide-intact subunit of α-lactoglobulin dissociated asymmetrically, with the disulfide-reduced subunit carrying away the bulk of the charge [53].
3.3. The 5+ MCP-1 monomer which dissociates from the activated 9+ dimer is similarly compact as the 5+ monomer arising from solution
To assess whether measurable unfolding was occurring in the dissociated MCP-1 monomers, we compared the ATDs for the 5+ monomer dissociated from the collisionally activated 9+ dimer with the ATDs for the 5+ monomer present from solution. The results show that regardless of the collision energy used in the dissociation, the ejected 5+ monomers remain similarly compact arriving between 8.66 and 8.75 ms (within 90 μs, or one scan of the TOF) (FIGURE 3A). There are, however, anomalous, but reproducible, shoulders present on each of peaks present at 3 and 9 V trap CEs. For comparison, the 5+ monomer arising from solution was mass to charge-selected in the quadrupole at 1733 m/z (SUPPLEMENTAL FIGURE 1). Interestingly at the lowest applied trap CE, 3 V, the 5+ monomer from solution is similarly compact as the 5+ monomer generated by collision induced dissociation (CID) (FIGURES 3A and 3B). Furthermore as the trap collision voltage was increased, the solution 5+ monomer resisted significant unfolding as evidenced by very similar ATDs (FIGURE 3B). Even at trap CEs which induce fragmentation of the 5+ MCP-1 ion (above 60 V), the ion still exhibits an arrival time of 8.75 ms (data not shown). Jarrold and coworkers similarly showed bovine pancreatic trypsin inhibitor (BPTI) also resists changes in cross section when collisionally activated, which they attributed to the protein's three disulfide bonds [55]. In our example, the disulfide bonds of MCP-1 may also help lock in the compact structure.
FIGURE 3.
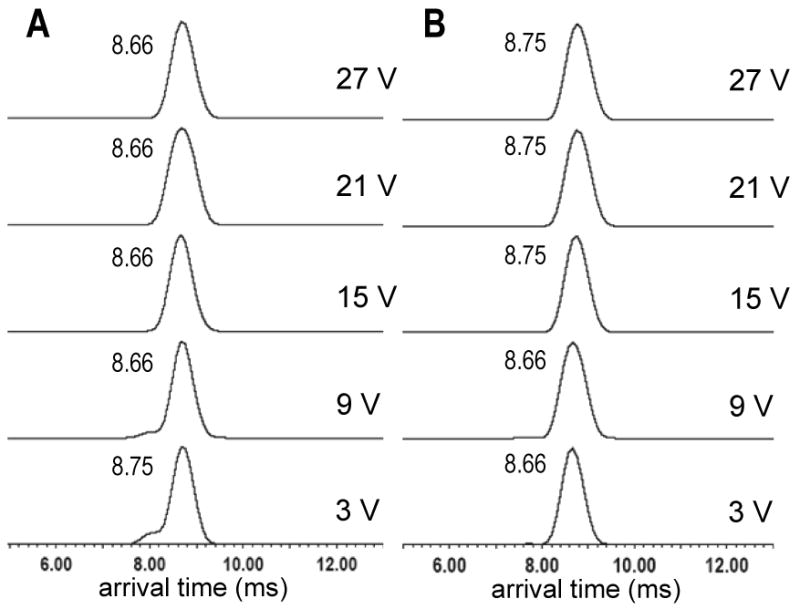
Figure 3A. The arrival time distributions for the 5+ MCP-1 monomer observed at 1733 m/z which has dissociated after isolation and activation of the 9+ MCP-1 dimer at 1926 m/z. Arrival times are reported in milliseconds next to each peak. Trap collision energies are shown at right (mass spectra are shown in figure 1A).
Figure 3B. The arrival time distributions for the 5+ MCP-1 monomer from solution. The 5+ monomer was isolated in the quadrupole region of the instrument at 1733 m/z and subjected to the trap collision energies provided at right (mass spectra shown in supplemental figure 1). Arrival times are reported in milliseconds next to each peak. Collisional activation in the trap occurs prior to the ion mobility region of the instrument in both 3A and 3B.
3.4. The MCP-1 dimer becomes less compact with collisional activation
We also monitored structural changes of the MCP-1 dimer throughout the CID process. The ATD peak for the 9+ dimer is centered at 8.03 ms under the influence of a 3V trap CE. A small tail is present towards the longer edge of the arrival time. The tail grows into a shoulder with the application of 9V trap CE, while the center of the main peak shifts to 8.12ms, indicative of the ions becoming less compact. At 15V trap CE, the main peak has shifted to 8.21ms while the shoulder has grown into an overlapping peak of 8.94ms. With the application of 21V trap CE, the bulk of the 9+ dimer ions arrive at 9.03ms, in what we consider to be a fully extended conformation, while a small shoulder remain towards the shorter edge of the arrival time likely representing partially extended structures (FIGURE 4). It is well established that collisional activation can lead to protein unfolding/expansion with consequent shifts to larger collision cross sections and longer arrival times [16, 55-57]. It is however interesting to note that we have observed a similar phenomenon here for a dimeric ion prior to its dissociation. It is also intriguing that the shift to longer arrival times correlates well with the dissociation of the dimer (refer to FIGURE 2). Taken with the observation that the CID-generated 5+ monomer remains as compact as the solution-generated 5+ monomer (FIGURES 3A and 3B), it is possible that the shift to longer arrival times of the 9+ dimer represents the displacement of one monomer relative to the other without (or prior to) a full breach of intermolecular interactions rather than extensive monomer unfolding.
FIGURE 4.

The arrival time distributions for the 9+ MCP-1 dimer which was isolated in the quadrupole region of the instrument at 1926 m/z. The dimer was subsequently activated in the trap, prior to the ion mobility region of the instrument, at the trap collision energies provided. Arrival times are reported in milliseconds next to each peak.
3.4.1. MCP-1: Arixtra complexes preferentially adopt a 2:1 stoichiometry
Arixtra is a semi-synthetic GAG-analog which is used therapeutically to prevent blood clotting. Pharmacologically Arixtra binds to anti-thrombin III, activating the protein to specifically inhibit factor Xa in the blood clotting cascade [42]. We and others have observed that many chemokines, which in vivo bind cell surface and extracellular matrix GAGs, in vitro bind the GAG-analog Arixtra [35, 40]. The interaction of chemokines, the majority of which have basic isoelectric points [30], with GAGs or Arixtra is not surprising given that the latter are highly anionic molecules. A chemical structure for the pentasaccharide Arixtra which possesses two carboxylate, three sulfamate, and five sulfate groups is provided in FIGURE 5. Given that it is available as a chemically homogeneous preparation where as other GAGs are not, Arixtra is a particularly useful research tool to study GAG-binding proteins, including chemokines.
Arixtra was added to a final concentration of 20 μM with 10 μM MCP-1 in a solution of 100 mM NH4OAc (pH 6.8). The solution was then infused into the Synapt ion mobility mass spectrometer via nESI from gold-coated borosilicate glass capillaries. As in the case for MCP-1 in isolation, oligomers of the protein were observed. However we also observed non-covalent complexes between the MCP-1 and Arixtra, predominantly adopting a 2:1 stoichiometry (Figure 6). As observed previously on other instruments with traditional ESI sources, MCP-1 preferentially binds GAGs as a dimer [35, 36, 39]. Here we also observed that the low intensity trimers and tetramers were also capable of binding to Arixtra, but at such low intensities these findings may be of limited significance. In the ion mobility heat map, other higher order oligomers appear also to be formed upon addition of Arixtra, but these species are unclearly resolved in the mass spectrum due to low signal intensity and adduct formation, and also of questionable significance (SUPPLEMENTAL FIGURE 2).
3.4.2. The MCP-1 dimer: Arixtra complex becomes less compact under the influence of collisional activation, but is more resistant to collision-induced dissociation than the Arixtra-free MCP-1 dimer
Like the Arixtra-free MCP-1 dimer, the 2:1, MCP-1: Arixtra complex was mass to charge-selected in the quadrupole region of the instrument prior to the trap and IMS stages. The 9+ charge state, at m/z 2093, was again selected for analysis. Thus the 9+ charge state for both the Arixtra-free and Arixtra-bound dimers were subjected to identical activation energies at each applied voltage. Initially we observed that the addition of Arixtra to the MCP-1 dimer causes an increase in arrival time of 270 μs (FIGURE 7A and FIGURE 4). Furthermore, upon increasing the trap CEs through the same voltages used to activate the Arixtra-free dimer, we observed that the Arixtra-bound complex also shifted to longer arrival times signifying less compact conformations (Figure 7A). The ATD for the complex peaked at 8.30 ms with the application of 3 V and migrated to 9.30 ms with the application of 27 V trap CE (FIGURE 7A). Similar shifts in arrival time to the Arixtra-free dimer were also recorded at intermediate voltages.
FIGURE 7.
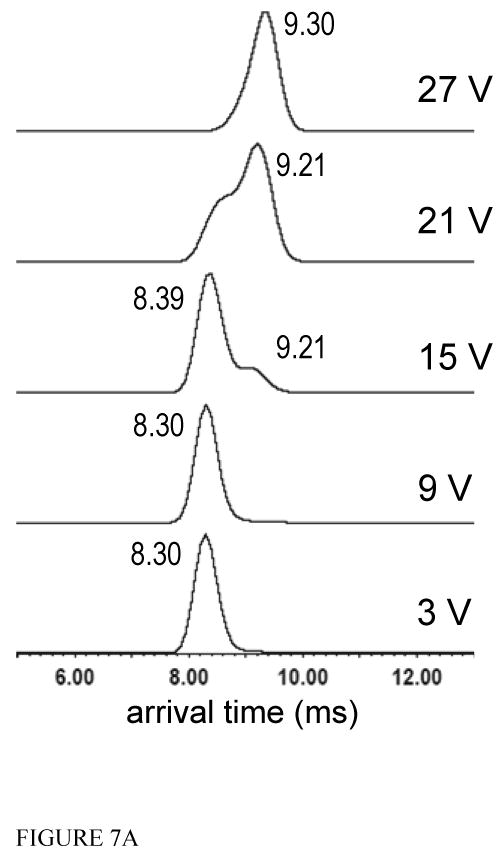

Figure 7A. The arrival time distributions for the 9+ MCP-1 dimer: Arixtra complex which was isolated in the quadrupole region of the instrument at 2093 m/z. The dimer was subsequently activated in the trap, prior to the ion mobility region of the instrument, at the trap collision energies provided. Arrival times are reported in milliseconds next to each peak.
Figure 7B. Mass spectra obtained after isolating the 9+ MCP-1: Arixtra complex at 2093 m/z in the quadrupole region of the instrument. In successive acquisitions the trap collision energy was increased to the voltages at right to activate the dimer. Monomers and dimers are denoted as m, and d, respectively. da9+ denotes the mass to charge-selected MCP-1 dimer: Arixtra complex. The 8+ charge state of the dimer: Arixtra complex, da8+, observed at higher energies arises from the stripping of a proton from the complex during the CID process. The 5+ monomer is also observed, m5+.
While the MCP-1 dimer: Arixtra complex underwent a structural expansion with collisional activation over the same CEs which dissociated the Arixtra-free dimer, the complex remained largely intact. The Arixtra-free dimer was completely dissociated with the application of 27 V trap CE, however, at the same collision energy, the Arixtra-bound dimer dissociated only slightly, with a very limited signal present from the 5+ monomer (FIGURE 7B). The Arixtra-bound MCP-1 dimer shows significant dissociation at much higher energies where non-covalent complex dissociation is concomitant with covalent bond cleavage in the bound Arixtra molecule (FIGURE 8). With the application of 57 V trap CE, dissociated 6+ and 5+ monomers are clearly observed. A 4+ monomer is also present with a non-covalently bound molecule of Arixtra exhibiting varying stages of sulfate or sulfamate loss (as SO3). On the lower end of the spectrum both 6+ and 5+ monomers can be observed bearing adducts of 80 Da, attributable to the addition of a non-covalently bound SO3 group (FIGURE 8). Water loss is also observed from the dimer plus Arixtra complex. With the application of 57 V trap CE, the complex has an arrival time of 9.39ms, only marginally greater (90μs) than that of the complex at 27 V trap CE (data not shown). Dissociation of the complex is complete with the application of 72 V trap CE (data not shown). Here we have shown that the MCP-1 dimer is significantly stabilized against CID by binding a single molecule of Arixtra, and that dissociation only proceeds appreciably at energies sufficient to cleave covalent bonds in the bound ligand. The interaction between MCP-1 and Arixtra is predicted to be at least partially ionic [33], and ionic interactions are expected to be strengthened in the gas-phase [8, 9, 58]. Therefore one might anticipate a strong interaction between Arixtra and one MCP-1 monomer. However, Arixtra preferentially binds MCP-1 dimers (see above and ref. [35]), and also prevents their dissociation at comparable activation energies which dissociate Arixtra-free dimers. Given that dissociation of the Arixtra-bound-dimer only becomes significant at energies which fragment Arixtra itself, may suggest that Arixtra interacts with both monomers composing the dimer, thereby strengthening the gas-phase interaction. This would also be consistent with the preference of Arixtra to bind MCP-1 dimers rather than monomers [35].
4. Conclusions
We have chronicled the dissociation behavior of the gas-phase MCP-1 dimer. The dimer, in the absence of Arixtra, dissociates at relatively low activation energies. Dissociation of the dimer proceeds with each monomer retaining similar degrees of tertiary structure as evidenced by symmetric mass to charge partitioning. The dissociated 5+ monomer is similarly compact to the 5+ monomer arising from solution, also suggesting a compact structure. Likewise, the solution monomer resists structural expansion under the influence of collisional activation, a property facilitated by intramolecular disulfide bonding. The conformation of the 9+ dimer becomes less compact with the application of increasing trap collision energy as observed by a shift to longer arrival times. The extended arrival times of the activated 9+ dimer may reflect a partial breach of non-covalent interactions between similarly compact monomers prior to a complete dissociation event. The association of the GAG-analog Arixtra with the MCP-1 dimer stabilizes the gas-phase complex against dissociation, but does not prevent the shift to longer drift times indicating a structural expansion in the absence of dissociation. At relatively high collision energies dissociation of the 9+ MCP-1 dimer: Arixtra complex becomes significant along with covalent bond cleavage, particularly SO3 loss from the Arixtra molecule. The observation that Arixtra appears to stabilize the gas-phase dimer against dissociation suggests that Arixtra interacts with both MCP-1 monomers comprising the intact dimer.
Supplementary Material

MCP-1 dimer and monomer, normally overlapping in mass spectrum, are separated by ion mobility
Acknowledgments
We acknowledge Tracy M. Handel, UCSD, for the original gift of the chemokine expression construct and the NIH-GM47356, which supports this research.
Abbreviations
- MCP-1
monocyte chemoattractant protein-1
- GAG
glycosaminoglycan
- MS
mass spectrometry
- IMS
ion mobility spectrometry
- CE
collision energy
- ESI
electrospray ionization
- MALDI
matrix-assisted laser desorption ionization
- TWIMS
traveling wave ion mobility spectrometer (or spectrometry)
- FAIMS
field asymmetric waveform ion mobility spectrometer
- q-TWIMS-TOF MS
quadrupole-traveling wave ion mobility spectrometer (or spectrometry)-time of flight mass spectrometer (or spectrometry)
- Met-
denotes a removed N-terminal methionine
- M64I
denotes a mutation of residue 64 from methionine to isoleucine
- FPLC
fast protein liquid chromatography
- RP-HPLC
reverse-phase high performance liquid chromatography
- RF
radio frequency
- TOF
time of flight
- nESI
nanoelectrospray ionization
- CID
collision induced dissociation
- NH4OAc
ammonium acetate
Footnotes
Publisher's Disclaimer: This is a PDF file of an unedited manuscript that has been accepted for publication. As a service to our customers we are providing this early version of the manuscript. The manuscript will undergo copyediting, typesetting, and review of the resulting proof before it is published in its final citable form. Please note that during the production process errors may be discovered which could affect the content, and all legal disclaimers that apply to the journal pertain.
References
- 1.Fenn JB, et al. Electrospray Ionization for Mass Spectrometry of Large Biomolecules. Science. 1989;246(4926):64–71. doi: 10.1126/science.2675315. [DOI] [PubMed] [Google Scholar]
- 2.Whitehouse CM, et al. Electrospray interface for liquid chromatographs and mass spectrometers. Analytical Chemistry. 1985;57(3):675–679. doi: 10.1021/ac00280a023. [DOI] [PubMed] [Google Scholar]
- 3.Yamashita M, Fenn JB. Electrospray ion source. Another variation on the free-jet theme. Journal of Physical Chemistry. 1984;88(20):4451–4459. [Google Scholar]
- 4.Yamashita M, Fenn JB. Negative ion production with the electrospray ion source. Journal of Physical Chemistry. 1984;88(20):4671–4675. [Google Scholar]
- 5.Ganem B, Li YT, Henion JD. Detection of noncovalent receptor-ligand complexes by mass spectrometry. Journal of the American Chemical Society. 1991;113(16):6294–6296. [Google Scholar]
- 6.Katta V, Chait BT. Observation of the heme-globin complex in native myoglobin by electrospray-ionization mass spectrometry. Journal of the American Chemical Society. 1991;113(22):8534–8535. [Google Scholar]
- 7.Smith RD, Light-Wahl KJ. The observation of non-covalent interactions in solution by electrospray ionization mass spectrometry: Promise, pitfalls and prognosis. Biological Mass Spectrometry. 1993;22(9):493–501. [Google Scholar]
- 8.Loo JA. Studying noncovalent protein complexes by electrospray ionization mass spectrometry. Mass Spectrometry Reviews. 1997;16(1):1–23. doi: 10.1002/(SICI)1098-2787(1997)16:1<1::AID-MAS1>3.0.CO;2-L. [DOI] [PubMed] [Google Scholar]
- 9.Smith RD, et al. New mass spectrometric methods for the study of noncovalent associations of biopolymers. Chemical Society Reviews. 1997;26(3):191–202. [Google Scholar]
- 10.Sobott F, Robinson CV. Protein complexes gain momentum. Current Opinion in Structural Biology. 2002;12(6):729–734. doi: 10.1016/s0959-440x(02)00400-1. [DOI] [PubMed] [Google Scholar]
- 11.Heck AJR, van den Heuvel RHH. Investigation of intact protein complexes by mass spectrometry. Mass Spectrometry Reviews. 2004;23(5):368–389. doi: 10.1002/mas.10081. [DOI] [PubMed] [Google Scholar]
- 12.Damoc E, et al. Structural Characterization of the Human Eukaryotic Initiation Factor 3 Protein Complex by Mass Spectrometry. 2007:1135–1146. doi: 10.1074/mcp.M600399-MCP200. [DOI] [PubMed] [Google Scholar]
- 13.Hernandez H, et al. Subunit architecture of multimeric complexes isolated directly from cells. Embo Reports. 2006;7(6):605–610. doi: 10.1038/sj.embor.7400702. [DOI] [PMC free article] [PubMed] [Google Scholar]
- 14.Zhou M, et al. Mass spectrometry reveals modularity and a complete subunit interaction map of the eukaryotic translation factor eIF3. Proceedings of the National Academy of Sciences. 2008 doi: 10.1073/pnas.0801313105. [DOI] [PMC free article] [PubMed] [Google Scholar]
- 15.Aquilina JA, et al. Polydispersity of a mammalian chaperone: Mass spectrometry reveals the population of oligomers in alpha B-crystallin. Proceedings of the National Academy of Sciences of the United States of America. 2003;100(19):10611–10616. doi: 10.1073/pnas.1932958100. [DOI] [PMC free article] [PubMed] [Google Scholar]
- 16.Clemmer DE, Jarrold MF. Ion mobility measurements and their applications to clusters and biomolecules. Journal of Mass Spectrometry. 1997;32(6):577–592. [Google Scholar]
- 17.Hoaglund-Hyzer CS, Counterman AE, Clemmer DE. Anhydrous protein ions. Chemical Reviews. 1999;99(10):3037–3079. doi: 10.1021/cr980139g. [DOI] [PubMed] [Google Scholar]
- 18.Jarrold MF. Peptides and proteins in the vapor phase. Annual Review of Physical Chemistry. 2000;51:179–207. doi: 10.1146/annurev.physchem.51.1.179. [DOI] [PubMed] [Google Scholar]
- 19.Verbeck GF, et al. A fundamental introduction to ion mobility mass spectrometry applied to the analysis of biomolecules. Journal of Biomolecular Techniques. 2002;13(2):56–61. [PMC free article] [PubMed] [Google Scholar]
- 20.Wyttenbach T, Bowers MT. Gas-phase conformations: The ion mobility/ion chromatography method. Modern Mass Spectrometry. 2003:207–232. [Google Scholar]
- 21.Kanu AB, et al. Ion mobility-mass spectrometry. Journal of Mass Spectrometry. 2008;43(1):1–22. doi: 10.1002/jms.1383. [DOI] [PubMed] [Google Scholar]
- 22.Bohrer BC, et al. Biomolecule Analysis by Ion Mobility Spectrometry. Annual Review of Analytical Chemistry. 2008;1(1):293–327. doi: 10.1146/annurev.anchem.1.031207.113001. [DOI] [PMC free article] [PubMed] [Google Scholar]
- 23.Giles K, et al. Applications of a travelling wave-based radio-frequencyonly stacked ring ion guide. Rapid Communications in Mass Spectrometry. 2004;18(20):2401–2414. doi: 10.1002/rcm.1641. [DOI] [PubMed] [Google Scholar]
- 24.Pringle SD, et al. An investigation of the mobility separation of some peptide and protein ions using a new hybrid quadrupole/travelling wave IMS/oa-ToF instrument. International Journal of Mass Spectrometry. 2007;261(1):1–12. [Google Scholar]
- 25.Ruotolo BT, et al. Evidence for macromolecular protein rings in the absence of bulk water. Science. 2005;310(5754):1658–1661. doi: 10.1126/science.1120177. [DOI] [PubMed] [Google Scholar]
- 26.Kapron JT, et al. Removal of metabolite interference during liquid chromatography/tandem mass spectrometry using high-field asymmetric waveform ion mobility spectrometry. Rapid Communications in Mass Spectrometry. 2005;19(14):1979–1983. [Google Scholar]
- 27.Kapron JT, et al. Simultaneous analysis of prostanoids using liquid chromatography/high-field asymmetric waveform ion mobility spectrometry/tandem mass spectrometry. Rapid Communications in Mass Spectrometry. 2006;20(10):1504–1510. doi: 10.1002/rcm.2505. [DOI] [PubMed] [Google Scholar]
- 28.Leonard EJ, Yoshimura T. Human monocyte chemoattractant protein-1 (MCP-1) Immunology Today. 1990;11:97–101. doi: 10.1016/0167-5699(90)90035-8. [DOI] [PubMed] [Google Scholar]
- 29.Baggiolini M, Dewald B, Moser B. Human chemokines: an update. Annu Rev Immunol. 1997;15:675–705. doi: 10.1146/annurev.immunol.15.1.675. [DOI] [PubMed] [Google Scholar]
- 30.Lau EK, et al. Chemokine-receptor interactions: GPCRs, glycosaminoglycans and viral chemokine binding proteins. Adv Protein Chem. 2004;68:351–91. doi: 10.1016/S0065-3233(04)68010-7. [DOI] [PubMed] [Google Scholar]
- 31.Moser B, et al. Chemokines: multiple levels of leukocyte migration control. Trends Immunol. 2004;25(2):75–84. doi: 10.1016/j.it.2003.12.005. [DOI] [PubMed] [Google Scholar]
- 32.Rot A, von Andrian UH. Chemokines in innate and adaptive host defense: basic chemokinese grammar for immune cells. Annu Rev Immunol. 2004;22:891–928. doi: 10.1146/annurev.immunol.22.012703.104543. [DOI] [PubMed] [Google Scholar]
- 33.Lau EK, et al. Identification of the glycosaminoglycan binding site of the CC chemokine, MCP-1 - Implications for structure and function in vivo. Journal Of Biological Chemistry. 2004;279(21):22294–22305. doi: 10.1074/jbc.M311224200. [DOI] [PubMed] [Google Scholar]
- 34.Lubkowski J, et al. The structure of MCP-1 in two crystal forms provides a rare example of variable quaternary interactions. Nat Struct Biol. 1997;4(1):64–9. doi: 10.1038/nsb0197-64. [DOI] [PubMed] [Google Scholar]
- 35.Crown SE, et al. Heterodimerization of CCR2 chemokines and regulation by glycosaminoglycan binding. J Biol Chem. 2006;281(35):25438–46. doi: 10.1074/jbc.M601518200. [DOI] [PubMed] [Google Scholar]
- 36.Yu Y, et al. Chemokine-glycosaminoglycan binding: specificity for CCR2 ligand binding to highly sulfated oligosaccharides using FTICR mass spectrometry. J Biol Chem. 2005;280(37):32200–8. doi: 10.1074/jbc.M505738200. [DOI] [PubMed] [Google Scholar]
- 37.Hoogewerf AJ, et al. Glycosaminoglycans mediate cell surface oligomerization of chemokines. Biochemistry. 1997;36(44):13570–8. doi: 10.1021/bi971125s. [DOI] [PubMed] [Google Scholar]
- 38.Proudfoot AE, et al. Glycosaminoglycan binding and oligomerization are essential for the in vivo activity of certain chemokines. Proc Natl Acad Sci U S A. 2003;100(4):1885–90. doi: 10.1073/pnas.0334864100. [DOI] [PMC free article] [PubMed] [Google Scholar]
- 39.Schenauer MR, et al. CCR2 Chemokines Bind Selectively to Acetylated Heparan Sulfate Octasaccharides. Journal of Biological Chemistry. 2007;282(35):25182–25188. doi: 10.1074/jbc.M703387200. [DOI] [PubMed] [Google Scholar]
- 40.Yu Y, et al. Potential Inhibitors of Chemokine Function: Analysis of Noncovalent Complexes of CC Chemokine and Small Polyanionic Molecules by ESI FT-ICR Mass Spectrometry. J Am Soc Mass Spectrom. 2006;17(4):524–35. doi: 10.1016/j.jasms.2005.12.008. [DOI] [PubMed] [Google Scholar]
- 41.Paavola CD, et al. Monomeric monocyte chemoattractant protein-1 (MCP-1) binds and activates the MCP-1 receptor CCR2B. Journal Of Biological Chemistry. 1998;273(50):33157–33165. doi: 10.1074/jbc.273.50.33157. [DOI] [PubMed] [Google Scholar]
- 42.GlaxoSmithKline. Arixtra Prescribing Information. 2008 [cited 2009; Available from: us.gsk.com/products/assets/us_arixtra.pdf.
- 43.Chernushevich IV, Thomson BA. Collisional cooling of large ions in electrospray mass spectrometry. Analytical Chemistry. 2004;76(6):1754–1760. doi: 10.1021/ac035406j. [DOI] [PubMed] [Google Scholar]
- 44.Sobott F, et al. A tandem mass spectrometer for improved transmission and analysis of large macromolecular assemblies. Analytical Chemistry. 2002;74(6):1402–1407. doi: 10.1021/ac0110552. [DOI] [PubMed] [Google Scholar]
- 45.Tahallah N, et al. The effect of the source pressure on the abundance of ions of noncovalent protein assemblies in an electrospray ionization orthogonal time-of-flight instrument. Rapid Commun Mass Spectrom. 2001;15(8):596–601. doi: 10.1002/rcm.275. [DOI] [PubMed] [Google Scholar]
- 46.Wilm M, Mann M. Analytical Properties of the Nanoelectrospray Ion Source. Analytical Chemistry. 1996;68(1):1–8. doi: 10.1021/ac9509519. [DOI] [PubMed] [Google Scholar]
- 47.Wilm MS, Mann M. Electrospray and Taylor-Cone theory, Dole's beam of macromolecules at last? International Journal of Mass Spectrometry and Ion Processes. 1994;136(23):167–180. [Google Scholar]
- 48.Benesch JLP, et al. Protein complexes in the gas phase: Technology for structural genomics and proteomics. Chemical Reviews. 2007;107(8):3544–3567. doi: 10.1021/cr068289b. [DOI] [PubMed] [Google Scholar]
- 49.Fitzgerald MC, et al. Probing the oligomeric structure of an enzyme by electrospray ionization time-of-flight mass spectrometry. Proceedings of the National Academy of Sciences of the United States of America. 1996;93(14):6851–6856. doi: 10.1073/pnas.93.14.6851. [DOI] [PMC free article] [PubMed] [Google Scholar]
- 50.Bernstein SL, et al. Amyloid(beta)-Protein: Monomer Structure and Early Aggregation States of A(beta)42 and Its Pro19 Alloform. Journal of the American Chemical Society. 2005;127(7):2075–2084. doi: 10.1021/ja044531p. [DOI] [PubMed] [Google Scholar]
- 51.Wyttenbach T, Kemper PR, Bowers MT. Design of a new electrospray ion mobility mass spectrometer. International Journal of Mass Spectrometry. 2001;212(13):13–23. [Google Scholar]
- 52.Benesch JLP, et al. Tandem mass spectrometry reveals the quaternary organization of macromolecular assemblies. Chemistry & Biology. 2006;13(6):597–605. doi: 10.1016/j.chembiol.2006.04.006. [DOI] [PubMed] [Google Scholar]
- 53.Jurchen JC, Garcia DE, Williams ER. Further studies on the origins of asymmetric charge partitioning in protein homodimers. Journal of the American Society for Mass Spectrometry. 2004;15(10):1408–1415. doi: 10.1016/j.jasms.2004.06.006. [DOI] [PMC free article] [PubMed] [Google Scholar]
- 54.Jurchen JC, Williams ER. Origin of asymmetric charge partitioning in the dissociation of gas-phase protein homodimers. Journal of the American Chemical Society. 2003;125(9):2817–2826. doi: 10.1021/ja0211508. [DOI] [PMC free article] [PubMed] [Google Scholar]
- 55.Shelimov KB, et al. Protein structure in vacuo: Gas-phase confirmations of BPTI and cytochrome c. Journal of the American Chemical Society. 1997;119(9):2240–2248. [Google Scholar]
- 56.Koeniger SL, et al. Transfer of structural elements from compact to extended states in unsolvated ubiquitin. Journal of the American Chemical Society. 2006;128(35):11713–11719. doi: 10.1021/ja062137g. [DOI] [PMC free article] [PubMed] [Google Scholar]
- 57.Valentine SJ, et al. Disulfide-intact and -reduced lysozyme in the gas phase: Conformations and pathways of folding and unfolding. Journal of Physical Chemistry B. 1997;101(19):3891–3900. [Google Scholar]
- 58.Robinson CV, et al. Probing the Nature of Noncovalent Interactions by Mass Spectrometry. A Study of Protein-CoA Ligand Binding and Assembly. Journal of the American Chemical Society. 1996;118(36):8646–8653. [Google Scholar]
Associated Data
This section collects any data citations, data availability statements, or supplementary materials included in this article.