Abstract
The enhanced oxidative stress associated with type 2 diabetes mellitus contributes to disease pathogenesis. We previously identified plasma membrane–associated ATP-sensitive K+ (KATP) channels of pancreatic β cells as targets for oxidants. Here, we examined the effects of genetic and pharmacologic ablation of KATP channels on loss of mouse β cell function and viability following oxidative stress. Using mice lacking the sulfonylurea receptor type 1 (Sur1) subunit of KATP channels, we found that, compared with insulin secretion by WT islets, insulin secretion by Sur1–/– islets was less susceptible to oxidative stress induced by the oxidant H2O2. This was likely, at least in part, a result of the reduced ability of H2O2 to hyperpolarize plasma membrane potential and reduce cytosolic free Ca2+ concentration ([Ca2+]c) in the Sur1–/– β cells. Remarkably, Sur1–/– β cells were less prone to apoptosis induced by H2O2 or an NO donor than WT β cells, despite an enhanced basal rate of apoptosis. This protective effect was attributed to upregulation of the antioxidant enzymes SOD, glutathione peroxidase, and catalase. Upregulation of antioxidant enzymes and reduced sensitivity of Sur1–/– cells to H2O2-induced apoptosis were mimicked by treatment with the sulfonylureas tolbutamide and gliclazide. Enzyme upregulation and protection against oxidant-induced apoptosis were abrogated by agents lowering [Ca2+]c. Sur1–/– mice were less susceptible than WT mice to streptozotocin-induced β cell destruction and subsequent hyperglycemia and death, which suggests that loss of KATP channel activity may protect against streptozotocin-induced diabetes in vivo.
Introduction
The incidence of type 2 diabetes mellitus is growing worldwide and poses a serious public health problem. In addition to the increase in blood glucose concentration, lipid metabolism is altered in type 2 diabetes, and both parameters, termed glucolipotoxicity, are factors in the development of the disease (1). In addition to its other deleterious effects, glucolipotoxicity produces oxidative stress (1–3), an important factor in the development of type 2 diabetes (1, 2, 4, 5).
The expression and activity of antioxidant enzymes is low in rodent β cells compared with cells from other organs (6–8), which increases their susceptibility to an oxidative insult. Overexpression of antioxidant enzymes protects insulin-secreting RINm5F cells against the effects of NO and oxygen radicals (9). SOD and catalase (Cat) can prevent in vitro alloxan-induced β cell damage (10). In vivo experiments show that transgenic mice with β cell–specific overexpression of Cu/Zn SOD are more resistant to alloxan-induced diabetes (11). Studies with rodents demonstrate that SOD administration can attenuate streptozotocin-induced (STZ-induced) hyperglycemia and diabetes (12–14). It was previously reported that antioxidant treatment exerts beneficial effects on β cell mass and insulin content in diabetic C57BL/KsJ-db/db mice (15). Human β cells seem to be less prone to oxidative stress than are rodent β cells (16), possibly because they have greater Cat and SOD activity (17). On the other hand, it has been reported that glutathione peroxidase (GPx) activity is poorly detectable in human islets (18) and that overexpression of Cu/Zn SOD reduces the susceptibility of human islets to NO toxicity (19).
Type 2 diabetes is associated with low-grade chronic inflammation, which is accompanied by an increase in islet-associated immune cells that produce oxidants (20). Prediabetic and newly diagnosed type 2 diabetic patients have increased oxidative stress and decreased antioxidant defense systems (21, 22). Thus, upregulation of antioxidant mechanisms may provide a strategy to protect human β cells from an oxidant insult.
ROS and reactive nitrogen species (RNS) that generate oxidative stress influence β cell function by interfering with multiple targets that result in β cell dysfunction and/or reduction of β cell mass via apoptotic cell death. Several prior studies, including our own, have shown that ROS/RNS can modulate β cell ATP-sensitive K+ (KATP) channel activity by inhibiting mitochondrial ATP production (23–27). Both H2O2, used as a model ROS compound, and the diabetogenic agent alloxan, believed to generate H2O2, can open KATP channels and hyperpolarize the plasma membrane potential (Vm) of β cells. Oxidative insult potentiates the amount of ROS by stimulating mitochondrial ROS production (ROS-induced ROS release; refs. 28, 29), and ROS are able to trigger the opening of the mitochondrial permeability transition pore (28, 29) to an extent that collapses the mitochondrial membrane potential and leads to ATP depletion.
The effects of NO on KATP channel activity are complex. Stimulation and inhibition of channel activity have been reported depending on the concentration of NO. Indirect effects of NO on KATP channels have been ascribed to interference with mitochondrial metabolism and the cGMP/protein kinase G pathway, while high concentrations of NO can inhibit KATP channels directly (30–34).
Mitochondria are involved in apoptotic cell death evoked by oxidative stress. ROS can trigger release of cytochrome c and other proapoptotic proteins, an important step in the induction of the mitochondrial apoptotic pathway that results in caspase activation (35). ROS-induced mitochondrial Ca2+ overload may also contribute to the deleterious effects of oxidative stress on cell viability (36, 37).
Using WT mice and mice lacking the sulfonylurea receptor type 1 (Sur1) subunit of KATP channels (Sur1–/– mice), we exposed WT β cells treated with tolbutamide or gliclazide or Sur1–/– β cells to H2O2 and NO and evaluated parameters of stimulus-secretion coupling and apoptosis. The β cells lacking functional KATP channels as a result of genetic ablation or treatment with tolbutamide had an elevated basal rate of apoptosis, but were protected against further deterioration of function and loss of cell mass induced by moderate oxidative stress. Gliclazide protected β cells against H2O2-induced cell death without increasing basal apoptosis. Ca2+-dependent upregulation of antioxidant enzymes appears to be one mechanism that contributed to this protection. In vivo experiments showed that KATP channel ablation defended against STZ-induced β cell damage, increased plasma glucose concentration, and death.
Results
Influence of H2O2 on insulin secretion from WT versus Sur1–/– islets.
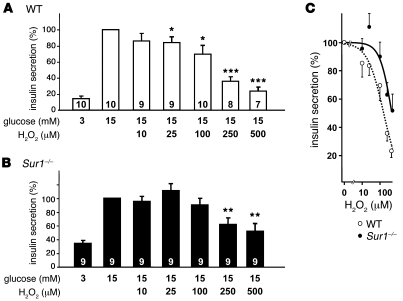
First, we compared insulin secretion from WT and Sur1–/– islets (Figure 1, A and B). Consistent with the lack of KATP channels, basal secretion in 3 mM glucose was higher in Sur1–/– islets than in WT islets (Sur1–/–, 0.17 ± 0.02 ng/[h•islet], 34% ± 4% that of 15 mM glucose, n = 9; WT, 0.08 ± 0.02 ng/[h•islet], 14% ± 2% that of 15 mM glucose, n = 10; P ≤ 0.01). However, insulin secretion induced by 15 mM glucose was not different between the 2 genotypes and amounted to 0.49 ± 0.03 ng/[h•islet] in Sur1–/– islets and 0.54 ± 0.06 ng/[h•islet] in WT islets. Furthermore, insulin content in WT and Sur1–/– islets did not differ in 3 or 15 mM glucose (WT, 23 ± 2 ng/islet in 3 mM glucose, 24 ± 2 ng/islet in 15 mM glucose, n = 10; Sur1–/–, 20 ± 1 ng/islet in 3 mM glucose, 21 ± 1 ng/islet in 15 mM glucose, n = 9). Application of increasing concentrations of H2O2 in the presence of 15 mM glucose reduced the rate of insulin release in both genotypes, but was more effective in WT islets. This difference was reflected by concentration-response curves (Figure 1C). Insulin secretion was half-maximally inhibited at 160 ± 20 μM H2O2 in WT islets, whereas the IC50 shifted to 460 ± 100 μM in islets from Sur1–/– mice. The decrease in hormone secretion was not caused by changes in insulin content (WT, 25 ± 2 and 24 ± 1 ng/islet; Sur1–/–, 23 ± 2 and 20 ± 2 ng/islet; after 1 hour incubation with 25 and 100 μM H2O2, respectively; n = 9–10). These data show that islets from Sur1–/– mice are less sensitive to oxidative stress than are WT islets.
Figure 1. Influence of H2O2 on insulin secretion from WT and Sur1–/– islets.
Comparison of glucose-activated insulin secretion in the presence of various concentrations of H2O2 in WT (A) and Sur1–/– (B) islets. Glucose-stimulated insulin secretion (15 mM glucose) was taken as 100%; basal glucose concentration at 3 mM of the sugar was appropriately lower. n is given within each bar. (C) Concentration-response curves derived from data in A and B. *P ≤ 0.05, **P ≤ 0.01, ***P ≤ 0.001 versus control in 15 mM glucose alone.
Effect of H2O2 on Vm.
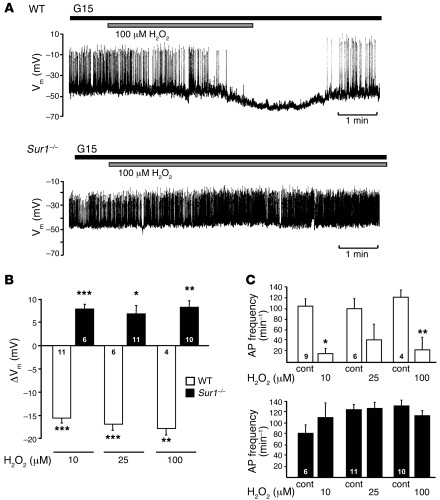
H2O2 lowers cellular ATP content (25, 38). The reduction of cellular energy status will influence stimulus-secretion coupling via modulation of KATP channel activity. Thus, the lack of KATP channels could account for the differential sensitivity of insulin release from WT and Sur1–/– islets in response to H2O2. To evaluate this point, we compared Vm in Sur1–/– and WT β cells in the presence of 10, 25, and 100 μM H2O2. The addition of 100 μM H2O2 to a WT β cell hyperpolarized Vm and stopped action potential (AP) firing (Figure 2A). The same concentration of H2O2 slightly depolarized a Sur1–/– β cell (Figure 2A). Similar differences were obtained with 10 and 25 μM H2O2 (Figure 2, B and C). All 3 concentrations of H2O2 markedly hyperpolarized Vm in WT cells, but depolarized Sur1–/– β cells (Figure 2B). The plateau potential from which APs started under 15 mM glucose control conditions amounted to –45 ± 1 mV in WT β cells (n = 21) and –45 ± 1 mV in Sur1–/– β cells (n = 27). APs were suppressed completely by 10 μM H2O2 in 6 of 9 WT cells; in the other 3 cells, the frequency was reduced. With 25 μM H2O2, electrical activity ceased in 3 tested WT cells; in 2 other β cells, it clearly decreased. In 1 cell, 25 μM H2O2 was ineffective. In 3 of 4 experiments with 100 μM H2O2, electrical activity stopped; in the remaining experiment, AP frequency was reduced (Figure 2C). Conversely, the AP frequency was not significantly altered in Sur1–/– β cells (Figure 2C). In accordance with glucose-induced insulin secretion from WT islets, the effect of H2O2 on KATP channel activity was prominent, even at low H2O2 concentrations.
Figure 2. Effect of H2O2 on electrical activity in Sur1–/– and WT β cells.
(A) Registration of Vm in the presence of 15 mM glucose (G15). Time of addition of 100 μM H2O2 is denoted by horizontal bars. Results show 1 representative of 4 experiments with WT β cells and 10 with Sur1–/– β cells. (B) Quantification of changes in Vm evoked by addition of 10, 25, and 100 μM H2O2 in WT and Sur1–/– β cells. (C) Changes in AP frequency evoked by addition of 10, 25, and 100 μM H2O2 in WT and Sur1–/– β cells. APs completely disappeared in WT β cells in 6 of 9 experiments with 10 μM H2O2, 3 of 6 with 25 μM H2O2, and 3 of 4 with 100 μM H2O2. n is given within each bar. *P ≤ 0.05, **P ≤ 0.01, ***P ≤ 0.001 versus respective control.
Effect of H2O2 on cytosolic free Ca2+ concentration.
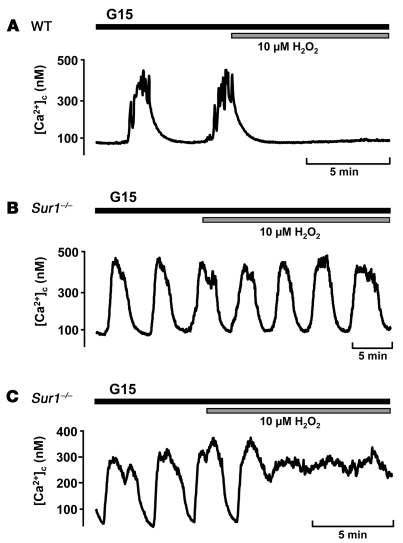
We investigated whether the differential Vm response of Sur1–/– compared with WT β cells to H2O2 produced changes in the cytosolic free Ca2+ concentration ([Ca2+]c). In 15 mM glucose, [Ca2+]c oscillated in both WT and knockout β cells. Addition of 10 μM H2O2 to WT β cells abolished oscillations and reduced [Ca2+]c to basal values in 12 of 19 cells (Figure 3A). In 7 cells, the oscillations persisted in the presence of H2O2. In contrast, 10 μM H2O2 never reduced [Ca2+]c to basal values in Sur1–/– β cells: in 9 of 19 cells, [Ca2+]c oscillations persisted in the presence of H2O2 (Figure 3B); in the remaining 10 cells, [Ca2+]c increased to a plateau above basal values (Figure 3C). The changes in [Ca2+]c are consistent with the action of H2O2 on Vm.
Figure 3. Effect of H2O2 on [Ca2+]c in Sur1–/– and WT β cells.
Time of addition of 10 μM H2O2 is denoted by horizontal bars. (A) WT β cells. Shown is 1 of 12 experiments with similar results in which oscillations stopped; in 7 experiments (not shown), oscillations persisted in the presence of H2O2. (B and C) Sur1–/– β cells. Shown are 2 representative experiments of 19: (B) 1 experiment with oscillations in the presence of H2O2, and (C) 1 experiment in which a plateau above basal values was reached.
Influence of H2O2 on apoptotic cell death.
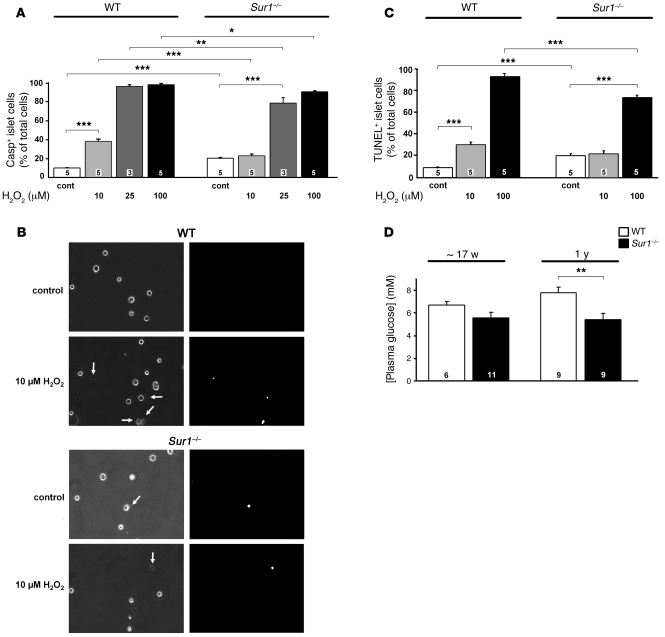
Because oxidative stress can reduce cell mass, we assessed the rates of apoptosis in WT and Sur1–/– islet cells exposed to H2O2. Islet cells were treated for 6 hours with 10, 25, or 100 μM H2O2, and the percentage of caspase3-positve cells was determined (Figure 4A). The rate of apoptosis in WT cells under control conditions (i.e., RPMI medium, 11.1 mM glucose) was 9.8% ± 0.4% and increased significantly with rising H2O2 concentrations to 37.0% ± 2.4% (10 μM), 95.3% ± 1.4% (25 μM), and 96.4% ± 1.1% (100 μM). Sur1–/– cells had a 2-fold higher basal apoptosis rate of 19.9% ± 1.1%. The addition of 10 μM H2O2 to Sur1–/– cells had no additional effect, whereas higher concentrations increased the percentage of caspase3-positive cells to 77.9% ± 3.9% (25 μM) and 89.5% ± 2.0% (100 μM). The values for Sur1–/– cells were significantly lower than those determined for WT cells at the same H2O2 concentration (Figure 4A). Because insulin secretion measurements were carried out in 15 mM glucose, we examined the rate of basal apoptosis at this glucose concentration to ensure that it does not differ from 11.1 mM glucose. In WT islet cells, apoptosis amounted to 9.8% ± 1.7%, compared with 16.9% ± 1.1% in Sur1–/– cells (n = 4 independent preparations for each genotype; P ≤ 0.01). For clusters of islet cells, which are better comparable to intact islets than are single cells, similar differences in basal apoptosis were observed between the 2 genotypes (data not shown).
Figure 4. Effect of H2O2 on apoptosis in Sur1–/– and WT cells.
(A and C) Rate of apoptosis estimated by caspase3-positive (A) or TUNEL-positive (C) cells. (B) Examples of caspase3-positive WT and Sur1–/– islet cells without and with treatment with 10 μM H2O2 (left, transmitted light images; right, fluorescence images). Arrows denote dead cells. Original magnification, ×300. In A–C, cells were treated with the indicated concentrations of H2O2 for 6 hours, and control cells were cultured with 11.1 mM glucose. (D) Plasma glucose concentrations of fasted Sur1–/– and WT mice at between 15 and 19 weeks and at 1 year of age. n is given within each bar. *P ≤ 0.05; **P ≤ 0.01; ***P ≤ 0.001.
Figure 4B shows examples of caspase3-positive WT and Sur1–/– islet cells with and without treatment with 10 μM H2O2. Estimates of the rates of apoptosis by TUNEL assay gave a similar result (Figure 4C). The results imply that although the basal rate of apoptosis is elevated, the loss of KATP channels confers protection against additional exogenously applied oxidative stress.
Because we observed that the SUR1 knockout coincided with elevated basal apoptosis, we sought to confirm that this does not impair glycemic control per se. Fasted plasma glucose concentrations were equal in both genotypes at an age between 15 and 19 weeks (i.e., approximately 17 weeks; Figure 4D). At 1 year, a significant difference was observed; however, this was caused by impairment of the glucose status in WT animals and not by a change of plasma glucose concentration in Sur1–/– animals.
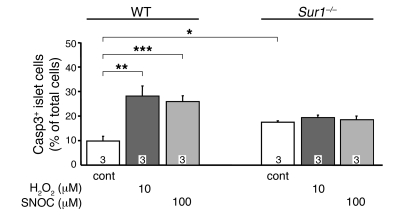
We tested the effect of a shorter incubation with H2O2 and sought to determine whether the effect is unique for H2O2. Incubation for 1 hour with H2O2, corresponding to the time used to assess insulin secretion, induced less cell damage than the 6-hour incubation (Figure 5). Control apoptosis was 9.9% ± 2.0% in WT cells compared with 17.5% ± 0.5% in Sur1–/– cells. Although 10 μM H2O2 markedly increased apoptosis in WT islet cells to 28.2% ± 4.1%, the same treatment was without effect in Sur1–/– islet cells. At 25 μM, H2O2 augmented apoptosis in Sur1–/– islet cells (24.9% ± 1.0%); however, this effect was less pronounced than in WT islet cells (38.8% ± 6.8%; P ≤ 0.01; data not shown). The NO donor S-nitrosocysteine (100 μM) had an effect comparable to that of 10 μM H2O2, increasing the rate of apoptotic cells above control values in WT cells, but not in Sur1–/– cells (Figure 5). These results demonstrated that the effect of H2O2 on cell viability was quite rapid, comparable to its action on cell function. Moreover, the effect was not restricted to H2O2, but was also observed with NO.
Figure 5. Effect of 1 hour incubation with H2O2 or an NO donor on apoptosis in Sur1–/– and WT cells.
Caspase3-positive cells were determined after 1 hour treatment of WT and Sur1–/– cells with 10 μM H2O2 or 100 μM of the NO donor S-nitrosocysteine (SNOC). Control cells were cultured with 11.1 mM glucose. n is given within each bar. *P ≤ 0.05; **P ≤ 0.01; ***P ≤ 0.001.
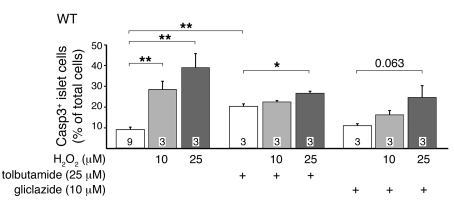
To test whether pharmacologic modulation of KATP channels affected the action of H2O2, islet cells were preincubated with 25 μM tolbutamide or 10 μM gliclazide for 4 hours followed by H2O2 for 1 hour (Figure 6). Without tolbutamide or gliclazide, H2O2 dose-dependently increased the percentage of caspase3-positive WT cells, similar to the results in Figure 4A. Tolbutamide increased the basal rate of apoptosis of WT islet cells from 8.9% ± 1.2% to 20.0% ± 1.3%. The addition of 10 μM H2O2 had no significant effect, while 25 μM slightly increased the apoptotic rate to 26.3% ± 1.0% (Figure 6). Gliclazide had no effect on basal apoptosis (10.9% ± 0.6%). H2O2 did not provoke a significant increase in the rate of apoptosis in the presence of gliclazide: 15.9% ± 1.3% with 10 μM and 24.6% ± 4.0% with 25 μM H2O2 (Figure 6). The data are consistent with the idea that reduced KATP channel activity induces a compensatory mechanism that confers partial protection against oxidative stress.
Figure 6. Effect of 1 hour incubation with H2O2 on apoptosis in WT cells treated with tolbutamide or gliclazide.
Cells were treated for 4 hours with 25 μM tolbutamide or 10 μM gliclazide prior to application of H2O2. For comparison, the amount of caspase3-positive WT cells with different H2O2 concentrations but without sulfonylurea pretreatment is shown. n is given within each bar. *P ≤ 0.05; **P ≤ 0.01.
Blood glucose concentration in WT and Sur1–/– mice after STZ injection.
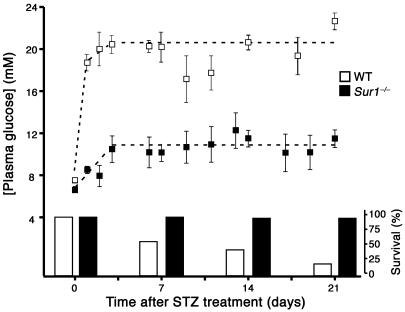
To determine whether loss of KATP channels is protective in vivo, WT and Sur1–/– male mice (8–12 weeks old) were injected with a single dose of STZ (200 mg/kg body weight, i.v.) to destroy β cells by ROS formation (39, 40). Plasma glucose levels were followed for 3 weeks. In WT mice, the blood glucose concentration increased steeply within a day after injection and remained elevated. In Sur1–/– mice, plasma glucose was only moderately increased after STZ injection and remained below the level in WT animals until day 21. The control values before treatment with STZ did not significantly differ between the 2 genotypes (WT, 7.5 ± 1.2 mM, n = 36; Sur1–/–, 6.6 ± 2.3 mM, n = 43; mean ± SD). The averaged plateau plasma glucose values from 3 days on (Figure 7) were significantly different (WT, 20.6 ± 4.1 mM, n = 56; Sur1–/–, 10.9 ± 3.4 mM, n = 89; mean ± SD; P ≤ 0.001). The untreated control values were significantly lower than the plateau values for both WT and Sur1–/– mice (P ≤ 0.001). In addition to elevating plasma glucose levels, STZ treatment had a marked effect on the viability of Sur1–/– versus WT mice: 98% of the Sur1–/– animals, but only 20% of the WT animals, survived more than 21 days (Figure 7).
Figure 7. Plasma glucose concentration and survival after a single dose of STZ (200 mg/kg body weight) injected at time point 0 in WT (n = 51) and Sur1–/– mice (n = 50).
The left axis shows plasma glucose concentration; the right axis shows percent surviving animals. Values are mean ± SD.
Activity of antioxidant enzymes in Sur1–/– versus WT islets.
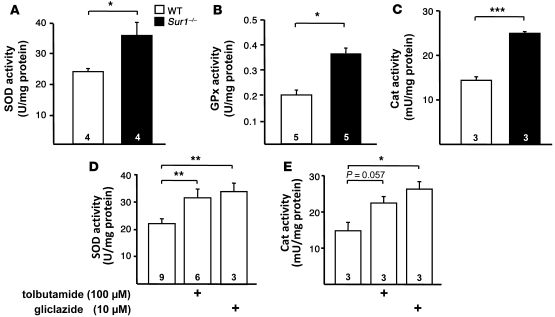
To evaluate a potential protective mechanism, we measured the activity of antioxidant enzymes in WT and Sur1–/– islets. Figure 8, A–C, shows the significantly increased activities of SOD (WT, 23.8 ± 2.6 U/mg protein; Sur1–/–, 35.8 ± 4.2 U/mg protein; P ≤ 0.05), GPx (WT, 0.20 ± 0.02 U/mg protein; Sur1–/–, 0.37 ± 0.02 U/mg protein; P ≤ 0.05), and Cat (WT, 14 ± 1 U/mg protein; Sur1–/–, 25 ± 1 mU/mg protein; P ≤ 0.001) in Sur1–/– islets compared with WT islets. In order to determine whether pharmacologic inhibition of KATP channels affects antioxidant enzyme levels, WT islets were treated with tolbutamide (100 μM) or gliclazide (10 μM) for 4 hours, and SOD and Cat activities were determined. As shown in Figure 8D, there was a significant increase in SOD activity with 100 μM tolbutamide (control, 23.7 ± 2.0 U/mg protein; tolbutamide, 31.5 ± 3.2 U/mg protein; P ≤ 0.01) and 10 μM gliclazide (control, 19.1 ± 1.0 U/mg protein; gliclazide, 33.9 ± 3.0 U/mg protein; P ≤ 0.01). Cat activity tended to increase with 100 μM tolbutamide (control, 15 ± 2 mU/mg protein; tolbutamide, 22 ± 2 mU/mg protein; Figure 8E). With 10 μM gliclazide, Cat activity augmented to 26 ± 2 mU/mg protein (P ≤ 0.05 versus control). The data imply that limiting KATP channel activity upregulates the expression of antioxidant enzymes that confers partial protection from oxidative insult.
Figure 8. Antioxidant enzymes in Sur1–/– and WT islets.
(A–C) Activity of SOD (A), GPx (B), and Cat (C) in the 2 genotypes. (D and E) SOD and Cat activities in WT islets treated for 4 hours with 100 μM tolbutamide or 10 μM gliclazide. n is given within each bar. *P ≤ 0.05; **P ≤ 0.01; ***P ≤ 0.001.
Mechanism of upregulation of antioxidant enzyme activity by pharmacologic KATP channel inhibition.
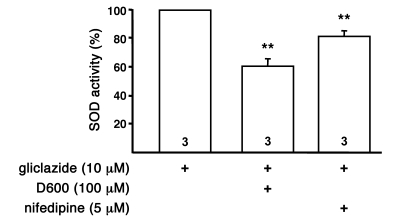
Because KATP channel activity influences Ca2+ homeostasis of β cells by regulating Ca2+ influx through L-type Ca2+ channels, we speculated that the mechanism of upregulation might be dependent on Ca2+. Furthermore, genetic or pharmacologic inhibition of KATP channels induced changes in intracellular Ca2+ homeostasis, including [Ca2+]c and mitochondrial free Ca2+ concentration ([Ca2+]m), as shown by Düfer et al. (41). SOD activity was determined after preincubation with 10 μM gliclazide for 4 hours in combination with the L-type Ca2+ channel blockers nifedipine (5 μM) or D600 (100 μM). Upregulation of SOD activity by gliclazide was significantly reduced (Figure 9), which suggests that alterations in enzyme activity caused by decreased KATP channel activity are dependent on Ca2+.
Figure 9. Ca2+ dependency of the sulfonylurea-induced upregulation of SOD activity.
Shown is the effect of different agents that influence Ca2+ homeostasis on SOD activity of WT islets. The islets were preincubated with 10 μM gliclazide for 4 hours in combination with different drugs as indicated. n is given within each bar. **P ≤ 0.01 versus gliclazide alone (set as 100%).
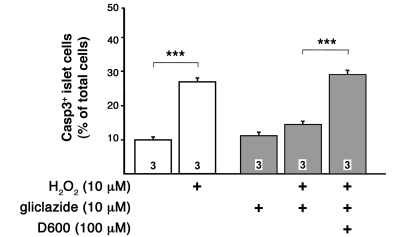
To substantiate that the upregulation of antioxidant enzyme activity is the main mechanism for the protection against ROS-mediated cell death in sulfonylurea-treated WT or Sur1–/– islet cells, H2O2-induced apoptosis was measured under conditions, similar to those described above, in which upregulation of SOD activity by sulfonylureas is prevented. We treated WT islet cells with 10 μM gliclazide for 4 hours in the presence of 100 μM D600. Subsequently, the cells were treated with 10 μM H2O2 for 1 hour. The protective effect of gliclazide against ROS-induced apoptosis was prevented in the presence of D600 (Figure 10). These observations strongly suggest that Ca2+-dependent changes in antioxidant defense mechanisms mediated via KATP channels are responsible for the lower susceptibility to ROS-induced loss of cell viability.
Figure 10. Reduction of the protective effect of gliclazide on H2O2-induced cell death by D600.
Apoptotic islet cells were detected by active caspase3. Cells were incubated for 5 hours with 10 μM gliclazide with or without 100 μM D600. During the last 60 minutes, H2O2 was added as indicated. For comparison, the effects without gliclazide treatment are shown. n is given within each bar. ***P ≤ 0.001.
Discussion
Our present results demonstrated that genetic ablation or pharmacological inhibition of KATP channels has complex effects on the response of β cells to ROS. Depolarizing β cells via reduction of KATP channel activity attenuated the inhibitory effect of H2O2 on glucose-induced insulin secretion. Three parameters, glucose metabolism, ROS generation, and ATP production (and thus KATP channel activity), are tightly coupled (42). Increasing exogenous H2O2 impaired ATP production, thus opening KATP channels and hyperpolarizing WT β cells (Figure 2) to limit Ca2+ influx (Figure 3) and therefore glucose-induced insulin secretion (Figure 1). Lack of KATP channel activity attenuated this effect of H2O2 on the energy status of β cells.
Interestingly, the loss of KATP channel activity conferred partial protection against H2O2- and NO-induced β cell apoptosis. We hypothesize that this attenuation was caused by the approximately 2-fold upregulation of SOD, GPx, and Cat, antioxidant enzymes that detoxify ROS and RNS. This upregulation seemed to be secondary to the increase in [Ca2+]c and [Ca2+]m that is induced by genetic or pharmacologic ablation of KATP channels (41). Our hypothesis is strengthened by the finding that changes in Ca2+ homeostasis provoked by inhibition of Ca2+ influx prevented the upregulation of antioxidant enzyme activity. As it is known for β cells that mitochondrial Ca2+ uptake is closely coupled to changes in [Ca2+]c (43), it can be speculated that blocking L-type Ca2+ channels induces a redistribution of cellular Ca2+, thereby lowering [Ca2+]m. As a consequence, enzyme activity would remain low even in the presence of KATP channel inhibitors. Importantly, conditions that impede the rise in antioxidant enzymes also abolished the protective effect of gliclazide on apoptosis (Figure 10). This strongly suggests that the beneficial effect of sulfonylureas on ROS/RNS-induced loss of cell viability is secondary to an increase in the antioxidant capacity of the islet cells. Altered [Ca2+]m can either directly influence the activity of antioxidant enzymes (44) or induce the formation of ROS (2, 36, 45, 46), which in turn can trigger upregulation of antioxidant defense mechanisms (47–50). Both mechanisms would protect against an additional oxidative insult by exogenous oxidants. A study with diabetic patients confirms this concept: islets from type 2 diabetic patients exhibit increased rates of apoptosis and ROS formation, which are accompanied by enhanced mRNA expression of Cat and GPx (50).
Antidiabetic agents that target KATP channels are a part of the treatment recommended by the American Diabetes Association and the European Association for the Study of Diabetes for type 2 diabetes (51). However, chronic exposure to sulfonylureas has been considered deleterious to β cell function by reducing insulin content and KATP channel expression as well as by increasing β cell apoptosis (52). Other studies question these deleterious effects of sulfonylureas. It has previously been reported that tolbutamide stimulates β cell proliferation from neonatal rats in a Ca2+-dependent manner (53) and that gliclazide protects insulin-secreting MIN6 cells from H2O2-induced damage (54), which is consistent with our present data. Another study reports that chronic glibenclamide treatment reduces glucose-induced insulin secretion in mice and induces diabetes (55). However, as shown in vitro after washout of glibenclamide and in vivo after termination of glibenclamide treatment, the adverse effects were fully reversible (55). This argues against dramatic destructive effects of the drug on β cell mass. Moreover, it has been shown that under diabetic conditions, sulfonylureas influence the activities of antioxidant enzymes: brain SOD and Cat activities are reduced in rats with STZ-induced diabetes, but the decrease in antioxidant status is reversed by glibenclamide treatment (56). According to the current concept, protection against β cell death is attributed to KATP channel openers (KCOs) instead of channel blockers. However, it has recently been postulated that the depolarization of the mitochondrial membrane potential, not its effect on the KATP channel, is the crucial factor for β cell protection by KCOs (57). Sur1–/– β cells and β cells treated with KCOs or tolbutamide (58–61) have in common a reduced mitochondrial membrane potential.
Loss of KATP channel activity also conferred resistance to STZ in vivo. STZ is reported to increase oxidative stress (39, 40), and the upregulation of antioxidant enzymes could account for the observed resistance. Reduced sensitivity to STZ has been reported for β cells from Kir6.2–/– mice, which lack KATP channels (62). The effect is attributed to reduced Glut2 activity, expected to limit the rate of STZ uptake into β cells. However, maximal plasma STZ concentration was significantly lower in Kir6.2–/– mice than in WT mice (62). Therefore, reduced tissue accumulation could also be explained by the differential STZ plasma concentrations of the 2 genotypes rather than the lower Glut2 activity of the knockout. In addition, Doliba et al. report upregulation of Glut2 mRNA in Sur1–/– islets (63), and Marhfour et al. describe identical Glut2 protein content in islets of adult WT and Sur1–/– mice (64); thus, the relative contributions of these mechanisms remain undetermined.
Both long-term genetic knockout and acute pharmacologic knockout with tolbutamide of KATP channels increased the basal rate of apoptosis. These observations are in agreement with reports that closure of KATP channels augments the rate of apoptosis in β cells (65) and in HEK-293 cells expressing the β cell–specific KATP channel subunit SUR1 (66). Importantly, the enhancement of the basal rate of apoptosis in Sur1–/– cells did not cause significant deleterious effects in vivo, but was compatible with protection against STZ-induced — and thus ROS-mediated — diabetes. Plasma glucose concentrations were equal in fasted Sur1–/– and WT mice between 15 and 19 weeks of age. The lifespan of Sur1–/– mice is normal, and glucose tolerance measured with 2 year-old animals is not significantly altered compared with WT mice (our unpublished observations). The Sur1–/– β cells display oscillating electrical activity (61), and islets show glucose-dependent insulin secretion (67).
With respect to a therapeutic application, the experiments with gliclazide are promising because they show that protection of β cells against oxidative stress by upregulation of antioxidant enzymes is possible without increasing basal apoptosis. This difference from tolbutamide may be due to the fact that gliclazide additionally acts as a free radical scavenger (68). Beneficial effects of gliclazide on survival of primary β cell and insulin-secreting cell lines have been reported in several recent papers (54, 69, 70). Administration of gliclazide represents a strategy to lower blood glucose concentration and additionally to delay diabetic complications such as micro- and macroangiopathies (71–73). Furthermore, it has been shown that gliclazide reduces platelet reactivity and stimulates endothelial prostacyclin synthesis, thereby counteracting vascular and prothrombotic microangiopathic changes, during diabetes (74). Our experiments suggest that the drug, beyond its known antioxidant properties, protects against oxidative stress by improving the antioxidant defense status of the β cells. Reduction of the oxidant insult at a prediabetic state by application of gliclazide might be a reasonable therapeutic approach to decelerate the progression of the disease or even to prevent the development of overt type 2 diabetes. A second clinical aspect of the present work concerns islet transplantation. Impairment of the donor islets by oxidative stress constitutes a significant problem limiting successful engraftment (75, 76). Islets dissected for transplantation undergo states of hypoxia and reoxygenation (77), which exposes them to oxidative stress. This, in turn, induces massive apoptosis, eventually leading to the need for islet equivalents from 2–3 donor pancreata per recipient (78, 79). After transplantation, islet viability can be further reduced by stress-activated protein kinases of the liver (80). Elevating the activity of antioxidant enzymes by KATP channel inhibition may protect the islets in vitro from the oxidative attack, thereby increasing the number of healthy islets during the isolation process and after transplantation. Thus, several clinical aspects emphasize the need to search for strategies protecting pancreatic islets against oxidative stress. We show here, for the first time to our knowledge, that reduced KATP channel activity has beneficial effects on islet cell survival during an oxidant insult caused by Ca2+-dependent upregulation of antioxidant enzymes.
Methods
Cell and islet preparation.
Experiments were performed using islets, clusters, or single pancreatic β cells isolated from fed C57BL/6 (Charles River) or Sur1–/– mice maintained in the animal facility at the Institute of Pharmacy, Department of Pharmacology, University of Tübingen. Mice were euthanized using CO2, and islets were isolated by collagenase digestion (Roche Diagnostics). To produce clusters or single cells, islets were dispersed in Ca2+-free medium and cultured for up to 4 days in RPMI 1640 medium (11.1 mM glucose) supplemented with 10% fetal calf serum, 100 U/ml penicillin, and 100 μg/ml streptomycin (81). The principles of laboratory animal care (Guide for the care and use of laboratory animals. NIH publication no. 85-23. Revised 1985) and German laws were followed. The present experiments were reviewed and approved by the Baylor College of Medicine IACUC. Cells were identified as β cells by cell size (WT, range 7.1 to 12.9 pF; Sur1–/–, range 7.1 to 12.4 pF) and, concerning WT preparations, by their characteristic glucose dependence (82, 83).
Solutions and chemicals.
Cell Vm recordings were done with a bath solution of 140 mM NaCl, 5 mM KCl, 1.2 mM MgCl2, 2.5 mM CaCl2, 15 mM glucose, and 10 mM HEPES, pH 7.4, adjusted with NaOH. The same bath solution was used for the determination of [Ca2+]c. The pipette solution consisted of 10 mM KCl, 10 mM NaCl, 70 mM K2SO4, 4 mM MgCl2, 2 mM CaCl2, 10 mM EGTA, and 10 mM HEPES, pH 7.15, adjusted with KOH and substituted with amphotericin B (250 μg/ml).
Fura-2AM was obtained from Invitrogen. RPMI 1640 medium was from PromoCell, and penicillin/streptomycin was from Invitrogen. Assay kits for determination of enzyme activities were obtained from Cayman Chemicals. The TUNEL assay kit was purchased from Roche Diagnostics, and the NucView 488 Caspase3 Assay Kit for Live cells was from Biotium Inc. All other chemicals were purchased from Sigma-Aldrich or Merck in the purest form available.
Patch-clamp recordings.
Patch pipettes were pulled from borosilicate glass capillaries (Clark) and had resistances between 3 and 5 MΩ when filled with pipette solution. Vm was recorded with an EPC-9 patch-clamp amplifier using Pulse software (HEKA) in current-clamp mode.
Measurement of [Ca2+]c.
The [Ca2+]c was measured at 37°C in single cells or small clusters by the fura-2 method according to Grynkiewicz et al. (84) using equipment and software from TILL photonics. We identified β cells as those in which [Ca2+]c was not decreased by 15 mM glucose, as described previously for α cells (85). The cells were loaded with 5 μM fura-2AM for 30 minutes at 37°C. Intracellular fura-2 was excited alternately at 340 nm or 380 nm by means of an oscillating diffraction grating. The excitation light was directed through the objective (PlanNeofluar, ×40 objective; Zeiss) by means of a glass fiber light guide and a dichroic mirror. The emitted light was filtered (LP515 nm) and measured by a digital camera (Imago CCD; TILL photonics). The ratio of the emitted light intensity at 340 nm/380 nm excitation was used to calculate [Ca2+]c following an in vitro calibration with fura-2 K+-salt.
Measurement of insulin secretion.
Batches of 5 islets were incubated for 60 minutes at 37°C with the indicated substances. Insulin was determined by radioimmunoassay using rat insulin (Linco Research) as the standard.
SOD assay.
Pancreatic islets isolated by collagenase digestion were rinsed with PBS, pH 7.4, containing 0.16 mg/ml heparin to remove any red blood cells and clots. Tissue was homogenized in 20 mM cold HEPES buffer, pH 7.2, containing 1 mM EGTA, 210 mM mannitol, and 70 mM sucrose (5 islets/μl buffer) with a Potter-Elvehjem Micro Tissue Grinder. After centrifugation at 20,800 g for 30 minutes at 4°C, the supernatant was stored at –80°C for subsequent analysis. SOD activity was determined by the Cayman Chemical Superoxide Dismutase Assay Kit using a modification described by Fried (86). A tetrazolium salt was used for the detection of superoxide radicals generated by xanthine oxidase and hypoxanthine. We defined 1 U SOD as the amount needed to exhibit 50% dismutation of the superoxide radical. The assay detects all 3 types of SOD: Cu/Zn, Mn, and Fe.
GPx assay.
Tissues were treated as in the SOD assay. Homogenization buffer was composed of 50 mM Tris-HCl, pH 7.5, containing 5 mM EDTA and 1 mM DTT. GPx activity was measured indirectly by a coupled reaction with glutathione reductase described by Günzler et al. (87). Oxidized glutathione, produced upon reduction of hydroperoxide by GPx, is recycled to its reduced state by the glutathione reductase and NADPH. The oxidation of NADPH to NADP+ is accompanied by a decrease in absorbance at 365 nm. The samples were added to 750 μl reaction buffer, containing 10 mM glutathione, 2.4 U/ml glutathione reductase, and 1 mM sodium azide (to inactivate possibly present Cat) and incubated for 5 minutes at 37°C. Subsequently, 100 μl of 1.5 mM NADPH, dissolved in 0.1% NaHCO3, was added, and the decrease of NADPH absorbance independent of H2O2 was followed until steady state. The reaction was initiated by adding 50 μl cumene hydroperoxide. Absorbance was registered every 10 seconds at 365 nm using a spectrophotometer. Under these conditions, the rate of decrease is directly proportional to the GPx activity in the sample.
Cat assay.
Treatment of tissue was carried out as described for SOD assay. Tissue was homogenized on ice with buffer composed of 50 mM potassium phosphate, pH 7.0, containing 1 mM EDTA. Cat activity was detected using the Cayman Chemicals Catalase Assay as described previously (88). The peroxidatic function of Cat was assayed by adding methanol in the presence of an optimal concentration of H2O2. The formaldehyde produced was measured colorimetrically with Purpald as the chromogen. In the presence of aldehydes, this forms a bicyclic heterocycle, which produces a purple color upon oxidation.
Protein measurements.
For protein analyses, Coomassie Brilliant Blue G-250 was used (89), with human serum albumin as standard.
Determination of apoptotic islet cells.
For determination of apoptosis, pancreatic islet cells were seeded on glass coverslips in culture dishes in RPMI 1640 medium. They were cultured for 24 hours and, for incubation, test substances were added with fresh medium as indicated. In each condition, a minimum of 1,000 cells from 3–5 different isolations was counted.
TUNEL labeling.
TUNEL technique was used to detect DNA strand breaks generated during apoptosis in situ. Pancreatic islet cells were washed with PBS and fixed with 3% paraformaldehyde at 20°C–25°C for 1 hour. After rinsing with PBS, β cells were permeabilized for 2 minutes on ice (0.1% Triton-X and sodium citrate solution) and washed once again. Each sample with fixed islet cells was covered with 50 μl TUNEL reaction mixture and incubated in a humidified atmosphere for 1 hour at 37°C in the dark. The washed and stained islet cells were monitored under a fluorescence microscope (480 nm), and apoptosis was detected by a fluorescent dye (fluorescein).
Caspase3 assay.
NucView labeling was used to determine caspase3 activity as well as nuclear DNA. Growth medium was removed from pancreatic islet cells, and 40 μl DEVD-NucView 488 Caspase3 substrate solution was added. Upon enzymatic cleavage of the substrate, the released DNA dye migrates to the cell nucleus where it binds to the DNA. The binding is high affine and results in a highly fluorescent complex. Therefore, the bifunctional substrate allows the detection of caspase3 as well as morphological changes of the nucleus. After 30 minutes of incubation at room temperature, apoptotic islet cells were visualized by fluorescence microscopy (480 nm).
STZ injection.
We used 101 Sur1–/– and WT Bl/6 male mice (22–28 g and 8–12 weeks old) for this experiment. Of these, 50 mice received i.v. injection of STZ at 200 mg/kg body weight, and 51 controls received saline. The mice were followed for 3 weeks, and glucose levels were measured once a day in a subset of the total number of animals.
Statistics.
Electrophysiological and [Ca2+]c experiments are illustrated by recordings representative of the indicated number of experiments carried out with different cells. At least 3 different cell preparations were used for each series of experiments. Where possible, mean ± SEM or mean ± SD are given in the text for the indicated number of experiments. Unless otherwise indicated, data are mean ± SEM. The statistical significance of differences between means was assessed by a 1-sample t test or Student’s t test for paired values when 2 samples were compared; multiple comparisons were made by ANOVA followed by Student-Newman-Keuls test. A P value less than 0.05 was considered significant.
Acknowledgments
We thank Isolde Breuning for skilful technical assistance. This work was supported by Deutsche Forschungsgemeinschaft grants Dr225/6-3 (to G. Drews) and DU425/1-2 (to M. Düfer).
Footnotes
Conflict of interest: The authors have declared that no conflict of interest exists.
Citation for this article: J. Clin. Invest. 119:3246–3256 (2009). doi:10.1172/JCI38817.
References
- 1.Poitout V., Robertson R.P. Glucolipotoxicity: fuel excess and beta-cell dysfunction. Endocr. Rev. 2008;29:351–366. doi: 10.1210/er.2007-0023. [DOI] [PMC free article] [PubMed] [Google Scholar]
- 2.Newsholme P., et al. Diabetes associated cell stress and dysfunction: role of mitochondrial and non-mitochondrial ROS production and activity. J. Physiol. 2007;583:9–24. doi: 10.1113/jphysiol.2007.135871. [DOI] [PMC free article] [PubMed] [Google Scholar]
- 3.Lenzen S. Oxidative stress: the vulnerable beta-cell. Biochem. Soc. Trans. 2008;36:343–347. doi: 10.1042/BST0360343. [DOI] [PubMed] [Google Scholar]
- 4.Ceriello A., Motz E. Is oxidative stress the pathogenic mechanism underlying insulin resistance, diabetes, and cardiovascular disease? The common soil hypothesis revisited. Arterioscler. Thromb. Vasc. Biol. 2004;24:816–823. doi: 10.1161/01.ATV.0000122852.22604.78. [DOI] [PubMed] [Google Scholar]
- 5.Kaneto H., et al. Oxidative stress and the JNK pathway are involved in the development of type 1 and type 2 diabetes. Curr. Mol. Med. 2007;7:674–686. doi: 10.2174/156652407782564408. [DOI] [PubMed] [Google Scholar]
- 6.Grankvist K., Marklund S., Taljedal I.B. Superoxide dismutase is a prophylactic against alloxan diabetes. Nature. 1981;294:158–160. doi: 10.1038/294158a0. [DOI] [PubMed] [Google Scholar]
- 7.Lenzen S., Drinkgern J., Tiedge M. Low antioxidant enzyme gene expression in pancreatic islets compared with various other mouse tissues. Free Radic. Biol. Med. 1996;20:463–466. doi: 10.1016/0891-5849(96)02051-5. [DOI] [PubMed] [Google Scholar]
- 8.Tiedge M., Lortz S., Drinkgern J., Lenzen S. Relation between antioxidant enzyme gene expression and antioxidative defense status of insulin-producing cells. Diabetes. 1997;46:1733–1742. doi: 10.2337/diabetes.46.11.1733. [DOI] [PubMed] [Google Scholar]
- 9.Tiedge M., Lortz S., Munday R., Lenzen S. Protection against the co-operative toxicity of nitric oxide and oxygen free radicals by overexpression of antioxidant enzymes in bioengineered insulin-producing RINm5F cells. Diabetologia. 1999;42:849–855. doi: 10.1007/s001250051237. [DOI] [PubMed] [Google Scholar]
- 10.Jörns A., Tiedge M., Lenzen S., Munday R. Effect of superoxide dismutase, catalase, chelating agents, and free radical scavengers on the toxicity of alloxan to isolated pancreatic islets in vitro. Free Radic. Biol. Med. 1999;26:1300–1304. doi: 10.1016/S0891-5849(98)00325-6. [DOI] [PubMed] [Google Scholar]
- 11.Kubisch H.M., Wang J., Bray T.M., Phillips J.P. Targeted overexpression of Cu/Zn superoxide dismutase protects pancreatic beta-cells against oxidative stress. Diabetes. 1997;46:1563–1566. doi: 10.2337/diabetes.46.10.1563. [DOI] [PubMed] [Google Scholar]
- 12.Robbins M.J., Sharp R.A., Slonim A.E., Burr I.M. Protection against streptozotocin-induced diabetes by superoxide dismutase. Diabetologia. 1980;18:55–58. doi: 10.1007/BF01228303. [DOI] [PubMed] [Google Scholar]
- 13.Gandy S.E., Buse M.G., Crouch R.K. Protective role of superoxide dismutase against diabetogenic drugs. J. Clin. Invest. 1982;70:650–658. doi: 10.1172/JCI110659. [DOI] [PMC free article] [PubMed] [Google Scholar]
- 14.Asplund K., Grankvist K., Marklund S., Taljedal I.B. Partial protection against streptozotocin-induced hyperglycaemia by superoxide dismutase linked to polyethylene glycol. Acta Endocrinol. (Copenh.). 1984;107:390–394. doi: 10.1530/acta.0.1070390. [DOI] [PubMed] [Google Scholar]
- 15.Kaneto H., et al. Beneficial effects of antioxidants in diabetes: possible protection of pancreatic beta-cells against glucose toxicity. Diabetes. 1999;48:2398–2406. doi: 10.2337/diabetes.48.12.2398. [DOI] [PubMed] [Google Scholar]
- 16.Eizirik D.L., et al. Major species differences between humans and rodents in the susceptibility to pancreatic beta-cell injury. Proc. Natl. Acad. Sci. U. S. A. 1994;91:9253–9256. doi: 10.1073/pnas.91.20.9253. [DOI] [PMC free article] [PubMed] [Google Scholar]
- 17.Welsh N., et al. Differences in the expression of heat-shock proteins and antioxidant enzymes between human and rodent pancreatic islets: implications for the pathogenesis of insulin-dependent diabetes mellitus. Mol. Med. 1995;1:806–820. [PMC free article] [PubMed] [Google Scholar]
- 18.Tonooka N., Oseid E., Zhou H., Harmon J.S., Robertson R.P. Glutathione peroxidase protein expression and activity in human islets isolated for transplantation. Clin. Transplant. 2007;21:767–772. doi: 10.1111/j.1399-0012.2007.00736.x. [DOI] [PubMed] [Google Scholar]
- 19.Moriscot C., et al. Contribution of adenoviral-mediated superoxide dismutase gene transfer to the reduction in nitric oxide-induced cytotoxicity on human islets and INS-1 insulin-secreting cells. Diabetologia. 2000;43:625–631. doi: 10.1007/s001250051351. [DOI] [PubMed] [Google Scholar]
- 20.Ehses J.A., et al. Increased number of islet-associated macrophages in type 2 diabetes. Diabetes. 2007;56:2356–2370. doi: 10.2337/db06-1650. [DOI] [PubMed] [Google Scholar]
- 21.Rösen P., et al. The role of oxidative stress in the onset and progression of diabetes and its complications: a summary of a Congress Series sponsored by UNESCO-MCBN, the American Diabetes Association and the German Diabetes Society. . Diabetes Metab. Res. Rev. 2001;17:189–212. doi: 10.1002/dmrr.196. [DOI] [PubMed] [Google Scholar]
- 22.Song F., et al. Oxidative stress, antioxidant status and DNA damage in patients with impaired glucose regulation and newly diagnosed Type 2 diabetes. Clin. Sci. (Lond.). 2007;112:599–606. doi: 10.1042/CS20060323. [DOI] [PubMed] [Google Scholar]
- 23.Krippeit-Drews P., Lang F., Häussinger D., Drews G. H2O2 induced hyperpolarization of pancreatic B-cells. . Pflügers Arch. 1994;426:552–554. doi: 10.1007/BF00378534. [DOI] [PubMed] [Google Scholar]
- 24.Nakazaki M., Kakei M., Koriyama N., Tanaka H. Involvement of ATP-sensitive K+ channels in free radical-mediated inhibition of insulin secretion in rat pancreatic beta-cells. . Diabetes. 1995;44:878–883. doi: 10.2337/diabetes.44.8.878. [DOI] [PubMed] [Google Scholar]
- 25.Maechler P., Jornot L., Wollheim C.B. Hydrogen peroxide alters mitochondrial activation and insulin secretion in pancreatic beta cells. J. Biol. Chem. 1999;274:27905–27913. doi: 10.1074/jbc.274.39.27905. [DOI] [PubMed] [Google Scholar]
- 26.Drews G., Krämer C., Düfer M., Krippeit-Drews P. Contrasting effects of alloxan on islets and single mouse pancreatic beta-cells. Biochem. J. 2000;352:389–397. doi: 10.1042/0264-6021:3520389. [DOI] [PMC free article] [PubMed] [Google Scholar]
- 27.Nakazaki M., et al. Diverse effects of hydrogen peroxide on cytosolic Ca2+ homeostasis in rat pancreatic beta-cells. . Cell Struct. Funct. 2000;25:187–193. doi: 10.1247/csf.25.187. [DOI] [PubMed] [Google Scholar]
- 28.Brady N.R., et al. Coordinated behavior of mitochondria in both space and time: a reactive oxygen species-activated wave of mitochondrial depolarization. Biophys. J. 2004;87:2022–2034. doi: 10.1529/biophysj.103.035097. [DOI] [PMC free article] [PubMed] [Google Scholar]
- 29.Zorov D.B., Juhaszova M., Sollott S.J. Mitochondrial ROS-induced ROS release: an update and review. Biochim. Biophys. Acta. 2006;1757:509–517. doi: 10.1016/j.bbabio.2006.04.029. [DOI] [PubMed] [Google Scholar]
- 30.Tsuura Y., et al. Nitric oxide opens ATP-sensitive K+ channels through suppression of phosphofructokinase activity and inhibits glucose-induced insulin release in pancreatic beta cells. . J. Gen. Physiol. 1994;104:1079–1098. doi: 10.1085/jgp.104.6.1079. [DOI] [PMC free article] [PubMed] [Google Scholar]
- 31.Krippeit-Drews P., et al. The effects of nitric oxide on the membrane potential and ionic currents of mouse pancreatic B cells. Endocrinology. 1995;136:5363–5369. doi: 10.1210/en.136.12.5363. [DOI] [PubMed] [Google Scholar]
- 32.Drews G., Krämer C., Krippeit-Drews P. Dual effect of NO on K+ATP current of mouse pancreatic B-cells: stimulation by deenergizing mitochondria and inhibition by direct interaction with the channel. . Biochim. Biophys. Acta. 2000;1464:62–68. doi: 10.1016/S0005-2736(99)00242-4. [DOI] [PubMed] [Google Scholar]
- 33.Kaneko Y., Ishikawa T., Amano S., Nakayama K. Dual effect of nitric oxide on cytosolic Ca2+ concentration and insulin secretion in rat pancreatic beta-cells. . Am. J. Physiol. Cell Physiol. 2003;284:C1215–C1222. doi: 10.1152/ajpcell.00223.2002. [DOI] [PubMed] [Google Scholar]
- 34.Sunouchi T., Suzuki K., Nakayama K., Ishikawa T. Dual effect of nitric oxide on ATP-sensitive K+ channels in rat pancreatic beta cells. . Pflügers Arch. 2008;456:573–579. doi: 10.1007/s00424-008-0463-z. [DOI] [PubMed] [Google Scholar]
- 35.Orrenius S., Gogvadze V., Zhivotovsky B. Mitochondrial oxidative stress: implications for cell death. Annu. Rev. Pharmacol. Toxicol. 2007;47:143–183. doi: 10.1146/annurev.pharmtox.47.120505.105122. [DOI] [PubMed] [Google Scholar]
- 36.Brookes P.S., Yoon Y., Robotham J.L., Anders M.W., Sheu S.S. Calcium, ATP, and ROS: a mitochondrial love-hate triangle. Am. J. Physiol. Cell. Physiol. 2004;287:C817–C833. doi: 10.1152/ajpcell.00139.2004. [DOI] [PubMed] [Google Scholar]
- 37.Duchen M.R. Roles of mitochondria in health and disease. Diabetes. 2004;53(Suppl. 1):S96–S102. doi: 10.2337/diabetes.53.2007.s96. [DOI] [PubMed] [Google Scholar]
- 38.Krippeit-Drews P., et al. Interference of H2O2 with stimulus-secretion coupling in mouse pancreatic beta-cells. . J. Physiol. 1999;514:471–481. doi: 10.1111/j.1469-7793.1999.471ae.x. [DOI] [PMC free article] [PubMed] [Google Scholar]
- 39.Friesen N.T., Buchau A.S., Schott-Ohly P., Lgssiar A., Gleichmann H. Generation of hydrogen peroxide and failure of antioxidative responses in pancreatic islets of male C57BL/6 mice are associated with diabetes induced by multiple low doses of streptozotocin. Diabetologia. 2004;47:676–685. doi: 10.1007/s00125-004-1367-x. [DOI] [PubMed] [Google Scholar]
- 40.Nukatsuka M., Sakurai H., Yoshimura Y., Nishida M., Kawada J. Enhancement by streptozotocin of O2– radical generation by the xanthine oxidase system of pancreatic beta-cells. . FEBS Lett. 1988;239:295–298. doi: 10.1016/0014-5793(88)80938-4. [DOI] [PubMed] [Google Scholar]
- 41.Düfer M., et al. The KATP channel is critical for calcium sequestration into non-ER compartments in mouse pancreatic beta cells. . Cell. Physiol. Biochem. 2007;20:65–74. doi: 10.1159/000104154. [DOI] [PubMed] [Google Scholar]
- 42.Fridlyand L.E., Philipson L.H. Does the glucose-dependent insulin secretion mechanism itself cause oxidative stress in pancreatic beta-cells? Diabetes. 2004;53:1942–1948. doi: 10.2337/diabetes.53.8.1942. [DOI] [PubMed] [Google Scholar]
- 43.Kennedy E.D., et al. Glucose-stimulated insulin secretion correlates with changes in mitochondrial and cytosolic Ca2+ in aequorin-expressing INS-1 cells. . J. Clin. Invest. 1996;98:2524–2538. doi: 10.1172/JCI119071. [DOI] [PMC free article] [PubMed] [Google Scholar]
- 44.Schild L., Plumeyer F., Reiser G. Ca2+ rise within a narrow window of concentration prevents functional injury of mitochondria exposed to hypoxia/reoxygenation by increasing antioxidative defence. . FEBS J. 2005;272:5844–5852. doi: 10.1111/j.1742-4658.2005.04978.x. [DOI] [PubMed] [Google Scholar]
- 45.Giorgi C., Romagnoli A., Pinton P., Rizzuto R. Ca2+ signaling, mitochondria and cell death. . Curr. Mol. Med. 2008;8:119–130. doi: 10.2174/156652408783769571. [DOI] [PubMed] [Google Scholar]
- 46.Duchen M.R. Mitochondria and calcium: from cell signalling to cell death. J. Physiol. 2000;529:57–68. doi: 10.1111/j.1469-7793.2000.00057.x. [DOI] [PMC free article] [PubMed] [Google Scholar]
- 47.Ji L.L. Modulation of skeletal muscle antioxidant defense by exercise: Role of redox signaling. Free Radic. Biol. Med. 2008;44:142–152. doi: 10.1016/j.freeradbiomed.2007.02.031. [DOI] [PubMed] [Google Scholar]
- 48.Gomez-Cabrera M.C., Domenech E., Vina J. Moderate exercise is an antioxidant: upregulation of antioxidant genes by training. Free Radic. Biol. Med. 2008;44:126–131. doi: 10.1016/j.freeradbiomed.2007.02.001. [DOI] [PubMed] [Google Scholar]
- 49.Radak Z., Chung H.Y., Goto S. Systemic adaptation to oxidative challenge induced by regular exercise. Free Radic. Biol. Med. 2008;44:153–159. doi: 10.1016/j.freeradbiomed.2007.01.029. [DOI] [PubMed] [Google Scholar]
- 50.Marchetti P., et al. Pancreatic islets from type 2 diabetic patients have functional defects and increased apoptosis that are ameliorated by metformin. J. Clin. Endocrinol. Metab. 2004;89:5535–5541. doi: 10.1210/jc.2004-0150. [DOI] [PubMed] [Google Scholar]
- 51.Nathan D.M., et al. Medical management of hyperglycaemia in type 2 diabetes mellitus: a consensus algorithm for the initiation and adjustment of therapy: A consensus statement from the American Diabetes Association and the European Association for the Study of Diabetes. Diabetologia. 2009;52:17–30. doi: 10.1007/s00125-008-1157-y. [DOI] [PubMed] [Google Scholar]
- 52.Takahashi A., et al. Sulfonylurea and glinide reduce insulin content, functional expression of KATP channels, and accelerate apoptotic beta-cell death in the chronic phase. . Diabetes Res. Clin. Pract. 2007;77:343–350. doi: 10.1016/j.diabres.2006.12.021. [DOI] [PubMed] [Google Scholar]
- 53.Popiela H., Moore W. Tolbutamide stimulates proliferation of pancreatic beta cells in culture. Pancreas. 1991;6:464–469. doi: 10.1097/00006676-199107000-00014. [DOI] [PubMed] [Google Scholar]
- 54.Kimoto K., et al. Gliclazide protects pancreatic beta-cells from damage by hydrogen peroxide. Biochem. Biophys. Res. Commun. 2003;303:112–119. doi: 10.1016/S0006-291X(03)00310-3. [DOI] [PubMed] [Google Scholar]
- 55.Remedi M.S., Nichols C.G. Chronic antidiabetic sulfonylureas in vivo: reversible effects on mouse pancreatic beta-cells. PLoS Med. 2008;5:e206. doi: 10.1371/journal.pmed.0050206. [DOI] [PMC free article] [PubMed] [Google Scholar]
- 56.Nazaroglu N.K., Sepici-Dincel A., Altan N. The effects of sulfonylurea glyburide on superoxide dismutase, catalase, and glutathione peroxidase activities in the brain tissue of streptozotocin-induced diabetic rat. J. Diabetes Complications. 2009;23:209–213. doi: 10.1016/j.jdiacomp.2007.09.001. [DOI] [PubMed] [Google Scholar]
- 57.Sandler S., et al. Possible role of an ischemic preconditioning-like response mechanism in KATP channel opener-mediated protection against streptozotocin-induced suppression of rat pancreatic islet function. . Biochem. Pharmacol. 2008;76:1748–1756. doi: 10.1016/j.bcp.2008.09.004. [DOI] [PubMed] [Google Scholar]
- 58.Düfer M., Krippeit-Drews P., Lembert N., Idahl L.A., Drews G. Diabetogenic effect of cyclosporin A is mediated by interference with mitochondrial function of pancreatic B-cells. Mol. Pharmacol. 2001;60:873–879. [PubMed] [Google Scholar]
- 59.Kullin M., et al. Protection of rat pancreatic islets by potassium channel openers against alloxan, sodium nitroprusside and interleukin-1beta mediated suppression--possible involvement of the mitochondrial membrane potential. Diabetologia. 2003;46:80–88. doi: 10.1007/s00125-002-0997-0. [DOI] [PubMed] [Google Scholar]
- 60.Smith P.A., Proks P., Moorhouse A. Direct effects of tolbutamide on mitochondrial function, intracellular Ca2+ and exocytosis in pancreatic beta-cells. . Pflügers Arch. 1999;437:577–588. doi: 10.1007/s004240050820. [DOI] [PubMed] [Google Scholar]
- 61.Düfer M., et al. Oscillations of membrane potential and cytosolic Ca2+ concentration in SUR1–/– beta cells. . Diabetologia. 2004;47:488–498. doi: 10.1007/s00125-004-1348-0. [DOI] [PubMed] [Google Scholar]
- 62.Xu J., et al. KATP channel-deficient pancreatic beta-cells are streptozotocin resistant because of lower GLUT2 activity. . Am. J. Physiol. Endocrinol. Metab. 2008;294:E326–335. doi: 10.1152/ajpendo.00296.2007. [DOI] [PubMed] [Google Scholar]
- 63.Doliba N.M., et al. Cholinergic regulation of fuel-induced hormone secretion and respiration of SUR1–/– mouse islets. . Am. J. Physiol. Endocrinol. Metab. 2006;291:E525–E535. doi: 10.1152/ajpendo.00579.2005. [DOI] [PubMed] [Google Scholar]
- 64.Marhfour I., et al. Impact of Sur1 gene inactivation on the morphology of mouse pancreatic endocrine tissue. Cell Tissue Res. . 2009;335:505–515. doi: 10.1007/s00441-008-0733-2. [DOI] [PubMed] [Google Scholar]
- 65.Efanova I.B., et al. Glucose and tolbutamide induce apoptosis in pancreatic beta-cells. A process dependent on intracellular Ca2+ concentration. . J. Biol. Chem. 1998;273:33501–33507. doi: 10.1074/jbc.273.50.33501. [DOI] [PubMed] [Google Scholar]
- 66.Hambrock A., de Oliveira Franz C.B., Hiller S., Osswald H. Glibenclamide-induced apoptosis is specifically enhanced by expression of the sulfonylurea receptor isoform SUR1 but not by expression of SUR2B or the mutant SUR1(M1289T). . J. Pharmacol. Exp. Ther. 2006;316:1031–1037. doi: 10.1124/jpet.105.097501. [DOI] [PubMed] [Google Scholar]
- 67.Haspel D., et al. Crosstalk between membrane potential and cytosolic Ca2+ concentration in beta cells from Sur1–/– mice. . Diabetologia. 2005;48:913–921. doi: 10.1007/s00125-005-1720-8. [DOI] [PubMed] [Google Scholar]
- 68.Scott N.A., Jennings P.E., Brown J., Belch J.J. Gliclazide: a general free radical scavenger. Eur. J. Pharmacol. 1991;208:175–177. doi: 10.1016/0922-4106(91)90069-T. [DOI] [PubMed] [Google Scholar]
- 69.Del Guerra S., et al. Gliclazide protects human islet beta-cells from apoptosis induced by intermittent high glucose. Diabetes Metab. Res. Rev. 2007;23:234–238. doi: 10.1002/dmrr.680. [DOI] [PubMed] [Google Scholar]
- 70.Sawada F., et al. Differential effect of sulfonylureas on production of reactive oxygen species and apoptosis in cultured pancreatic beta-cell line, MIN6. Metabolism. 2008;57:1038–1045. doi: 10.1016/j.metabol.2008.01.038. [DOI] [PubMed] [Google Scholar]
- 71.Fava D., et al. Gliclazide improves anti-oxidant status and nitric oxide-mediated vasodilation in Type 2 diabetes. Diabet. Med. 2002;19:752–757. doi: 10.1046/j.1464-5491.2002.00762.x. [DOI] [PubMed] [Google Scholar]
- 72.Noda Y., Mori A., Cossins E., Packer L. Gliclazide scavenges hydroxyl and superoxide radicals: an electron spin resonance study. Metabolism. 2000;49:14–16. doi: 10.1016/S0026-0495(00)80079-7. [DOI] [PubMed] [Google Scholar]
- 73.O‘Brien R.C., Luo M., Balazs N., Mercuri J. In vitro and in vivo antioxidant properties of gliclazide. J. Diabetes Complications. 2000;14:201–206. doi: 10.1016/S1056-8727(00)00084-2. [DOI] [PubMed] [Google Scholar]
- 74.Jennings P.E. Vascular benefits of gliclazide beyond glycemic control. Metabolism. 2000;49:17–20. doi: 10.1053/meta.2000.17825. [DOI] [PubMed] [Google Scholar]
- 75.Li X., Chen H., Epstein P.N. Metallothionein protects islets from hypoxia and extends islet graft survival by scavenging most kinds of reactive oxygen species. J. Biol. Chem. 2004;279:765–771. doi: 10.1074/jbc.M307907200. [DOI] [PubMed] [Google Scholar]
- 76.Mysore T.B., et al. Overexpression of glutathione peroxidase with two isoforms of superoxide dismutase protects mouse islets from oxidative injury and improves islet graft function. Diabetes. 2005;54:2109–2116. doi: 10.2337/diabetes.54.7.2109. [DOI] [PubMed] [Google Scholar]
- 77.Hara Y., Fujino M., Adachi K., Li X.K. The reduction of hypoxia-induced and reoxygenation-induced apoptosis in rat islets by epigallocatechin gallate. Transplant Proc. 2006;38:2722–2725. doi: 10.1016/j.transproceed.2006.08.010. [DOI] [PubMed] [Google Scholar]
- 78.Ryan E.A., et al. Successful islet transplantation: continued insulin reserve provides long-term glycemic control. Diabetes. 2002;51:2148–2157. doi: 10.2337/diabetes.51.7.2148. [DOI] [PubMed] [Google Scholar]
- 79.Lakey J.R., Mirbolooki M., Shapiro A.M. Current status of clinical islet cell transplantation. Methods Mol. Biol. 2006;333:47–104. doi: 10.1385/1-59745-049-9:47. [DOI] [PubMed] [Google Scholar]
- 80.Noguchi H., et al. Effect of JNK inhibitor during islet isolation and transplantation. Transplant Proc. 2008;40:379–381. doi: 10.1016/j.transproceed.2008.01.055. [DOI] [PubMed] [Google Scholar]
- 81.Plant T.D. Properties and calcium-dependent inactivation of calcium currents in cultured mouse pancreatic B-cells. J. Physiol. 1988;404:731–747. doi: 10.1113/jphysiol.1988.sp017316. [DOI] [PMC free article] [PubMed] [Google Scholar]
- 82.Barg S., Galvanovskis J., Gopel S.O., Rorsman P., Eliasson L. Tight coupling between electrical activity and exocytosis in mouse glucagon-secreting alpha-cells. Diabetes. 2000;49:1500–1510. doi: 10.2337/diabetes.49.9.1500. [DOI] [PubMed] [Google Scholar]
- 83.Leung Y.M., et al. Electrophysiological characterization of pancreatic islet cells in the mouse insulin promoter-green fluorescent protein mouse. Endocrinology. 2005;146:4766–4775. doi: 10.1210/en.2005-0803. [DOI] [PubMed] [Google Scholar]
- 84.Grynkiewicz G., Poenie M., Tsien R.Y. A new generation of Ca2+ indicators with greatly improved fluorescence properties. . J. Biol. Chem. 1985;260:3440–3450. [PubMed] [Google Scholar]
- 85.Nadal A., Quesada I., Soria B. Homologous and heterologous asynchronicity between identified alpha-, beta- and delta-cells within intact islets of Langerhans in the mouse. J. Physiol. 1999;517:85–93. doi: 10.1111/j.1469-7793.1999.0085z.x. [DOI] [PMC free article] [PubMed] [Google Scholar]
- 86.Fried R. Enzymatic and non-enzymatic assay of superoxide dismutase. Biochimie. 1975;57:657–660. doi: 10.1016/S0300-9084(75)80147-7. [DOI] [PubMed] [Google Scholar]
- 87.Günzler W.A., Kremers H., Flohe L. An improved coupled test procedure for glutathione peroxidase (EC 1-11-1-9-) in blood. Z Klin. Chem. Klin. Biochem. 1974;12:444–448. doi: 10.1515/cclm.1974.12.10.444. [DOI] [PubMed] [Google Scholar]
- 88.Johansson L.H., Borg L.A. A spectrophotometric method for determination of catalase activity in small tissue samples. Anal. Biochem. 1988;174:331–336. doi: 10.1016/0003-2697(88)90554-4. [DOI] [PubMed] [Google Scholar]
- 89.Bradford M.M. A rapid and sensitive method for the quantitation of microgram quantities of protein utilizing the principle of protein-dye binding. Anal. Biochem. 1976;72:248–254. doi: 10.1016/0003-2697(76)90527-3. [DOI] [PubMed] [Google Scholar]


