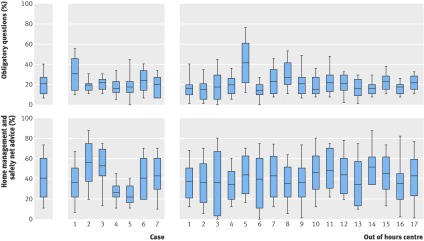
Box plots (distributions) of percentage obligatory questions asked versus standard and percentage home management and safety advice provided versus standard. Left panel shows distribution for all calls (n=357), middle panel shows distributions per case (51 calls per box plot), and right panel shows distributions per out of hours centre (21 calls per box plot). Each box plot shows mean value (solid line), 25th and 75th centiles (lower and higher boundaries of grey box) indicating central part, and 10th and the 90th centiles (grey “whiskers” outside box) indicating outer parts of distribution

An official website of the United States government
Here's how you know
Official websites use .gov
A
.gov website belongs to an official
government organization in the United States.
Secure .gov websites use HTTPS
A lock (
) or https:// means you've safely
connected to the .gov website. Share sensitive
information only on official, secure websites.
