Abstract
Background
Strict blood glucose control by applying nurse-driven protocols is common nowadays in intensive care units (ICUs). Implementation of a predictive control system can potentially reduce the workload for medical staff but requires a model for accurately predicting the glycemia signal within a certain time horizon.
Methods
GlucoDay (A. Menarini Diagnostics, Italy) data coming from 19 critically ill patients (from a surgical ICU) are used to estimate the initial ICU “minimal” model (based on data of the first 24 hours) and to reestimate the model as new measurements are obtained. The reestimation is performed every hour or every 4 hours. For both approaches the optimal size of the data set for each reestimation is determined.
Results
The prediction error that is obtained when applying the 1-hour reestimation strategy is significantly smaller than when the model is reestimated only every 4 hours (p < 0.001). The optimal size of the data set to be considered in each reestimation process of the ICU minimal model is found to be 4 hours. The obtained average “mean percentage error” is 7.6% (SD 3.1%) and 14.6% (SD 7.0%) when the model is reestimated every hour and 4 hours, respectively.
Conclusions
Implementation of the ICU minimal model in the appropriate reestimation process results in clinically acceptable prediction errors. Therefore, the model is able to predict glycemia trends of patients admitted to the surgical ICU and can potentially be used in a predictive control system.
Keywords: glycemia prediction, intensive care unit, minimal model, parameter estimation, physical models
Introduction
Hyperglycemia and insulin resistance are common in critically ill patients (even those without diabetes mellitus) and are associated with adverse outcomes. Tight glycemia control (with 80–110 mg/dl as target range) by applying intensive insulin therapy in patients admitted to the medical and the surgical intensive care unit (ICU) results in a spectacular reduction in mortality and morbidity.1,2 Currently, ICU patients are treated through a manual and rigorous administration of insulin.3 In the available literature several physical models that describe the glucose dynamics and the insulin kinetics of healthy and diabetic subjects are used for glycemia control simulations in “mathematical” diabetic (type I) patients.4,5 A (semi-)automated predictive control system can be developed for glycemia control in the ICU.6 This system has the potential to further reduce mortality and morbidity in the ICU and to restrict the workload for medical staff. Because patients who are admitted to the ICU show a significantly different clinical behavior than patients with diabetes,6 a model specifically developed for describing the glucose and the insulin dynamics of ICU patients is required. In this study an existing ICU model structure is estimated based on a real-life ICU data set and a reestimation strategy to improve the performance of predicting glycemia in the ICU is proposed.
Subjects and Methods
Subjects
The GlucoDay system (A. Menarini Diagnostics, Italy), which is a portable instrument provided with a micropump and a biosensor coupled to a microdialysis system, was used to measure the glucose concentration that was (manually) controlled by nurses using a standard protocol.3 After informed consent from the next of kin, a microfiber was implanted in 19 ventilated adult patients admitted to the surgical ICU of the University Hospital K.U. Leuven (Belgium) for a variety of reasons (see Table 1). After implantation of the fiber in the periumbilical subcutaneous tissue, near-continuous subcutaneous glucose levels were recorded for 48 hours. Every 3 minutes the mean value of the last 3 minutes was exported.
Table 1.
Patient Population (Coming from a Surgical Intensive Care Unit)
| Variable | Value |
|---|---|
| Male sex–no (%) | 13 (68.4) |
| Age (years) (SD) | 61.7 (13.8) |
| Body mass index (kg/m2) (SD) | 26.9 (4.7) |
| Reason for intensive care–no (%) | |
| Cardiac surgery | 8 (42.1) |
| Noncardiac indication | 11 (57.9) |
| Neurologic disease, cerebral trauma, or brain surgery | 3 (15.8) |
| Thoracic surgery, respiratory insufficiency, or both | 2 (10.5) |
| Abdominal surgery or peritonitis | 3 (15.8) |
| Vascular surgery | 2 (10.5) |
| Other | 1 (5.3) |
| APACHE II score (first 24 hours) (SD) | 17.5 (5.6) |
| Mean glycemia (mg/dl) (SD) | 111 (26) |
| Minimal glycemia (mg/dl) | 50 |
| Maximal glycemia (mg/dl) | 223 |
The use of near-continuous glucose measurement devices has the potential to improve glycemia control in patients with diabetes. The introduction of these sensors in a (future) predictive control system for normalizing glycemia of critically ill patients also reveals interesting opportunities. Unfortunately, accurately measuring near-continuous sensor devices are not yet available.7,8 Therefore, it was required to retrospectively calibrate this near-continuous GlucoDay signal with arterial blood glucose values measured concomitantly every hour using the ABL machine (Radiometer, Copenhagen, Denmark) during the first 24 hours. During the next 24 hours, arterial blood glucose was measured every 4 hours. The administered flows of carbohydrate calories and insulin were also stored. The study protocol was approved by the Institutional Ethical Review Board (ML2637).
The ICU “Minimal” Model
The presented model structure originates from the known “minimal” model developed by Bergman and colleagues.9 This model consists of a single glucose compartment. Plasma insulin is assumed to act through a so-called remote compartment to influence net glucose uptake.10 The model reliably describes plasma glucose disappearance11 and insulin kinetics12 during an intravenous glucose tolerance test (IVGTT) in a healthy person. In this test, 300 mg glucose/kg body weight is administered intravenously to a person after which the plasma glucose and insulin concentration are measured with a high sampling frequency.
In Van Herpe et al.13 the original minimal model was extended to the ICU “minimal” model (ICU-MM) by taking into consideration some features typical of ICU patients. First of all, the ICU-MM contains an endogenous and an exogenous insulin section, whereas the exogenous part is not included in the original Bergman model. Because the majority of critically ill patients are nondiabetic, the endogenous insulin section is still active. Due to the increased insulin resistance and the insufficient activity of the pancreas, some exogenously administered insulin flow is required for most of the patients. Second, the endogenous insulin section in the original Bergman model is transformed mathematically into a set of two equations with the goal of the model to not be an explicit function of time. Indeed, the original minimal model is considered to describe the glucose and insulin dynamics only during a single IVGTT (taken into account the time related to the start of the glucose shot). The ICU-MM is developed for use in a predictive control system with a continuous flow (i.e., a series of single shots) of delivered carbohydrates (and other input variables6). Consequently, resetting time to 0 at each administered glucose shot is not feasible, explaining the need for the mathematical manipulation. The ICU-MM is presented as
where G and I1 are the glucose and the insulin concentrations in the blood plasma. The variable X describes the effect of insulin on net glucose disappearance and is proportional to insulin in the remote compartment. The variable I2, which is introduced for mathematical reasons, does not have a strictly defined clinical interpretation but can be approached by the fraction of insulin concentration derived from the endogenous insulin secretion. The parameters Gb and Ib denote the basal value of plasma glucose and plasma insulin, respectively. The model consists of two input variables: the exogenous insulin flow (FI) and the carbohydrate (glucose) calories flow (FG), both administered intravenously. The glucose distribution space and the insulin distribution volume are denoted as VG and VI, respectively. The coefficient P1 represents the glucose effectiveness (i.e., the fractional clearance of glucose) when insulin remains at the basal level; P2 and P3 are the fractional rates of net remote insulin disappearance and insulin-dependent increase, respectively. Endogenous insulin is represented as the insulin flow that is released in proportion (by γ) to the degree by which glycemia exceeds a glucose threshold level h. The time constant for insulin disappearance is denoted as n. In case glycemia does not surpass the glucose threshold level h, the first part of the I1 equation (that represents the endogenous insulin production) equals 0. In order to keep the correct units, an additional model coefficient, β = 1 min, is added. Finally, the coefficient α is a scaling factor for the second insulin variable I2. Table 2 gives an overview of the variables, patient features, and coefficients used in the ICU-MM. Figure 1 illustrates the ICU-MM structure.
Table 2.
Variables, Patient Features, and Coefficient Values Applicable in the ICU-MM
| Variable | Unit | Variable | Unit |
|---|---|---|---|
| G | mg/dl | I2 | μU/ml |
| X | 1/min | FI | μU/min |
| I1 | μU/ml | FG | mg/min |
| Patient feature | Unit | Value |
|---|---|---|
| BM | kg | Body mass |
| VG | dl | 1.6 BM5 |
| VI | ml | 120 BM5 |
| Gb | mg/dl | Basal glycemia |
| Ib | μU/ml | Basal insulin |
| Coefficient | Unit | Value |
|---|---|---|
| P1 | 1/min | −1.31 × 10⁻²a |
| P2 | 1/min | −1.35 × 10⁻²a |
| P3 | ml/(min2 μU) | 2.90 × 10⁻⁶a |
| h | mg/dl | 136a |
| n | 1/min | 0.13a |
| α | 1/min | 3.11 |
| β | min | 1 |
| γ | 5.36 × 10⁻³a |
As initial value for the model estimation process, mean model coefficient values for the obese–low glucose tolerance patient group, described in Bergman et al.,9 are used.
Figure 1.
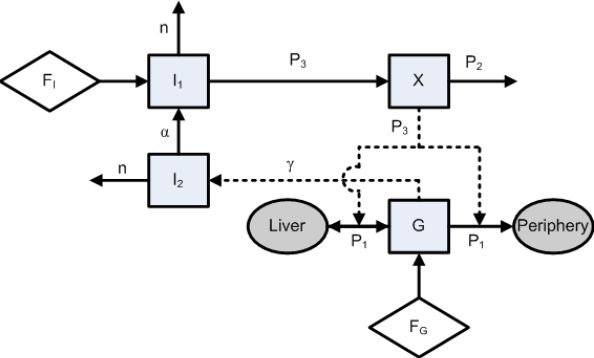
Representation of the ICU-MM. The state variables of the model (G, X, I1, and I2) and the body segments (liver and periphery) are denoted as squares and ellipses, respectively. The exogenous input variables (FI and FG, administered intravenously to the patient) are illustrated as rhombi. The model parameters (P1, P2, P3, n, α, and γ) are related to the respective variables. A direct physical relation is represented by a solid arrow, whereas a rather mathematical relationship is denoted as a dashed arrow.
Adaptive Modeling Approach: Study Design
In this study the model structure described earlier (ICU-MM) is estimated on a real-life ICU data set. Because of the large inter- and intrapatient variability that exists in the ICU (e.g., patient-specific initial and dynamical known input variables, reaction on medical treatment, time-varying insulin resistance), it is required to reestimate the ICU-MM at frequent time intervals to capture dynamic features as much as possible.6 The main contribution of this study is the performance improvement of this reestimation process. In general, the adaptive modeling approach can be described as follows.
First of all, the ICU-MM is used as a general template, which is estimated for each individual patient (based on data belonging to the first 24 hours of each patient's data set and leading to the “initial” model for that patient) such that the model parameters P1, P2, P3, n, α, and γ are patient specific. The parameter estimation is solved as a nonlinear least-squares (N-LSQ) program in Matlab®. The least-squares objective function arrives from penalizing deviations between simulated and observed glycemia trajectories using the nonlinear ICU-MM. For the reason of online use in a control scheme the N-LSQ program is solved by means of local optimization. In particular, Nelder-Mead's method is used. Consequently, the optimal model parameters are found to be those that give the best possible representation for true patient behavior during the first 24 hours (i.e., 1440 minutes) given glycemia measurements, input observations, and ICU-MM.13 To solve this problem, the starting parameters are taken from the obese–low glucose tolerance patient group coming from Bergman and co-workers9 (see Table 2) whose patient characteristics are comparable to ICU patients.
Second, the model is reestimated at certain time periods P for the rest of each patient's data set. Two different settings are proposed: reestimations every hour and every 4 hours. The number of recent data considered in each reestimation process is called the back-in-time (BIT) number and may influence the performance of the model. Therefore, BIT is varied in each setting. In the reestimation procedure the same nonlinear estimation technique as described earlier is applied. The starting parameters in each optimization process are the end values of the previous period P. The model performance for each patient p is measured by computing the mean squared error,
and the mean percentage error,
where Gt,p and are the actual and predicted glycemia values for patient p. The size of each data set is denoted as N. The overall methodology for optimizing the reestimation process is explained next.
Estimate the initial model (ICU-MM) based on the first data set (first 24 hours, see earlier discussion).
-
For a reestimation period P = 1 hour and P = 4 hours.
-
For BIT = 20-18-16-14-12-10-8-6-5-4-3-2-1-0.5 hours,
Reestimate the ICU-MM based on every last section (i.e., BIT) of the (moving) data set with the starting set of coefficients the values corresponding to the last period P (or the set of coefficients from the initial model for the first reestimation).
Predict the glycemic course for the next period P (which is the validation set of the reestimated model in this case).
Compute the MSE and MPE for all validation sets per patient.
Compare the MSEs and/or MPEs that are generated for the different BITs. The BIT that belongs to the smallest (average) MSE and/or MPE is called “optimal” and is ideally used in the reestimation process,
-
Compare the optimal BIT and the computed MSEs and MPEs for the P = 1-hour and P = 4-hour settings.
The Wilcoxon signed rank test is used to test significant differences (significance level 5%).
Results
Figures 2 and 3 give an overview of the computed MSEs and MPEs as a function of BIT and P. The prediction performance of the model is higher (i.e., smaller MSEs and MPEs) when the model is reestimated every hour (P = 1 hour) in comparison with model reestimations every 4 hours (p < 0.001). The optimal BIT, with respect to the smallest prediction errors, is found to be 4 hours. Significant differences (p < 0.05) with regard to other selected BITs are marked with asterisks in Figures 2 and 3. The average MSE (SD) and average MPE (SD) obtained when applying this optimal reestimation strategy (P = 1 hour, BIT = 4 hours) to present data are 131.9 mg2/dl2 (99.9 mg2/dl2) and 7.6% (3.1%), respectively. When model reestimations every 4 hours are preferred (P = 4 hours, BIT = 4 hours), the average MSE (SD) and average MPE (SD) are equal to 578.0 mg2/dl2 (1010.3 mg2/dl2) and 14.6% (7.0%), respectively.
Figure 2.
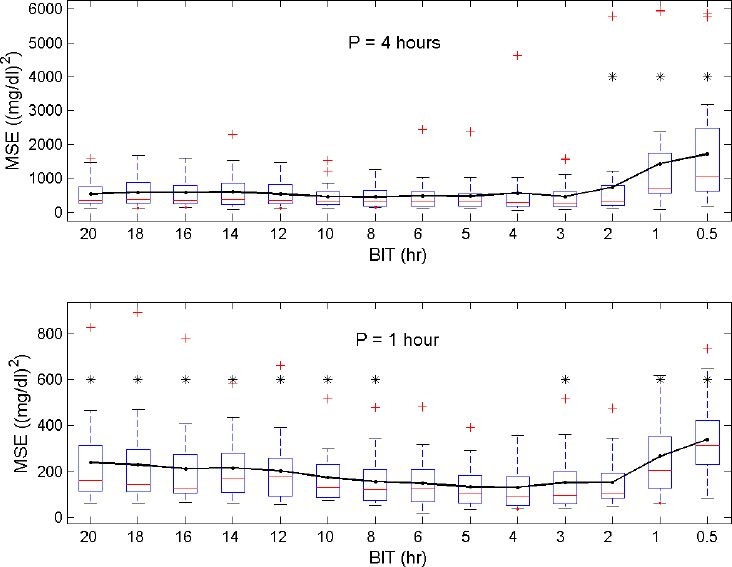
Distribution of the MSEs (generated for each patient) as a function of BIT with reestimations every 4 hours (top) or every hour (bottom). The line connects the averages of the MSEs. In general, reestimations based on the last 4-hour data set (BIT = 4) result in the smallest prediction errors. Significant differences with respect to the BIT = 4 setting are visualized with an asterisk.
Figure 3.
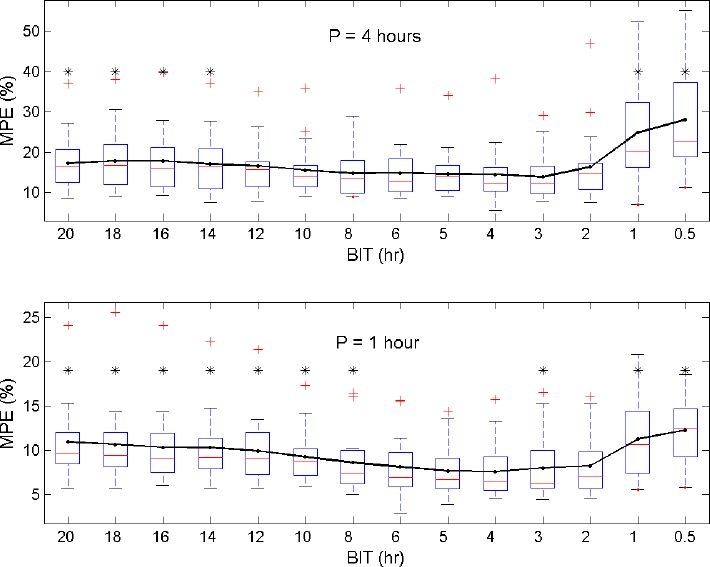
Distribution of the MPEs (generated for each patient) as a function of BIT with reestimations every 4 hours (top) or every hour (bottom). The line connects the averages of the MPEs. Reestimations based on the last 4-hour data set (BIT = 4) give the smallest prediction errors. Significant differences with respect to the BIT = 4 setting are visualized with an asterisk.
Figures 4 and 5 illustrate the performance of the ICU-MM for predicting glycemia of two patients. Glycemic evolution is shown in the top panels. The solid line represents glycemia measured by the GlucoDay system. Data of the first 24 hours are used to estimate the initial model. The simulation of this initial model on the first part of the data set (i.e, in-sample data) is indicated by the dotted line. The reestimation strategy is started after the first 24 hours. Vertical lines in Figures 4 and 5 indicate the instants when the model is reestimated by considering data of the previous 4 hours (BIT = 4 hours). This reestimation process takes place every 4 hours (top panel) or every hour (second panel). The predicted glycemia signal is illustrated by the dashed line. Finally, the input variables included in the ICU-MM are shown in the third (administered insulin) and the last (administered carbohydrate calories) panels in Figures 4 and 5.
Figure 4.
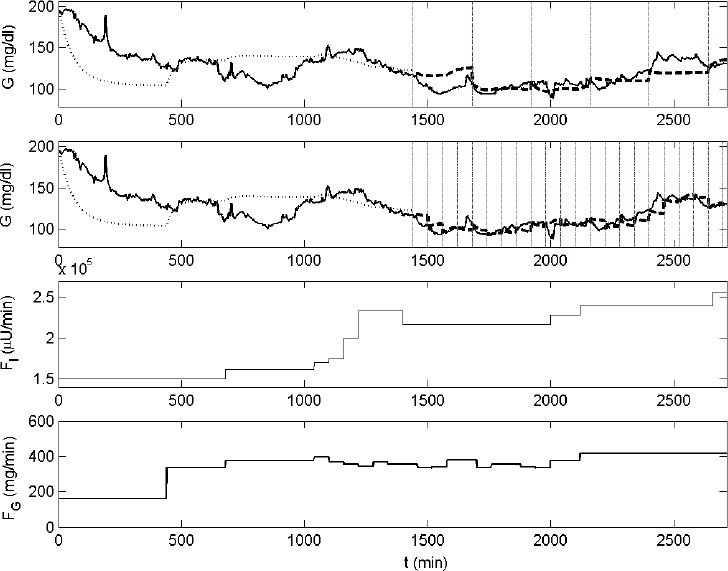
Example of the reestimation strategy applied to the ICU-MM. The evolution of glycemia of patient No. 3, measured with the GlucoDay system, is presented in the first and second panels (solid line). Data of the first 24 hours are used to estimate the initial ICU-MM. The in-sample simulation is represented by the dotted line. Glycemia predictions present in the other part of the data are illustrated with the dashed line for both the 4-hour (top panel) and the 1-hour (second panel) reestimation process. Reestimation time instants are illustrated by vertical lines. The flows of insulin and carbohydrate calories are shown in the third and fourth panels, respectively.
Figure 5.
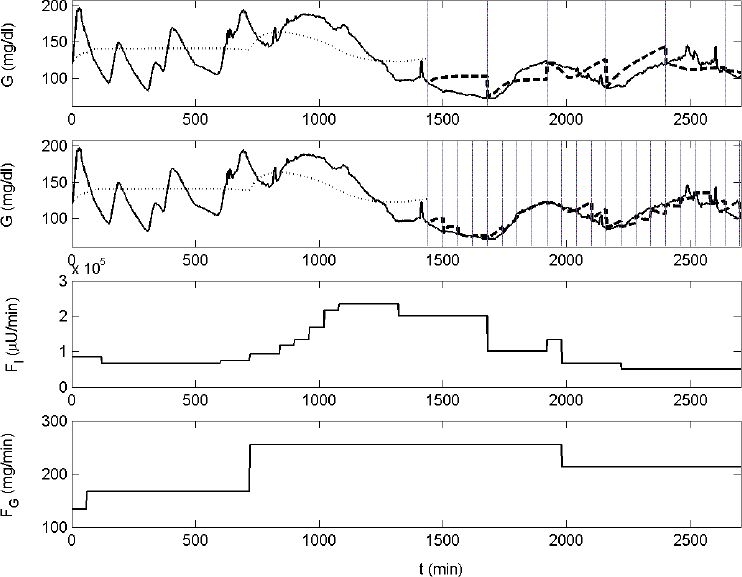
Another example of the reestimation strategy applied to the ICU-MM on patient No. 10. Similar codes as used in in Figure 4 are used.
Discussion
This article presented an optimized adaptive “minimal” modeling approach for predicting glycemia of critically ill patients. Simulations are performed with respect to a real-life surgical ICU data set in which glycemia was near-continuously monitored. This high sampling frequency is assumed to be standard practice in the future.7 For this reason, a test near-continuous sensor device (whose signal was retrospectively calibrated with a reference sensor) was used for this study in order to propose an “optimal” model reestimation technique that may be applied in a future glycemia predictive control system in the ICU.6 In that particular setting, data of the first 24 hours after admission to the ICU will be used to estimate the initial ICU-MM. During this first period, glycemia will be controlled by medical staff using a (manual) nurse-driven protocol3 that is applied as a standard nowadays. From the second day onward, the predictive control system will (semi-)automatically regulate glycemia. A first model-based predictive controller that incorporates the ICU-MM and a (nonoptimal) reestimation strategy has been described.14 In the available literature the use of other glycemia controller strategies (both model and nonmodel based) has already been reported.7,8,15–17 The frequent reestimation of the ICU-MM will incorporate dynamical changes within the critically ill patient (e.g., varying insulin resistance). The feasibility of the reestimation modeling approach is shown in this study.
Reestimating the model every hour results in smaller prediction errors than reestimations that take place every 4 hours. This result is expected, as frequent updates of the model lead to smaller time horizons, meaning smaller simulation periods and, as a usual result, smaller (absolute and relative) prediction errors. As described previously, an appropriate model-based predictive controller is currently under study with the goal of (semi-)automatic glycemia normalization. In a first phase this system will only act as an advisory system (“semi”-automatic). This means that confirmation (by a nurse) of the insulin rate adaptations will be mandatory before administering the insulin flow (that is proposed by the controller) to the patient. Consequently, the workload for the medical staff is expected to increase significantly. For this reason the insulin adaptation frequency will be limited to once per hour.14 This immediately explains why updating the model more frequently than once per hour is futile. Hence, P was only set to 1 and 4 hour(s) in this study. Of course, after a thorough clinical validation of this semi-automatic system, the insulin adaptation frequency may be increased further (e.g., P = 15 min) for use in a fully automatic control system (i.e., confirmation by a nurse is not required any more), which may lead to even smaller prediction errors than obtained when P = 1 hour.
The optimal size of the data set to be considered in each reestimation process of the ICU-MM is found to be 4 hours (although no statistically significant difference exists between the BIT = 4-hour data set size and the BIT = 5- or 6-hour data set size when P = 1 hour). This means that only relatively recent data (set to the previous 4 hours due to the smallest average MSE and average MPE obtained when P = 1 hour) need to be taken into account in each reestimation process for predicting glycemia trends accurately. Figures 2 and 3 clearly illustrate the trade-off between overfitting (small BIT) and the restricted modeling capacity of fast-changing dynamics (large BIT). Indeed, reestimations based on large amounts of previous data (e.g., BIT = 18 hours) do not efficiently capture the varying patient dynamics typical of critically ill patients. However, only considering the most recent data of the specific patient (e.g., BIT = 1 hour) leads to model overfitting and explains the poor prediction performance in that case.
When the ICU-MM is reestimated every hour and every 4 hours (based on the previous 4 hours of data, BIT = 4 hours), the average MPE is equal to 7.6 and 14.6%, respectively. These relative prediction errors are clinically acceptable after comparing model prediction behavior with sensor measurement behavior. Indeed, the accuracy requirements of a test sensor device, which is assessed by considering its signal toward the concomitantly measured reference (or “gold” standard) values, are comparable to the prediction performance requirements of a model. Both sensor and model are crucial elements in (future) predictive control systems in terms of determining the optimal insulin flow to be administered to the patient. The International Organization for Standardization criterion, which is a standard criterion for the binary assessment of the accuracy of glucose sensors, is typically used in the evaluation of test sensor devices.18 In this criterion the target variability of the test sensor device (with respect to the reference sensor) is defined as ±20% for reference values >75 mg/dl. For reference values ≤75 mg/dl, the test sensor measurements are required to fall within ±15 mg/dl limits. The relative prediction errors obtained when reestimating the ICU-MM every hour and every 4 hours are smaller than the aforementioned 20% target variability, indicating clinical acceptance for both approaches (assuming the availability of an accurate near-continuous glucose sensor device).
Figures 4 and 5 show the predicted glycemia signal of patients 3 and 10. The individual MPEs for these “average” patients are equal to 5.0 and 6.4%, respectively, when P = 1 hour and 8.5 and 14.9%, respectively, when P = 4 hours. The ICU-MM approaches the real glucose dynamics of critically ill patients. Although only two input variables (i.e., the flow of carbohydrate calories and insulin) are effectively taken into consideration, the ICU-MM generally succeeds in predicting glycemia trends for both P = 1 hour and P = 4 hours. The rather flat glycemia dynamics that appear in some segments in Figures 4 and 5 are caused directly by the corresponding flat input behavior (e.g., Figure 4 top panel; starting at t = 2120 min the fluctuating glycemia signal is not predicted accurately by the ICU-MM, as its input variables, which play a significant role in predicting the glycemia behavior, have a constant flow). Updating the model frequently (every hour) is advised to compensate for these unavoidable missing glycemia dynamics.
A final feature of the proposed model reestimation strategy is the limited computation time. The current study is (off-line) implemented in Matlab® on Microsoft Windows XP (Intel Pentium, 1400-MHz processor). The N-LSQ program requires only approximately 1 minute to be solved. Accordingly, the online application of this technique is no issue in terms of computation time.
In conclusion, implementation of the ICU-MM that is reestimated every 4 hours or (preferably) every hour gives promising results in terms of prediction performance and indicates its potential use in a predictive control system for critically ill patients admitted to the surgical ICU.
Acknowledgements
The authors thank the nursing staff of the intensive care unit (K.U.Leuven) for data sampling, and Pieter Wouters for data acquisition.
Abbreviations
- BIT
back-in-time
- ICU
intensive care unit
- ICU-MM
intensive care unit–minimal model
- IVGTT
intravenous glucose tolerance test
- MPE
mean percentage error
- MSE
mean squared error
- N-LSQ
nonlinear least squares
References
- 1.Van den Berghe G, Wouters P, Weekers F, Verwaest C, Bruyninckx F, Schetz M. Intensive insulin therapy in the critically ill patients. N Engl J Med. 2001 Nov 8;345(19):1359–1367. doi: 10.1056/NEJMoa011300. [DOI] [PubMed] [Google Scholar]
- 2.Van den Berghe G, Wilmer A, Hermans G, Meersseman W, Wouters PJ, Milants I, Van Wijngaerden E, Bobbaers H, Bouillon R. Intensive insulin therapy in the medical ICU. N Engl J Med. 2006 Feb 2;354(5):449–461. doi: 10.1056/NEJMoa052521. [DOI] [PubMed] [Google Scholar]
- 3.Van den Berghe G, Wouters P, Bouillon R, Weekers F, Verwaest C, Schetz M, Vlasselaers D, Ferdinande P, Lauwers P. Outcome benefit of intensive insulin therapy in the critically ill: Insulin dose versus glycemic control. Crit Care Med. 2003 Feb;31(2):359–366. doi: 10.1097/01.CCM.0000045568.12881.10. [DOI] [PubMed] [Google Scholar]
- 4.Parker RS, Doyle FJ, 3rd, Peppa NA. A model-based algorithm for blood glucose control in type I diabetic patients. IEEE Trans Biomed Eng. 1999 Feb;46(2):148–157. doi: 10.1109/10.740877. [DOI] [PubMed] [Google Scholar]
- 5.Hovorka R, Canonico V, Chassin LJ, Haueter U, Massi-Benedetti M, Orsini Federici M, Pieber TR, Schaller HC, Schaupp L, Vering T, Wilinska ME. Nonlinear model predictive control of glucose concentration in subjects with type 1 diabetes. Physiol Meas. 2004 Aug;25(4):905–920. doi: 10.1088/0967-3334/25/4/010. [DOI] [PubMed] [Google Scholar]
- 6.Van Herpe T, Espinoza M, Pluymers B, Goethals I, Wouters P, Van den Berghe G, De Moor B. An adaptive input-output modeling approach for predicting the glycemia of critically ill patients. Physiol Meas. 2006 Nov;27(11):1057–1069. doi: 10.1088/0967-3334/27/11/001. [DOI] [PubMed] [Google Scholar]
- 7.Chase J, Shaw G, Wong X, Lotz T, Lin J, Hann C. Model-based glycaemic control in critical care: A review of the state of the possible. Biomed Signal Process Control. 2006;(1):3–21. [Google Scholar]
- 8.Hovorka R. Continuous glucose monitoring and closed-loop systems. Diabet Med. 2006 Jan;23(1):1–12. doi: 10.1111/j.1464-5491.2005.01672.x. [DOI] [PubMed] [Google Scholar]
- 9.Bergman RN, Phillips LS, Cobelli C. Physiologic evaluation of factors controlling glucose tolerance in man: measurement of insulin sensitivity and beta-cell glucose sensitivity from the response to intravenous glucose. J Clin Invest. 1981 Dec;68(6):1456–1467. doi: 10.1172/JCI110398. [DOI] [PMC free article] [PubMed] [Google Scholar]
- 10.Fisher ME. A semiclosed-loop algorithm for the control of blood glucose levels in diabetics. IEEE Trans Biomed Eng. 1991 Jan;38(1):57–61. doi: 10.1109/10.68209. [DOI] [PubMed] [Google Scholar]
- 11.Bergman RN, Ider YZ, Bowden CR, Cobelli C. Quantitative estimation of insulin sensitivity. Am J Physiol. 1979 Jun;236(6):E667–77. doi: 10.1152/ajpendo.1979.236.6.E667. [DOI] [PubMed] [Google Scholar]
- 12.Toffolo G, Bergman RN, Finegood DT, Bowden CR, Cobelli C. Quantitative estimation of beta cell sensitivity to glucose in the intact organism: a minimal model of insulin kinetics in the dog. Diabetes. 1980 Dec;29(12):979–990. doi: 10.2337/diab.29.12.979. [DOI] [PubMed] [Google Scholar]
- 13.Van Herpe T, Pluymers B, Espinoza M, Van den Berghe G, De Moor B. A minimal model for glycemia control in critically ill patients. Proceedings of the 28th IEEE EMBS Annual International Conference; 2006. pp. 5432–5435. [DOI] [PubMed] [Google Scholar]
- 14.Van Herpe T, Haverbeke N, Pluymers B, Van den Berghe G, De Moor B. The application of model predictive control to normalize glycemia of critically ill patients. Accepted for publication in Proc of the 9th European Control Conference.2007. [Google Scholar]
- 15.Vogelzang M, Zijlstra F, Nijsten MWN. Design and implementation of GRIP: a computerized glucose control system at a surgical intensive care unit. BMC Med Inform Decis Mak. 2005;5:38. doi: 10.1186/1472-6947-5-38. [DOI] [PMC free article] [PubMed] [Google Scholar]
- 16.Chee F, Fernando TL, Savkin AV, van Heeden V. Expert PID control system for blood glucose control in critically ill patients. IEEE Trans Inf Technol Biomed. 2003 Dec;7(4):419–425. doi: 10.1109/titb.2003.821326. [DOI] [PubMed] [Google Scholar]
- 17.Hovorka R, Chassin LJ, Wilinska ME, Canonico V, Akwi JA, Federici MO, Massi-Benedetti M, Hutzli I, Zaugg C, Kaufmann H, Both M, Vering T, Schaller HC, Schaupp L, Bodenlenz M, Pieber TR. Closing the loop: the adicol experience. Diabetes Technol Ther. 2004 Jun;6(3):307–318. doi: 10.1089/152091504774197990. [DOI] [PubMed] [Google Scholar]
- 18.International Organisation for Standardization: ISO 15197. Geneva: International Organisation for Standardization; 2003. In vitro diagnostic test systems: requirements for blood-glucose monitoring systems for self-testing in managing diabetes mellitus. [Google Scholar]


