Abstract
Background
A simulation model of the glucose–insulin system in normal life conditions can be very useful in diabetes research, e.g., testing insulin infusion algorithms and decision support systems and assessing glucose sensor performance and patient and student training. A new meal simulation model has been proposed that incorporates state-of-the-art quantitative knowledge on glucose metabolism and its control by insulin at both organ/tissue and whole-body levels. This article presents the interactive simulation software GIM (glucose insulin model), which implements this model.
Methods
The model is implemented in MATLAB, version 7.0.1, and is designed with a windows interface that allows the user to easily simulate a 24-hour daily life of a normal, type 2, or type 1 diabetic subject. A Simulink version is also available. Three meals a day are considered. Both open- and closed-loop controls are available for simulating a type 1 diabetic subject.
Results
Software options are described in detail. Case studies are presented to illustrate the potential of the software, e.g., compare a normal subject vs an insulin-resistant subject or open-loop vs closed-loop insulin infusion in type 1 diabetes treatment.
Conclusions
User-friendly software that implements a state-of-the-art physiological model of the glucose–insulin system during a meal has been presented. The GIM graphical interface makes its use extremely easy for investigators without specific expertise in modeling.
Keywords: artificial pancreas, diabetes, glucose homeostasis, glucose sensors, insulin infusion system, modeling, physiological control
Introduction
The ability to simulate the glucose–insulin system in normal life conditions can be very useful in diabetes research. Several simulation models have been proposed in the literature that proved to be useful in tackling various aspects of pathophysiology of diabetes.1–11 Recently, a new meal simulation model has been proposed.12 The novelty and strength of this model are that it is based on virtually model-independent measurements of the various glucose and insulin fluxes occurring during a meal.13,14 In fact, the system is very complex, and only the availability of glucose and insulin fluxes, in addition to their plasma concentrations, has allowed us to minimize structural uncertainties in modeling the various processes. The model consists of 12 nonlinear differential equations, 18 algebraic equations, and 35 parameters. User-friendly simulation software of this model would be of great help, especially for investigators without specific expertise in modeling.
The aim of this article is to present the interactive software GIM (glucose insulin model), implemented in MATLAB version 7.0.1, which allows one to simulate both normal and pathological conditions, e.g., type 2 diabetes and open- and closed-loop insulin infusions in type 1 diabetes. Case studies are only presented to illustrate the potential of the software and do not attempt to address pathophysiological questions or to assess the quality of glucose control by different strategies.
The Model
Normal Subject
The model describing the glucose–insulin control system during a meal is shown in Figure 1. This section provides a brief overview of the model while the article by Dalla Man and colleagues12 should be consulted for a detailed description.
Figure 1.
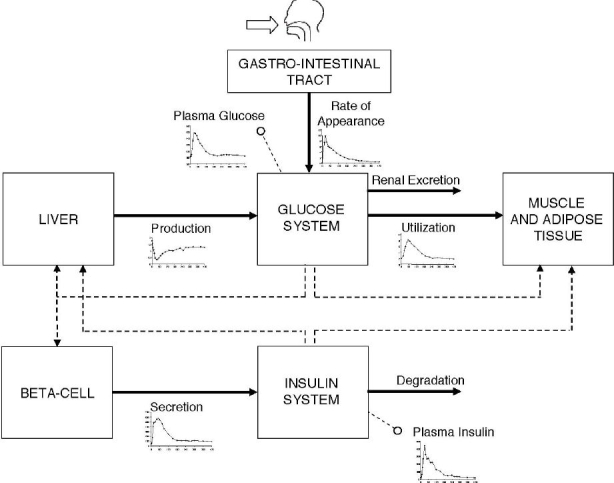
Scheme of the glucose–insulin control system. Continuous lines denote fluxes of material and dashed lines control signals. In addition to plasma glucose and insulin concentration measurements, glucose fluxes (i.e., meal rate of appearance, production, utilization, and renal extraction) and insulin fluxes (i.e., secretion and degradation) are also shown (see text).
The model is made up of a glucose and insulin subsystem linked by the control of glucose on insulin secretion and by insulin on glucose utilization and endogenous production. The glucose subsystem consists of a two-compartment model of glucose kinetics: insulin-independent utilization occurs in the first compartment, representing plasma and fast equilibrating tissue, while insulin-dependent utilization occurs in a remote compartment, representing peripheral tissues. The insulin subsystem also consists of two compartments, the first representing the liver and the second the plasma. The most important model unit processes are endogenous glucose production, glucose rate of appearance, glucose utilization, and insulin secretion. Suppression of endogenous glucose production is assumed to be linearly dependent on plasma glucose concentration, portal insulin concentration, and a delayed insulin signal. Key parameters are hepatic glucose effectiveness (glucose control on endogenous glucose production suppression) and hepatic insulin sensitivity (insulin control on endogenous glucose production suppression). Glucose intestinal absorption describes the glucose transit through the stomach and intestine by assuming that the stomach is represented by two compartments (one for solid and one for triturated phases), while a single compartment is used to describe the gut; the rate constant of gastric emptying is a nonlinear function of the amount of glucose in the stomach. Glucose utilization during a meal (both insulin independent and dependent) is made up of two components. Insulin-independent utilization in the brain and erythrocytes takes place in the first compartment and is constant, whereas insulin-dependent utilization in muscle and adipose tissue takes place in the remote compartment and depends nonlinearly (Michaelis–Menten) from glucose in the tissues. Beta-cell insulin secretion is described by dynamic and static components. The dynamic component likely represents the release of promptly releasable insulin and is proportional to the rate of increase of glucose concentration through a parameter called dynamic beta-cell responsivity. The static component describes the provision of new insulin to the releasable pool and is proportional to a delayed glucose signal through a parameter called static beta-cell responsivity. All model parameters and GIM values are reported in the article by Dalla Man and co-workers.12
Type 2 Diabetes
This model is described in detail elsewhere.12 Briefly, some derangements of the beta-cell response to glucose, as well as of insulin action on glucose utilization, have been modeled. All GIM parameter values are reported in the article by Dalla Man and colleagues.12
Type 1 Diabetes
In order to simulate a type 1 diabetic subject the insulin secretion module is substituted by a subcutaneous insulin infusion module. In order to account for the higher (vs normal) basal glucose, e.g., 180 mg/dl, the software introduces a higher endogenous glucose production, e.g., 2.4 mg/kg/min (as a result, plasma glucose clearance is lower than normal, e.g., 0.013 dl/kg/min). Because the simulated subject is assumed in good control, all the other parameters are kept at values of the normal subject.15–17
Several models of subcutaneous insulin kinetics have been published.18–20 GIM implements a variation of a model described in Nucci and Cobelli18 (Dr. A. Vølund, private communication):
| (1) |
where Isc1 is the amount of nonmonomeric insulin in the subcutaneous space, Isc2 is the amount of monomeric insulin in the subcutaneous space, IIR(t) (pmol/kg/min) is the exogenous insulin infusion rate, kd (min−) is the rate constant of insulin dissociation, and ka1 and ka2 are the rate constants of nonmonomeric and monomeric insulin absorption, respectively (see Table 1).
Table 1.
Parameters of Subcutaneous Insulin Kinetics, Glucose Sensor Delay, and PID Controller
| Control | Parameter | Value | Unit |
|---|---|---|---|
| Subcutaneous insulin kinetics | kd | 0.0164 | min− |
| ka1 | 0.0018 | min− | |
| ka2 | 0.0182 | min− | |
| Glucose sensor delay | Td | 10 | min |
| PID controller | Kp | 0.032 | pmol/kg/min per mg/dl |
| TD | 66 | min | |
| TI | 450 | min | |
The rate of appearance of insulin in plasma (Ri) is thus
| (2) |
Various closed-loop control strategies are available in the literature (for a recent review, see Bequette21). Here the simple proportional-integral-derivative (PID) controller proposed in Steil and colleagues20 to deliver insulin is implemented as an example. As described in Steil et al.20 the PID parameters are assumed to be fixed. The insulin infusion rate (pmol/kg/min) is
| (3) |
with
| (4) |
| (5) |
| (6) |
where Gtar is the glucose target and Gs(t) is the sensor signal described by
| (7) |
where Ts (min) is the physiological delay of the sensor, Kp (pmol/kg/min per mg/dl) is the rate of insulin infusion in response to glucose above basal, TI (min) is the ratio between proportional and integral release, and TD (min) is the ratio of derivative to proportional release.
Parameter values of the subcutaneous insulin kinetics model, glucose sensor delay, and PID controller20 are shown in Table 1.
An open-loop control strategy is also possible using the model of subcutaneous insulin kinetics described in Equations (1) and (2) where
| (8) |
where Nmeal is the number of meals, tj is the time of meal occurrence, Dinsj is the exogenous insulin dose injected subcutaneously at tj, and IIRb is the basal insulin infusion rate.
Finally, it is worth noting that some steady-state constraints in the type1 diabetes model are different than those used in the normal (we refer to Dalla Man et al.12 for symbol definition). In particular, parameter kp1 of glucose production becomes
| (9) |
as there is no portal insulin signal; the amount of insulin in the liver compartment at basal state is
| (10) |
with Ipb the amount of insulin in plasma at basal steady state and Ipb settable by the user in closed loop while it depends from the IIRb in open loop:
| (11) |
Similarly, the basal value of insulin in the subcutaneous compartments, Isc1ss and Isc2ss, depends from Ipb in closed loop and from the IIRb in open loop:
| (12) |
| 13 |
GIM Software
MATLAB Version
The model described in this article has been implemented in MATLAB, version 7.0.1.
When GIM is run, a dialog box opens and asks the user to select the status of the subject. Three possible options are available: Normal, Type 2 Diabetic, or Type 1 Diabetic subject (Figure 2).
Figure 2.
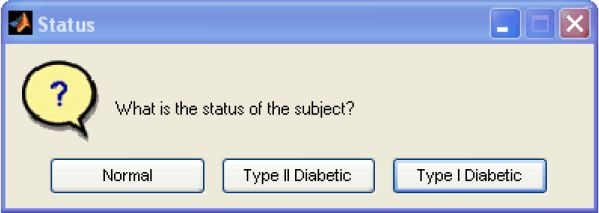
The dialog box allows the user to select the status of the subject: Normal, Type 2 Diabetic, or Type 1 Diabetic.
When the user clicks on Normal or Type 2 Diabetic an interactive window appears (Figure 3). The window is divided into three sections.
Basal, where basal values of glucose concentration, insulin concentration, and glucose production are set. By clicking on the button CALCULATE, the basal glucose clearance rate is calculated and displayed in the proper square.
Subject, where the values of body weight and main metabolic indices, such as peripheral and hepatic insulin sensitivity(Vmax and kp3 in model,12 respectively), dynamic, and static beta-cell responsivity to glucose (K and β in model,12 respectively), are entered as a percentage of the normal values12; for type 2 diabetic subjects, typical derangements are initially displayed.
Protocol, where the time of the three meals and the amount of glucose ingested are set.
Figure 3.
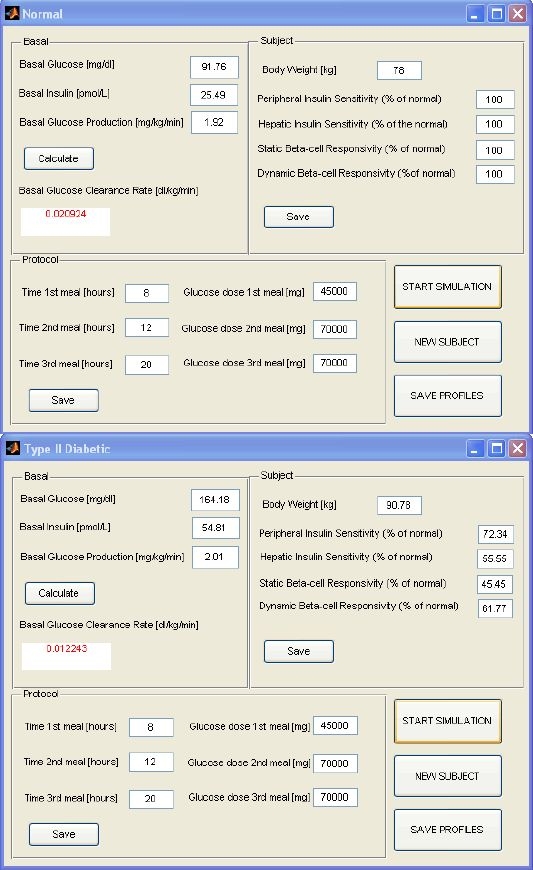
Normal (top) and Type 2 Diabetic (bottom) windows. Each window is divided into three sections that allow the user to set basal values of glucose concentration, insulin concentration, and glucose production (glucose clearance is calculated and displayed in the proper square); to enter values of body weight and main metabolic indices, such as peripheral and hepatic insulin sensitivity, static, and dynamic beta-cell responsivity to glucose (as percentage of normal values); and to define the time of the three meals and the amount of glucose ingested. The window also shows buttons to start simulation, save the simulated profiles, or run a new subject.
Once all the fields are set and new values are saved, the simulation starts by clicking on START SIMULATION. Simulation results are presented in a graphic format, i.e., a figure is displayed that shows glucose and insulin concentrations, glucose production, glucose utilization, meal rate of appearance, and insulin secretion(an example is shown in Figure 4 and is discussed further in the next section).
Figure 4.
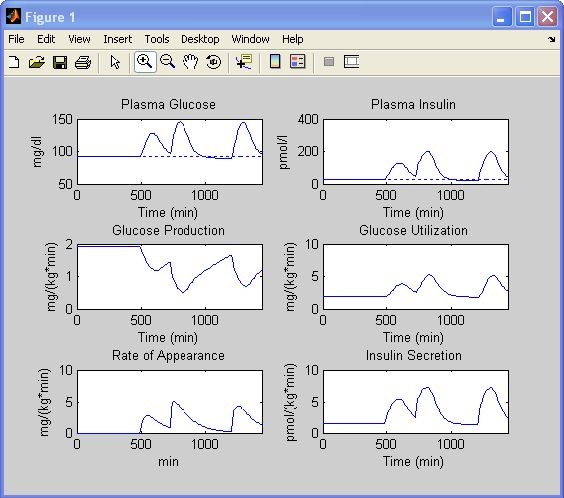
Simulation results of a normal subject. Glucose and insulin concentrations, glucose production, glucose utilization, meal rate of appearance, and insulin secretion rate are obtained with settings of Figure 3 (top).
The program also allows the user to save the aforementioned profiles in a .mat file by clicking the button SAVE PROFILES. The interactive window shown in Figure 5 allows naming the .mat file and placing it in the desired folder. To run a new subject one has simply to click the button NEW SUBJECT.
Figure 5.
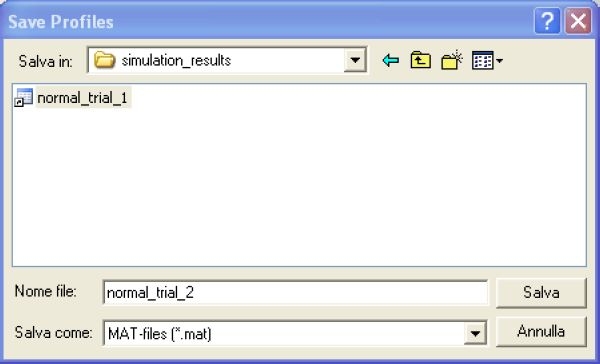
The Save Profiles window allows one to name the .mat file containing the saved solutions and to place it in the desired folder.
If the user selects Type 1 Diabetic the interactive windows is a bit different (Figure 6): four sections are displayed.
Basal, which is the same as that described earlier.
Subject, where the values of body weight and only peripheral and hepatic insulin sensitivity are entered as a percentage of normal values.
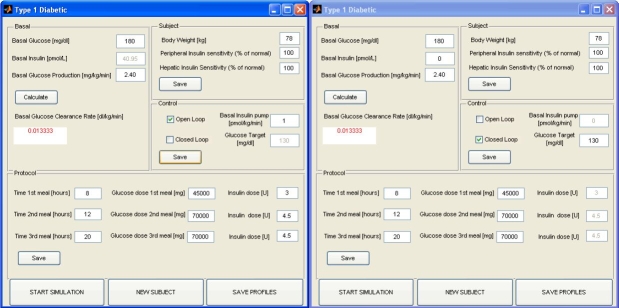
Control, which allows the user to select if the subject is controlled in open loop (Figure 6, left) or in closed loop with a PID controller (Figure 6, right). If open loop is selected, the basal insulin infusion rate can be entered [basal insulin concentration is set by (Equation 11)]. If closed loop is selected, the basal insulin concentration can be chosen by the user, which also has to define a glucose target value.
Protocol, which is the same as that described earlier with the addition that if open loop is selected, one enters the insulin dose injected before each meal.
Figure 6.
The Type1 Diabetic window is divided into four sections that allow the user to set basal values of glucose concentration, insulin concentration, and glucose production (glucose clearance is calculated and displayed in the proper square); to enter values of body weight and main metabolic indices, such as peripheral and hepatic insulin sensitivity (as percentage of normal values); to select if the subject is controlled in a open (left) or closed loop with a PID controller (right); and to define the time of the three meals, the amount of glucose ingested, and, in case of open-loop control, the insulin dose injected before each meal. The window also shows buttons to start simulation, save the simulated profiles, or run a new subject.
The program provides default values, which are displayed initially.
Simulink Version
The model was also implemented in Simulink to allow control-oriented investigators to test their closed-loop algorithms easily.
Software
Both Windows and Simulink versions of the software are available by request for academic institutions from the corresponding author.
Case Studies
Three case studies illustrating the potential of the software are now presented.
Normal Subject vs Insulin-Resistant Subject
The goal of this case study is to illustrate the key role of insulin sensitivity in glucose regulation. A normal subject is simulated first. Let us use the default setting of a normal subject (Figure 3, top): a basal glucose concentration of 91.76 mg/dl; a basal insulin concentration of 25.49 pmol/liter; a basal glucose production of 1.92 mg/kg/min; a body weight of 78 kg; and peripheral insulin sensitivity, hepatic insulin sensitivity, static beta-cell responsivity, and dynamic beta-cell responsivity equal to 100% of the normal; 45 g of glucose is ingested at 8 a.m., 70 g at noon, and 70 g at 8 p.m. The simulation results are shown in Figure 4. After the breakfast glucose concentration peaks at around 130 mg/dl, it is still over basal at lunch time. The glucose concentration increases after lunch until around 160 mg/dl and comes back to basal 4 hours later. After dinner the peak is a bit lower than after lunch. These profiles are saved as explained in the previous paragraph. Now, we maintain all settings except for peripheral and hepatic insulin sensitivity, which are set to 30% of the normal. The program asks which .mat file should be used for comparison. By choosing the one just saved, the profiles will be automatically displayed (Figure 7, red line) superimposed onto the previous ones (Figure 7, blue line). As expected, the glucose concentration is now higher during all meals. Both insulin concentration and secretion rate are higher due to the fact that beta-cell responsivity to glucose is “normal” but the glucose concentration is higher. Glucose utilization is lower, whereas glucose production is more suppressed because of both a higher glucose concentration and a delayed (more than on glucose utilization) insulin action on glucose production.
Figure 7.
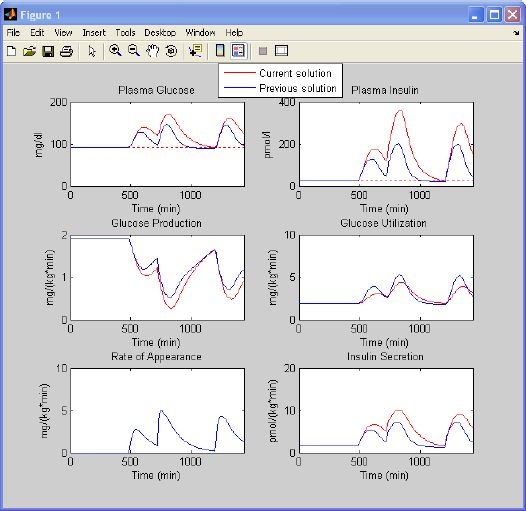
Simulation results of a normal subject vs an insulin-resistant subject. Glucose and insulin concentrations, glucose production, glucose utilization, meal rate of appearance, and insulin secretion rate obtained with settings of Figure 3 (top)(blue line) are superimposed on those obtained with the same setting but 70% lower insulin sensitivity indices (red line).
Open-Loop Controlled Type 1 Diabetic Subject
Let us choose the type 1 diabetic window and use the default settings suggested by the program (Figure 6, left) and assume that the basal insulin infusion rate is 1 pmol/kg/min. The protocol is 45 g of glucose ingested at 8 a.m. with 3 U of insulin injected, 70 g at noon with 4.5 U of insulin, and 70 g at 8 p.m. with 4.5 U of insulin. The simulation results are shown in Figure 8 (blue line). One can also predict what happens if the patient forgets to inject insulin before lunch. The program displays the new simulated profiles (Figure 8, red line) against the previous ones (Figure 8, blue line).
Figure 8.
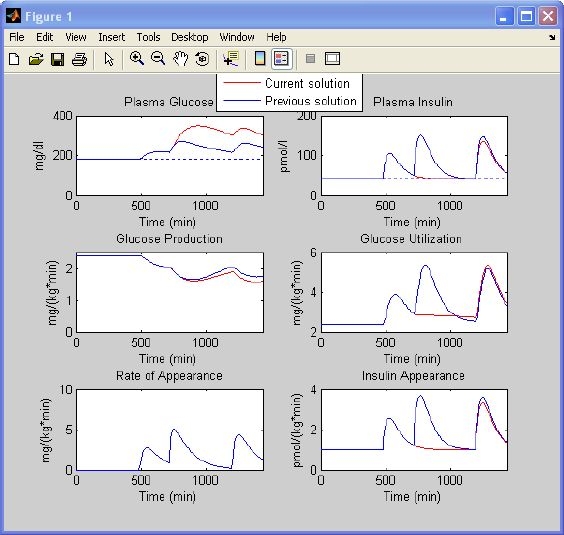
Simulation results of a type 1 diabetic subject controlled in an open loop. Glucose and insulin concentrations, glucose production, glucose utilization, meal rate of appearance, and insulin appearance obtained with settings of Figure 6 (left) (blue line) are superimposed on those obtained in the same subject who forgot to inject insulin before lunch (red line).
Closed-Loop Controlled Type 1 Diabetic Subject
Let us choose the type 1 diabetic window and use the default settings suggested by the program (Figure 6, right) with the glucose target equal to 130 mg/dl; the protocol is 45 g of glucose ingested at 8 a.m., 70 g at noon, and 70 g at 8 p.m. The simulation results are shown in Figure 9.
Figure 9.
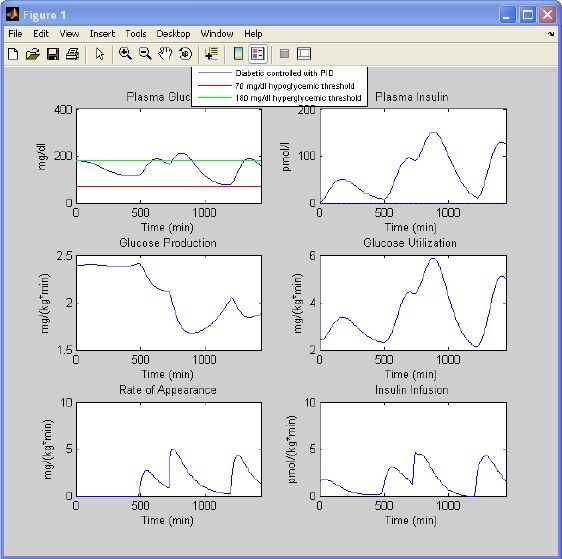
Simulation results of a type 1 diabetic subject controlled in a closed loop with a PID controller. Glucose and insulin concentrations, glucose production, glucose utilization, meal rate of appearance, and insulin infusion are obtained with settings of Figure 6 (right). Hypoglycemia (red) and hyperglycemia (green line) thresholds are also displayed.
Conclusions
The ability to simulate the glucose–insulin system in normal life conditions can be very useful for studying the pathophysiology of diabetes. A new model has been presented that incorporates state- of-the-art physiological knowledge gained at organ/tissue levels.12 This article presented interactive simulation software, GIM, which implements the aforementioned model. Thanks to its windows interface, its use is extremely easy for investigators without specific expertise in modeling.
Acknowledgements
The authors thank Dr. Adrian Vella and Dr. Aage Vølund for helpful discussions on type 1 diabetic subject simulation and subcutaneous insulin absorption models.
Abbreviations
- PID
proportional-integral-derivative
References
- 1.Srinivasan R, Kadish AH, Sridhar R. A mathematical model for the control mechanism of free fatty acid-glucose metabolism in normal humans. Comput Biomed Res. 1970 Apr;3(2):146–165. doi: 10.1016/0010-4809(70)90021-2. [DOI] [PubMed] [Google Scholar]
- 2.Foster RO, Soeldner JS, Tan MH, Guyton JR. Short term glucose homeostasis in man: a system dynamic model. Trans ASME. 1973:308–314. [Google Scholar]
- 3.Cobelli C, Federspil G, Pacini G, Salvan A, Scandellari C. An integrated mathematical model of the dynamics of blood glucose and its hormonal control. Math Biosci. 1982;58:27–60. [Google Scholar]
- 4.Cobelli C, Mari A. Validation of mathematical models of complex endocrine-metabolic systems: a case study on a model of glucose regulation. Med Biol Eng Comput. 1983;21:390–399. doi: 10.1007/BF02442625. [DOI] [PubMed] [Google Scholar]
- 5.Cobelli C, Ruggeri A. Evaluation of portal/peripheral route and of algorithms for insulin delivery in the closed-loop control of glucose in diabetes. A modeling study. 1983;30:93–103. doi: 10.1109/tbme.1983.325203. IEEE Trans Biomed Eng. [DOI] [PubMed] [Google Scholar]
- 6.Salzsieder E, Albrecht G, Fischer U, Freys EJ. Kinetic modeling of the glucoregulatory system to improve insulin therapy. IEEE Trans Biomed Eng. 1985;32:846–855. doi: 10.1109/TBME.1985.325500. [DOI] [PubMed] [Google Scholar]
- 7.Sorensen JT. A physiologic model of glucose metabolism in man and its use to design and assess improved insulin therapies for diabetes [Ph.D. thesis] Massachusetts Institute of Technology, Department of Chemical Engineering; 1985. [Google Scholar]
- 8.Lehmann ED, Deutsch T. A physiological model of glucose-insulin interaction in type 1 diabetes mellitus. J Biomed Eng. 1992;14:235–242. doi: 10.1016/0141-5425(92)90058-s. [DOI] [PubMed] [Google Scholar]
- 9.Andreassen S, Benn JJ, Hovorka R, Olesen KG, Carson ER. A probabilistic approach to glucose prediction and insulin dose adjustment: description of metabolic model and pilot evaluation study. Comput Methods Programs Biomed. 1994;41:153–165. doi: 10.1016/0169-2607(94)90052-3. [DOI] [PubMed] [Google Scholar]
- 10.Vicini P, Caumo A, Cobelli C. Glucose effectiveness and insulin sensitivity from the minimal models: consequence of undermodeling assessed by Monte Carlo simulation. IEEE Trans Biomed Eng. 1999;46:130–137. doi: 10.1109/10.740875. [DOI] [PubMed] [Google Scholar]
- 11.Hovorka R, Canonico V, Chassin LJ, Haueter U, Massi-Benedetti M, Orsini Federici M, Pieber TR, Schaller HC, Schaupp L, Vering T, Wilinska ME. Nonlinear model predictive control of glucose concentration in subjects with type 1 diabetes. Physiol Meas. 2004 Aug;25(4):905–920. doi: 10.1088/0967-3334/25/4/010. [DOI] [PubMed] [Google Scholar]
- 12.Dalla Man C, Rizza RA, Cobelli C. Meal simulation model of the glucose-insulin system. IEEE Trans Biomed Eng. 2007 doi: 10.1109/TBME.2007.893506. In press. [DOI] [PubMed] [Google Scholar]
- 13.Basu R, Di Camillo B, Toffolo G, Basu A, Shah P, Vella A, Rizza R, Cobelli C. Use of a novel triple tracer approach to assess postprandial glucose metabolism. Am J Physiol Endocrinol Metab. 2003 Jan;284(1):E55–69. doi: 10.1152/ajpendo.00190.2001. [DOI] [PubMed] [Google Scholar]
- 14.Basu R, Dalla Man C, Campioni M, Basu A, Klee G, Toffolo G, Cobelli C, Rizza RA. Effects of age and sex on postprandial glucose metabolism: differences in glucose turnover, insulin secretion, insulin action, and hepatic insulin extraction. Diabetes. 2006 Jul;55(7):2001–2014. doi: 10.2337/db05-1692. [DOI] [PubMed] [Google Scholar]
- 15.Yki-Jarvinen H, Koivisto VA. Continuous subcutaneous insulin infusion therapy decreases insulin resistance in type 1 diabetes. J Clin Endocrinol Metab. 1984 Apr;58(4):659–666. doi: 10.1210/jcem-58-4-659. [DOI] [PubMed] [Google Scholar]
- 16.Lager I, Lonnroth P, Von Schenck H, Smith U. Reversal of insulin resistance in type I diabetes after treatment with continuous subcutaneous insulin infusion. Br Med J (Clin Res Ed) 1983 Dec 3;287(6406):1661–1664. doi: 10.1136/bmj.287.6406.1661. [DOI] [PMC free article] [PubMed] [Google Scholar]
- 17.Vella A, Shah P, Basu R, Basu A, Camilleri M, Schwenk WF, Rizza RA. Type I diabetes mellitus does not alter initial splanchnic glucose extraction or hepatic UDP-glucose flux during enteral glucose administration. Diabetologia. 2001 Jun;44(6):729–737. doi: 10.1007/s001250051682. [DOI] [PubMed] [Google Scholar]
- 18.Nucci G, Cobelli C. Models of subcutaneous insulin kinetics. A critical review. Comput Methods Programs Biomed. 2000 Jul;62(3):249–257. doi: 10.1016/s0169-2607(00)00071-7. [DOI] [PubMed] [Google Scholar]
- 19.Wilinska ME, Chassin LJ, Schaller HC, Schaupp L, Pieber TR, Hovorka R. Insulin kinetics in type-I diabetes: continuous and bolus delivery of rapid acting insulin. IEEE Trans Biomed Eng. 2005 Jan;52(1):3–12. doi: 10.1109/TBME.2004.839639. [DOI] [PubMed] [Google Scholar]
- 20.Steil GM, Rebrin K, Darwin C, Hariri F, Saad MF. Feasibility of automating insulin delivery for the treatment of type 1 diabetes. Diabetes. 2006 Dec;55(12):3344–3350. doi: 10.2337/db06-0419. [DOI] [PubMed] [Google Scholar]
- 21.Bequette BW. A critical assessment of algorithms and challenges in the development of a closed-loop artificial pancreas. Diabetes Technol Ther. 2005 Feb;7(1):28–47. doi: 10.1089/dia.2005.7.28. [DOI] [PubMed] [Google Scholar]


