

Abstract
Background
Current basal insulin dosing recommendations are based on retrospective studies of Type 1 patients with diabetes in whom the glucose control was not intensely established. Using continuous glucose monitoring (CGM) we prospectively studied these recommendations in patients treated with continuous subcutaneous insulin infusion.
Methods
With CGM 30 subjects were titrated with daily insulin adjustments to achieve a basal glucose targets of <5% of values <70 mg/dl and <20%, >170mg/dl. The basal rate during meal time was studied by a sequential daily single meal omission until the glucose goals were achieved.
Results
Glucose targets were achieved in all subjects. The observed ratios of total basal dose (TBD) to total daily dose and TBD to weight, in kilograms, were 0.384 and 0.185, respectively. Previously reported formulas for estimating the TBD resulted in significantly higher values than we observed. The difference between the maximum to the minimum hourly basal insulin infusion rate was more than 100% and the peak rate was reached by 0200 hours in 73% of subjects. During the post study observation period in which there was no further study intervention and in those subjects with baseline A1C >6.9%, the A1C decreased 0.45 % (p = 0.0110) in a mean of 12.8 weeks.
Conclusions
Current literature overestimates TBD dose and underestimates the degree and the time of onset of the dawn phenomenon. Maintaining near normal glycemia in the ambulatory setting may be achieved in selected Type 1 patients for at least two weeks and maybe longer.
Keywords: basal, diabetes, glucose, insulin, pump
Introduction
The current recommendations for setting and evaluating the basal insulin rate in patients treated with continuous subcutaneous insulin infusion (CSII) were derived from patients' data in which the standard of good control was an A1C <7.0% and/or infrequent self monitored glucose (SMBG) values within a target range.1,2 Continuous glucose monitoring (CGM) has revealed that both A1C and infrequent SMBG do not reflect the wide glucose variations seen in the postprandial and nocturnal periods.3,4,5,6 We have evaluated current dosing recommendations for total basal dose (TBD) as determined from total daily dose (TDD) and weight, the hourly variation in the basal insulin infusion rate and time of day of peak insulin infusion in ambulatory patients with Type 1 diabetes achieving near normal glucose control while being treated with CSII.
Methods
Patient selection
After obtaining institutional review board approval, subjects were recruited from our patient population from February to May, 2005. Of 324 patients in our Center treated with CSII, 30 subjects were consecutively selected who met the inclusion and exclusion criteria and signed an informed consent.
Subjects were included if they were 18 years or older, had been diagnosed with Type 1 diabetes for at least one year, treated with CSII for at least 3 months, had an A1C of <8.0% and an undetected fasting unstimulated C-peptide. Subjects were excluded if their A1C had changed >0.9% within the last six months, were not able to understand and perform carbohydrate counting, had a major stress, e.g., major surgery, serious infection or significant psychological disorder, within the last 3 months or were on a medication that would significantly influence insulin sensitivity, e.g., thiazolidinedione, hydrochlorothiazide >12.5 mg/d, and beta blocker. In addition, subjects were excluded if they were pregnant or nursing, within one week of menses, had a major change in eating or activity pattern, weight change of >1.9 kg within the last three months, a creatinine >1.4 mg/dl, an ALT > 3 times upper limits of normal or symptomatic gastroparesis.
Protocol
The glucose sensor (CGMS® System Gold, Medtronic, Northridge, California) was inserted on the first day and the monitor activated. On each day(s) thereafter, the subject returned to the Center, where the monitor information was uploaded without detaching from the sensor, for interpretation and insulin dosage adjustments. The usual duration of each visit was 30 minutes. Each day the monitor was calibrated with four spaced self- monitored blood glucose determinations. The sensor was removed for signal failure, the end of study, or prior to a three day weekend when a sensor was in place for more than two days.
Food was selected by the patient from a separate menu for breakfast, lunch, and dinner and provided a composition of 50% carbohydrate, 30% fat and 20% protein. No snacks were eaten. In all meals the portion sizes were weighed on an electronic scale by the subject. Subjects were told not to change their daily activity. Subjects' activity varied from sedentary to mildly active. Moderate to marked activity was limited due to the wearing of the CGM monitor/sensor.
One meal each day was omitted to evaluate the glucose level during this basal period. The glucose target was <5% of all readings < 70 mg/dl and <20%, > 170 mg/dl. The order of once a day meal omission was dinner, lunch, and then breakfast.
Subjects were instructed to take glucose tablets, 4 g/tablet, for perceived and confirmed by self-monitored glucose hypoglycemia episodes (<70 mg/dl). A single standard bolus wave was used by all subjects for the bolus dosing studies. All subjects used insulin aspart.
Analysis
The mean, standard deviation (SD) and range were determined for certain variables. When determining levels of significance for variables in which subjects were compared to themselves, a paired, single-tail test was used. A regression of least squares was used to determine the relationship of variables to each other. The line of best fit was adjusted to allow the y intercept to be zero. The level of significance of such relationships was determined by the correlation coefficient and the degrees of freedom as being N – 1. In addition, formulas for calculating TBD were tested for whether they were significantly different from observed values by an unpaired, two-tailed t test.
Results
Sixty-seven percent of subjects were female. The subjects' mean (range) age was 46.1 years (20-72); weight, 74.1 kg (48.2-110.1); BMI, 26.1 kg/m2 (19.5-42.3); duration of diabetes, 19.1 years (2-48); duration of CSII treatment, 5.1 years (1-23); and A1C, 6.98% (6.0-7.9). Of the 30 subjects, five were Hispanic American, one was Asian American and the remainder were non-Hispanic Caucasian. The mean TDD was 35.4 units/d (14.7-70) and TBD, 13.5 units/d (5.3-22.3).
The sensors functioned for up to eight days. Only two sensors (3%) failed of 65 studies performed. The mean duration of dosage adjustment and glucose assessment was 11.9 days (5-25) and included 8.3 (4-17) Center visits. The glucose goals were achieved for all subjects. For the TBD the mean % of glucose readings below 70 mg/dl was 0.43 % and above >170 mg/dl was 1.56%. The mean (standard deviation) basal glucose level during the 24 hour period was 115 (±14) mg/dl. The mean hourly glucose levels are shown for all thirty subjects during their basal testing (Figure 1). The basal glucose results for the four hour period after meal omission were transferred to the basal glucose graph.
Figure 1.
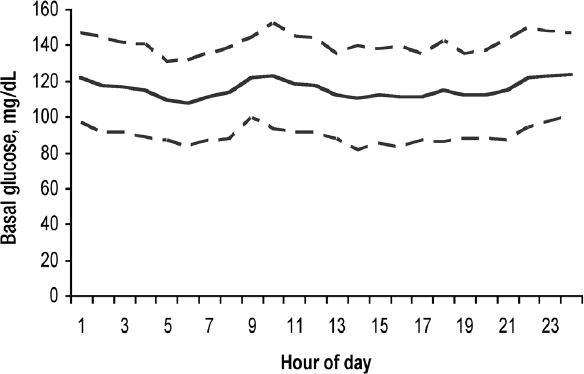
The mean and standard deviation of the hourly basal glucose in 30 subjects with Type 1 diabetes treated with continuous subcutaneous insulin infusion with daily insulin dosage adjustments guided by continuous glucose monitoring. The basal glucose data from the meal period of that day in which the meal was omitted was transposed to the meal period of the 24 hour basal glucose report.
With meal omissions for basal testing we noticed frequent hypoglycemia in the subjects. The mean grams of carbohydrate tablets taken for treatment of hypoglycemia during the first two days of basal testing (26.5 ± 23.9 grams) was reduced to 4.8 ± 8.8 grams (p = <0.0001) by the last two days of the study. The initial TBD was reduced from 14.9 ± 6.3 to 13.5 ± 5.9 units/d (p = 0.00184). After three days the mean TBD did not significantly change. A significant weight loss of 1.3 ± 1.2 kg (p = 0.00373) was noted over a mean of 11.6 days. There was no significant relationship of the individual's weight loss to the change in TBD (p > 0.05).
The actual TBD was highly correlated to the TDD (r = 0.870, p < 0.0005) (Figure 2) and weight (r = 0.653, p < 0.0005) (Figure 3). The slope of TBD compared to TDD was 0.384*TDD in these subjects on a 50% carbohydrate diet and the TBD compared to weight was 0.185*weight (kg). Both the TBDs estimated from current published formulas, 0.50*TDD and 0.3*weight (1,7), were significantly different (p = 0.0111 and <0.0001, respectively) from the TBD that was observed.
Figure 2.
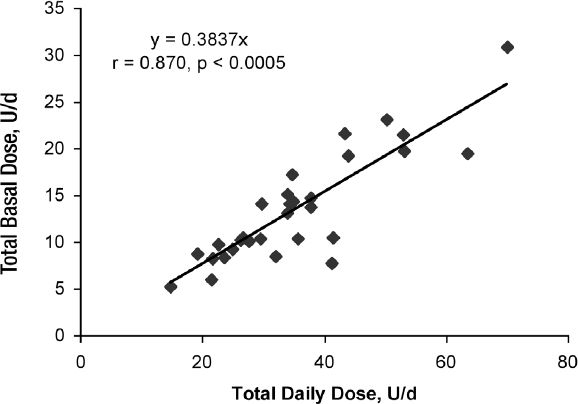
The relationship of total basal dose (units/day) to total daily dose (units/day) in 30 subjects with Type 1 diabetes with near normal glucose control treated with continuous subcutaneous insulin infusion with daily insulin dosage adjustments guided by continuous glucose monitoring and on a 50% carbohydrate diet.
Figure 3.
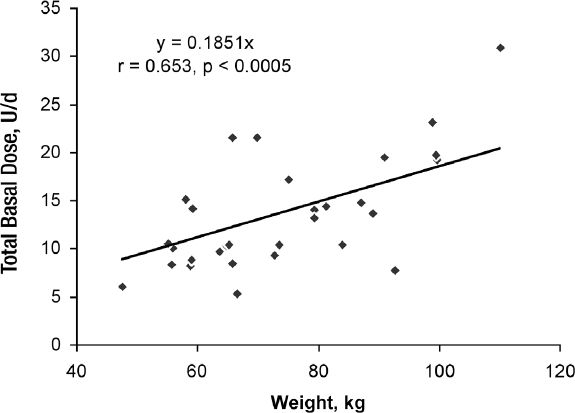
Relationship of total basal dose (units/day) to body weight (kg) in 30 subjects with Type 1 diabetes with near normal glucose control treated with continuous subcutaneous insulin infusion with daily insulin dosage adjustments guided by continuous glucose monitoring.
The mean 24 hour basal insulin infusion rate varied between subjects from 0.2 to 2.1 units/hour. The mean difference between an individual's lowest and the highest rate was 127% and ranged 25 to 300% (Figure 4). The hourly basal rate described a biphasic curve reaching its peak at 0200 hours and its minimum rate by 1200 hours with the mean of 2.7 basal rate changes required (range, 2-5). The peak rate was reached on or before 0200 hours in 73% of subjects (Figure 5).
Figure 4.
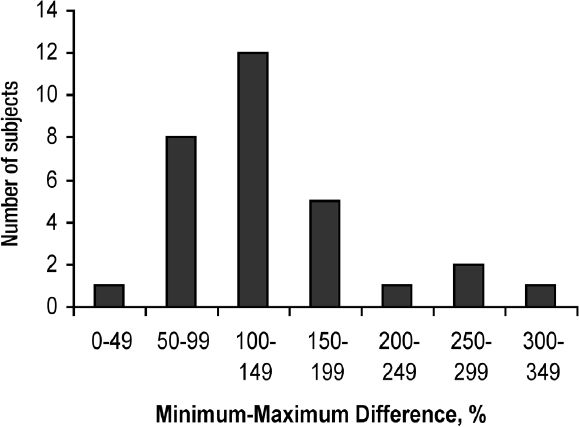
The distribution of ranges of % differences between the minimum to maximum basal rate insulin infusion during a 24 hours period in 30 subjects with Type 1 diabetes treated with continuous subcutaneous insulin infusion with daily insulin dosage adjustments guided by continuous glucose monitoring.
Figure 5.
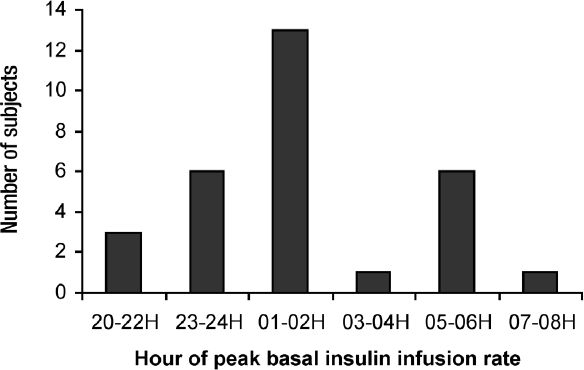
The distribution of hourly range in which the subjects reached peak insulin infusion rate. The subjects were treated with continuous subcutaneous insulin infusion with daily insulin dosage adjustments guided by continuous glucose monitoring.
In the post study period, in which no further CGM guided adjustment were made and in those patients with an A1C >6.9% (N=15) at baseline, the mean A1C fell 0.45% units (p = 0.0110) during a mean of 12.8 weeks.
Conclusions
A desired basal insulin infusion rate may be defined as that which achieves normoglycemia including the periods associated with the early morning increase in insulin demand (dawn phenomenon) and no hypoglycemia even when a meal is omitted. We have previously described a method of daily uploading CGM values and adjusting the insulin infusion rate in CSII patients.8 Utilizing this method, we were able to achieve near normal basal glucose values with minimal hypoglycemia in ambulatory subjects with Type 1 diabetes. The mean (standard deviation) basal glucose level over the 24 hour period was 115 (±14) mg/dl was associated with a glucose of <70 mg/dl only 0.43% of the time. We therefore believe that the basal insulin infusion rate established in these patients reflects the true basal rate for these subjects.
We believe our results can be generalized to a broad population of adult patients with Type 1 diabetes treated by CSII. Our study includes a wide range of ages, diabetes duration, BMI, and several ethnic groups.
Total Basal Dose Formulas
Current formulas estimate the TBD from TDD or from body weight (usually in kg). Standard references1,7 recommend TBD = 0.50*TDD or TBD = 0.30* body weight in kilograms. Similarly in a comparison trial of CSII and MDI therapies using glargine as the basal insulin, Hirsch et al9 found the TBD of both glargine and CSII to be 50% of TDD. In this latter case the dosage was adjusted from fasting and predinner self- monitored glucose values. In a review of 141 patients treated with CSII and who were well controlled as defined as an A1C < 7.0%, Davidson et al2 found the average TBD was 48% of TDD. In each of these studies, the basis for establishing the TBD was the A1C and intermittent SMBG. Continuous glucose monitoring3,4,5,6 has shown that SMBG does not accurately reflect the variations in glucose, especially after meals and during sleep when the dawn phenomena may be seen.
In our subjects the TBD:TDD and the TBD: weight ratios were different from what was predicted by prior recommendations. We found that 0.384*TDD when on a 50% carbohydrate diet and 0.185*weight, in kilograms, better matched the TBD. These findings suggest that the current recommendations lead to an excess of basal dose and therefore, increased risk of hypoglycemia, especially when a meal is omitted. We found a significant reduction in oral glucose tablets taken for hypoglycemia and reduction in weight when the TBD was lowered. We do not believe a weight loss associated increased insulin sensitivity caused the lower basal dose since there was no correlation between the weight loss and the reduction in TBD. As reported in the accompanying article in this Journal, the insulin bolus ratios were studied after establishing the TBD. More insulin was required for boluses used by the subjects suggest no increase in insulin sensitivity from the minor weight change. We believe that it is a common practice to inadequately bolus for meals resulting in hyperglycemia. The TBD is increased by the patient or provider to compensate for the rising glucose level instead of increasing the bolus insulin dosage.
Basal Insulin Infusion Rate Changes
It has been widely reported that there is an increased demand for insulin in the early morning hours associated with arising. This phenomenon is known as the dawn phenomenon and is thought to be due to the nocturnal increase secretion of growth hormone.10 Most of our subjects have an increase in basal insulin infusion earlier than dawn and suggest the dawn phenomenon is a dusk to dawn phenomenon. Carroll and Schade10 report that only 54% of Type 1 patients need an increase of 20% or more insulin at night. Our data suggests that all 30 of our subjects had greater than a 20% increase and the mean increase was more than 100%. This difference may be explained by the time periods compared. If the comparison is made only between two close portions of the night, e.g., 2400 hours and 0800 hours, as was done in Carroll and Schade,10 differences may be small. But if comparisons are made between the lowest need, e.g., 1200 hours and the highest need, e.g., 0200 hours, the differences are much greater. Flat-acting insulin, i.e. glargine, with minimal variation in insulin effect, would not reproduce this action curve, at least with one injection per day. Indeed, this has been previously suggested by us and other investigators.10,11
Application of our treatment protocol
The near normal glucose control achieved in this study is a reflection of patient adherence and our protocol for CGM driven insulin adjustments. Longer near normal glucose control may be possible. Others12 have demonstrated stability of insulin sensitivity to insulin over time. Our study duration was an average of two weeks, in which the basal rate, once established, did not significantly vary. Also in post-study follow up at an average period of 12.8 weeks, the A1C was significantly lower in those starting with 7.0% or higher.
Conclusions
In this pilot study our data support changing dosing formulas. The TBD: TDD and TBD: weight ratios should be reduced to yield lower basal insulin doses. The increased insulin infusion rate needed for the dawn phenomenon begins earlier and is greater than reported. Lastly, near normal glucose control can be achieved, albeit for two weeks, in selected patients treated with CSII and by daily CGM guided insulin dosage adjustments. Insulin dosing requires clinical judgment and appropriate self-monitoring of blood glucose, since the formula results may vary widely from that observed.
Acknowledgements
The authors would like to thank the efforts of our research subjects and the research assistance of Gary Wolfe, RN, CCM.
Abbreviations
- CGM
continuous glucose monitoring
- CSII
continuous subcutaneous insulin infusion
- SD
standard deviation
- SMBG
self-monitored blood glucose
- TBD
total basal dose
- TDD
total daily dose
References
- 1.Bode BW. Therapy for diabetes mellitus and related disorder. In: Lebovitz H, editor. Insulin pump therapy. 4th ed. Alexandria, VA: American Diabetes Association; 2004. pp. 224–231. [Google Scholar]
- 2.Davidson PC, Hebblewhite HR, Bode BW, Steed RD, Welch NS, Greenlee MC, Richardson PL, Johnson J. Statistically based CSII parameters: correction factor, CF (1700 rule), carbohydrate-to-insulin ratio, CIR (2.8 rule), and basal-to-total ratio. Diabetes Technol Ther. 2003;3:237. [Google Scholar]
- 3.Boland E, Monsod T, Delucia M, Brandt CA, Fernando S, Tamborlane WV. Limitations of conventional methods of self-monitoring of blood glucose: lessons learned from 3 days of continuous glucose sensing in pediatric patients with type 1 diabetes. Diabetes Care. 2001;24:1858–1862. doi: 10.2337/diacare.24.11.1858. [DOI] [PubMed] [Google Scholar]
- 4.Gross TM, Mastrototaro JJ. Efficacy and reliability of the continuous glucose monitoring system. Diabetes Technol Ther. 2000;2(Suppl 1):S19–S26. doi: 10.1089/15209150050214087. [DOI] [PubMed] [Google Scholar]
- 5.Ludvigsson J, Hanas R. Continuous subcutaneous glucose monitoring improved metabolic control in pediatric patients with type 1 diabetes: a controlled crossover study. Pediatrics. 2003;111:933–938. doi: 10.1542/peds.111.5.933. [DOI] [PubMed] [Google Scholar]
- 6.Kaufman FR, Gibson LC, Halvorson M, Carpenter S, Fisher LK, Pitukcheewanont P. A pilot study of the continuous glucose monitoring system: clinical decisions and glycemic control after its use in pediatric type 1 diabetic subjects. Diabetes Care. 2001;24:2030–2034. doi: 10.2337/diacare.24.12.2030. [DOI] [PubMed] [Google Scholar]
- 7.Wolpert H. Alexandra, VA: American Diabetes Association; 2002. Smart pumping for people with diabetes. [Google Scholar]
- 8.King AB, Armstrong DU. Daily glucose trend analyses and treatment adjustments using the continuous glucose monitoring system (CGMS, Medtronic MiniMed): “tweaking”. Diabetes Technol Ther. 2004;6(2):297. doi: 10.1089/152091504773731465. [DOI] [PubMed] [Google Scholar]
- 9.Hirsch IB, Bode BW, Garg S, Lane WS, Sussman A, Hus P, Santiago OM, Kolacynski JW. Continuous subcutaneous insulin infusion (CSII) of insulin aspart versus multiple daily injection of insulin aspart/ insulin glargine in type 1 diabetic patients previously treated with CSII. Diabetes Care. 2005;28:533–538. doi: 10.2337/diacare.28.3.533. [DOI] [PubMed] [Google Scholar]
- 10.Carroll MF, Schade DS. The dawn phenomenon revisited: implications for diabetes therapy. Endocr Pract. 2005;11:55–64. doi: 10.4158/EP.11.1.55. [DOI] [PubMed] [Google Scholar]
- 11.King AB, Armstrong DU. A comparison of basal insulin delivery: continuous subcutaneous insulin infusion versus glargine. Diabetes Care. 2003;26:1322. doi: 10.2337/diacare.26.4.1322. [DOI] [PubMed] [Google Scholar]
- 12.Perriello G, De Feo P, Torlone E, Fanelli C, Santeusanio F, Brunetti P, Bolli GB. The dawn phenomenon in type 1 (insulin-dependent) diabetes mellitus: magnitude, frequency, variability, and dependency on glucose counterregulation and insulin sensitivity. Diabetologia. 1991;34:21–28. doi: 10.1007/BF00404020. [DOI] [PubMed] [Google Scholar]