

Abstract
Background
Continuous amperometric sensors that measure glucose or lactate require a stable sensitivity, and glutaraldehyde crosslinking has been used widely to avoid enzyme loss. Nonetheless, little data is published on the effectiveness of enzyme immobilization with glutaraldehyde.
Methods
A combination of electrochemical testing and spectrophotometric assays was used to study the relationship between enzyme shedding and the fabrication procedure. In addition, we studied the relationship between the glutaraldehyde concentration and sensor performance over a period of one year.
Results
The enzyme immobilization process by glutaraldehyde crosslinking to glucose oxidase appears to require at least 24-hours at room temperature to reach completion. In addition, excess free glucose oxidase can be removed by soaking sensors in purified water for 20 minutes. Even with the addition of these steps, however, it appears that there is some free glucose oxidase entrapped within the enzyme layer which contributes to a decline in sensitivity over time. Although it reduces the ultimate sensitivity (probably via a change in the enzyme's natural conformation), glutaraldehyde concentration in the enzyme layer can be increased in order to minimize this instability.
Conclusions
After exposure of oxidase enzymes to glutaraldehyde, effective crosslinking requires a rinse step and a 24-hour incubation step. In order to minimize the loss of sensor sensitivity over time, the glutaraldehyde concentration can be increased.
Keywords: biosensor, glucose, glucose oxidase, glutaraldehyde, lactate oxidase
Introduction
While enzyme-based biosensors are extremely specific to a given analyte, the presence of a protein as a working component in the sensor presents issues of long-term stability and biocompatibility. Glutaraldehyde has been a critical component to the design of biosensors ever since it was first shown to crosslink enzymes at amine groups while maintaining the proper enzyme conformation.1,2 Nonetheless, there is little published information on the specifics and effectiveness of enzyme immobilization. Here we study the results of enzyme immobilization on shelf-life and layer stability for both glucose and lactate amperometric sensors.
When used in soldiers or civilians with traumatic injuries, a continuous lactate sensor would be expected to provide early warning of a blood loss and hypoperfusion. In addition, lactate sensors would be useful in metabolic monitoring for individuals working in high stress environments.3–6 For example, a soldier working in a desert environment may experience physical exhaustion and dehydration. Lactate levels in the human body are an indicator of the level of anaerobic activity, such as that due to hypoxia or decreased blood volume. We have developed an amperometric lactate sensor that is capable of continuously monitoring lactate levels in interstitial fluid.7 The sensor employs lactate oxidase to catalyze the reaction between lactate and oxygen. Hydrogen peroxide is thus produced, and oxidized at the platinum surface. The magnitude of the measured current is proportional to lactate levels in interstitial fluid.
An amperometric glucose biosensor is realized by substituting glucose oxidase for lactate oxidase. Such a sensor is useful for continuously monitoring the glucose levels in interstitial fluid. The primary application for continuous glucose monitoring is diabetes management. However, there is also evidence that tight management and control of glucose with continuous monitoring of glucose in critical care patients significantly reduces mortality and the length of hospital stay.8
In the case of both lactate and glucose sensing, the sensors are physically inserted into the subcutaneous or intravascular locations of the human subject and therefore, the sensor must be biocompatible. The enzymes used in both sensors originate from non-mammalian proteins, and thus have the potential to cause an allergic response.9–11 For this reason, we are interested in monitoring for enzyme loss from the sensors during fabrication.
In addition, it is necessary to have a stable sensor, both throughout the measurement period (several days) and while sitting on the shelf. The enzyme layers studied here are immobilized onto the sensor anode using a mixture of enzyme, glutaraldehyde, and bovine serum albumin. Incomplete immobilization, molecular conformation, and the dynamics of the immobilization process contribute to the success of the enzyme layer in both the short-term and long-term. Our focus on glutaraldehyde as a component of the enzyme layer is in contrast to prior work that focused on the relationship between hydrogen peroxide production and enzyme stability.12In addition, other groups have attempted to improve enzyme stability by altering either the enzyme13 or the components of the enzyme layer.14–16
In order to more fully understand the enzyme immobilization process, we have applied two common spectrophotometric assays for glucose oxidase to the study of both glucose oxidase and lactate oxidase. The o-dianisidine assay measures the rate of change in the amplitude of the 449 nm absorption peak and is sensitive for solutions containing enzyme concentrations of up to 3 U/ml.17–20 This assay is useful in the study of immobilized enzyme, where dilutions are not possible. The more sensitive assay, the Amplex Red assay, measures the amplitude of the 517 nm absorption peak with a maximum enzyme concentration of 5 mU/ml.21 This assay is useful for the study of solutions containing enzyme. Both assays were employed here to examine enzyme shed from sensors after the application of immobilized enzyme. Specifically, we asked how glutaraldehyde concentration influences enzyme leaching and electrochemical sensor sensitivity to lactate. We also asked whether increased incubation time of glutaraldehyde-loaded sensors prior to rinsing increases crosslinking. Finally, we tested whether ultraviolet light could be used to purposefully create graded denaturation of the oxidase enzyme.
Materials and Methods
Sensor fabrication and in vitro testing
Both glucose and lactate sensors were fabricated using identical procedures, except for the respective enzyme layers. The glucose sensor employs an enzyme layer containing glucose oxidase, bovine serum albumin, and glutaraldehyde. The lactate sensor differs only in the substitution of lactate oxidase. The revised protocol employed here as the sensor fabrication procedure has been previously described.22 The sensors consist of a platinum wire (178 µm diameter) anode with polymer insulation and an Ag/AgCl cathode wound circumferentially around the anode. The polymer insulation is circumferentially patterned by pulsed laser ablation, exposing the active area of the sensor. When the anode is coated with an immobilized enzyme layer and biased relative to the cathode, the presence of the analyte is detected indirectly through the oxidation of hydrogen peroxide.
In vitro testing for the respective analyte, glucose or lactate, was performed in a stirred, 37°C, buffered phosphate solution. After allowing the sensors to run-in to a low and stable background current the analyte response was measured. Specifically, the analyte is injected into the test solution while the current is continuously monitored. The analyte response is measured by subtracting the background current from the steady-state current measured after analyte exposure.
Spectrophotometric enzyme assays
An Agilent 8453 UV-visible spectrophotometer was employed. Two different UV-visible spectrophotometric assays were used to measure the presence of active enzyme: an Amplex Red assay (Molecular Probes, Eugene, Oregon) and an o-dianisidine assay (Sigma-Aldrich, St. Louis, Missouri). Both assays measure hydrogen peroxide, the byproduct of the reaction catalyzed by glucose oxidase (and lactate oxidase) between glucose (lactic acid) and oxygen. In the case of the Amplex Red assay, the hydrogen peroxide reacts with 10H-Phenoxazine-3, 7-diol (the Amplex Red reagent) in the presence of horseradish peroxidase (Sigma-Aldrich) to form the oxidation product resorufin. Resorufin has an absorption peak at approximately 571 nm at a pH of 7.4. In the case of the o-dianisidine assay, the hydrogen peroxide reacts with o-dianisidine in the presence of horseradish peroxidase to produce the oxidized form of o-dianisidine, which has an absorption peak of 449 nm at a pH of 7.4. The Amplex Red assay is sensitive to enzyme concentrations below 5 mU/ml. The o-dianisidine assay is sensitive to enzyme concentrations ranging from 10 mU/ml to 5000 mU/ml. For enzyme concentrations between 5 and 10 mU/ml, the Amplex Red assay can be used by diluting the sample solution.
Standard solutions of glucose oxidase (Biozyme, San Diego, California) and lactate oxidase (Sigma-Aldrich) were prepared by serial dilution of a stock solution as an internal control. For each enzyme assay, the solution test sequence included measurement of the absorption spectra for the standard solutions in addition to the test solutions. A calibration curve was generated from the standard solutions and used to determine the active enzyme concentration in a given test solution (Figures 1 and 2).
Figure 1.
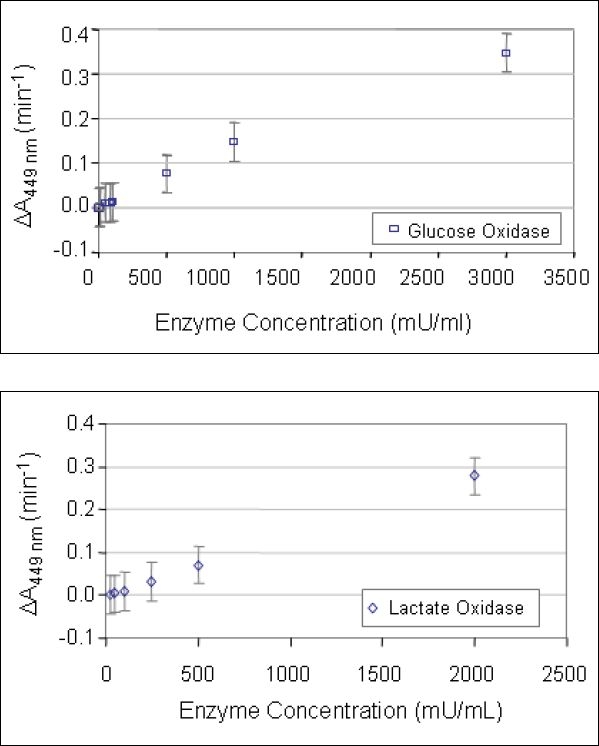
Standard curves for the relationship between the rates of change in the 449 nm absorption peak from o-dianisidine oxidation as a function of enzyme concentration (glucose oxidase - open squares, lactate oxidase - open diamonds). Standard error bars are shown. The curves for glucose oxidase and lactate oxidase are essentially superimposable upon one another.
Figure 2.
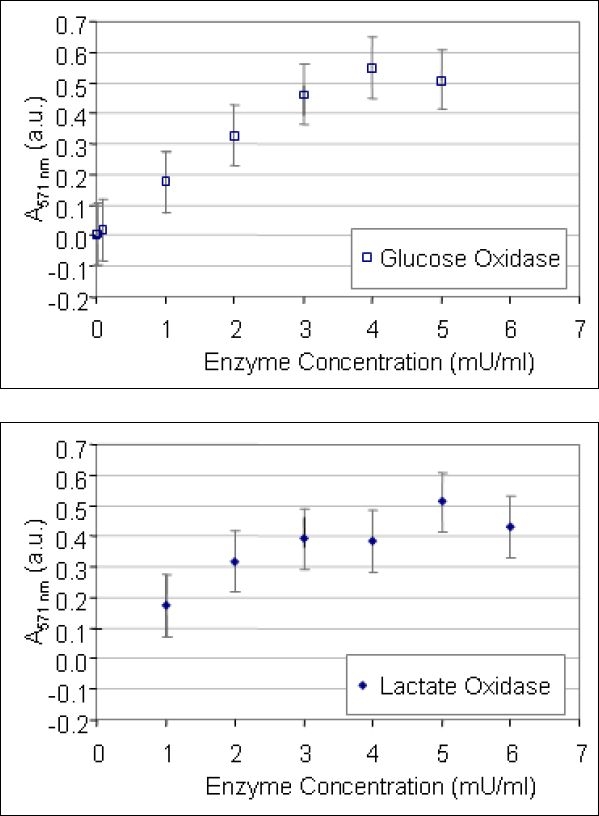
Standard curve showing the direct relationship between the magnitude of the 571 nm absorption peak and the enzyme concentration using the Amplex Red reagent. Glucose oxidase - open squares, lactate oxidase - solid diamonds. Standard error bars are shown. The abbreviation A.U. refers to Absorbance Units. Note that, compared to the o-dianisidine assay, the Amplex Red assay is better adapted to measure low concentrations of oxidase enzymes.
For the Amplex Red assay, a working solution was prepared containing 50 µL of a 100 µM Amplex Red reagent mixed in dimethyl sulfoxide (DMSO), 100 µL of 10 U/mL of horseradish peroxidase, 1.25 mL of a 500 mM glucose solution, and 3.6 mL of a phosphate buffer solution. The working solution was mixed 1:1 with each sample solution. The final solution was then allowed to incubate for 30 minutes at 25°C prior to measuring the absorption peak at 517 nm. The peak amplitude at 517 nm was correlated to the sample solution by comparison to a standard curve.
The o-dianisidine assay consisted of a working solution containing a 0.001% o-dianisidine (Sigma-Aldrich) in phosphate buffer solution (pH of 7.4), 0.5 M glucose (lactate) in purified water, and 1 mg/ml of horseradish peroxidase (Sigma-Aldrich). Oxygen was continuously bubbled into the o-dianisidine solution throughout the measurement sequence in order to provide sufficient oxygen in solution for the oxidation of both glucose and o-dianisidine. Each aliquot of working solution contained 1.25 ml of o-dianisidine solution, 0.15 ml of horseradish peroxidase, and 0.05 ml of glucose (lactate). Upon the addition of 0.05 ml of sample solution, the absorption peak at 449 nm was measured once per minute for at least 5 minutes. The rate of change in the absorption was correlated to sample solution enzyme concentration.
For studies of UV exposure, there was no outer membrane (which might have protected against purposeful UV destruction). For the rinse studies, the assays were performed after enzyme application but before outer membrane application. For glutaraldehyde studies, full sensors were assayed.
Enzyme leaching study
The purpose of this study was to assess whether the enzyme dissociates from the electrode and leaches out after being applied to the electrode. The study of the application procedure focused on the completeness of the oxidase enzyme immobilization on the platinum surface. Platinum wire electrodes with a defined exposed geometry were coated with a mixture of glucose oxidase, bovine serum albumin, and glutaraldehyde. After drying at room temperature in air for 30 minutes, groups of 7 wire electrodes were then soaked in small volumes (1 ml) of purified water on an orbital shaker for a range of durations (20 minutes to 24 hours).
Incubating for a period of time after coating may allow crosslinking to continue, thus reducing the potential for leaching. Therefore, a second group of 3 wires were rinsed in 1 ml of purified water for 20 minutes after sitting at room temperature for a range of waiting periods (30 minutes to 24 hours). The rinse solutions were then analyzed for the presence of active glucose oxidase using either of the two UV-visible spectrophotometric assays.
After completion of the first rinse for all groups, the sensor groups were once again rinsed in 1 ml of purified water for an additional 16 hours in order to perform a final test for enzyme leaching. These second rinse solutions were tested for the presence of active glucose oxidase using either of the two UV-visible spectrophotometric assays. The o-dianisidine assay is better suited than the Amplex Red assay to detect larger enzyme concentrations. Therefore, this assay was used to monitor enzyme activity for immobilized enzyme on sensors, where the working solution (in an assay cuvette) could not be diluted. The reason that the cuvette could not be diluted was because the assay is performed in real time.
Purposeful UV-induced enzyme damage
We asked whether purposeful damage to the enzyme after coating could be created by using the assay to detect loss of immobilized enzyme activity. To study the effectiveness of the spectrophotometric assay to quantify immobilized enzyme, a group of sensors coated only with the enzyme layer were exposed to different durations of ultraviolet (UV) light. The UV light was used to destroy the activity of the enzyme layer, creating a range of enzyme loading for the assay. Sensors were first electrochemically tested against an Ag/AgCl reference electrode for 1.25 mM glucose response in a 37°C stirred phosphate buffer solution. A low concentration of glucose was required for such a test because of the absence of a barrier permselective outer membrane. Groups of six sensors were then exposed to a 5000-MC 400 Watt metal halide lamp (Dymax, Torrington, CT 06790) with a peak output wavelength of 365 nm and 225 mW/cm2 unfiltered intensity for a range of durations (40 seconds – 8 minutes). A control group received no UV light exposure. During the UV exposure, the chamber temperature was monitored by thermocouple. The sensors were then retested against an Ag/AgCl reference electrode for 1.25 mM glucose response.
Following UV exposure, the sensors were tested for enzyme activity using the o-dianisidine spectrophotometric assay. The sensors were individually submerged in the stirred o-dianisidine working solution. Measurements were made every minute for up to six minutes. The sensor in the cuvette was stirred between measurements. In addition, standard solutions of glucose oxidase were measured periodically throughout the course of the experiment. A standard curve was used to convert the specific data (rate of change in the 449 nm absorption peak amplitude) to a glucose oxidase concentration.
The Effect of Glutaraldehyde Concentration on Enzyme Activity
Glutaraldehyde was used in the enzyme layer to generate an immobilized active enzyme on the sensor. These experiments were performed because of the possibility that glutaraldehyde may change the molecular conformation of the enzyme, depending on its concentration. In addition, different concentrations of glutaraldehyde may affect how much of the active enzyme remains immobilized in the membrane over time.
To study the relationship between the amount of glutaraldehyde present in the enzyme layer and the sensor performance over time, groups of 16 glucose sensors were built with a range of glutaraldehyde concentrations in the enzyme solution (6×10⁻⁵ % by weight to 6 % by weight). A 0.6% by weight concentration served as the control group, representing our standard fabrication conditions. A solution with this glutaraldehyde concentration is considered a ‘1x’ solution. A 6% by weight glutaraldehyde solution is a 10x solution, and so forth. The standard enzyme solution contains 0.6% glutaraldehyde. Following fabrication, the sensors were tested for glucose response. The sensors were then retested one year later. Sensors were initially tested within one day of completing the fabrication process.
Electrochemical tests were made using a custom test system that simultaneously addresses up to 64 sensors. The analog current measured from the sensors is converted to a digital voltage with a trans-impedance amplifier. Each sensor has a separate amplifier calibrated prior to use. The test system includes hardware and software filtering to eliminate 60 Hz noise. The digital voltage signal is collected with a computerized data acquisition system.
In terms of statistics, Student's 2-tailed t test was used for comparisons. Unpaired tests were used except for the one year shelf life study, in which a paired test was used. Statistical results are given with the figures.
Results
Spectrophotometric enzyme assays
The o-dianisidine assay of both glucose oxidase and lactate oxidase produced a linear standard curve over the range of 10-3,000 mU/ml. The standard curves for the two enzymes are identical, as shown in Figure 1. The graph shows the increasing rate of change in the absorption peak at 449 nm with increasing enzyme concentration. The solid diamonds represent the measurements made with lactate oxidase and the open squares represent the measurements made with glucose oxidase.
A linear trend fit to the data in Figure 1 was used in subsequent measurements of solutions containing unknown amounts of enzyme to determine the amount of active enzyme present. The relationship is as follows:
where ΔA449nm is the rate of change in the absorption peak at 449 nm (min−1) and EC is the enzyme concentration in mU/ml. Over the enzyme concentration range of 0 – 500 mU/ml, the r2 value falls to 0.87.
The Amplex Red assay of both the glucose oxidase and lactate oxidase was linear over a lower level of enzyme concentrations (0 to 5 mU/ml). Figure 2 shows the direct relationship between enzyme concentration and the amplitude of the absorption peak at 571 nm. The solid diamonds represent measurements made of lactate oxidase and the open squares represent glucose oxidase. Standard error bars are shown at each concentration.
A linear curve fit across the enzyme concentration range of 0 mU/ml to 5 mU/ml results in the following relationship:
where A517nm is the amplitude of the absorption peak (in absorbance units, a.u.) at 517 nm. This relationship was used to calculate the enzyme concentration in a solution containing an unknown quantity of enzyme.
Enzyme leaching study
The degree to which glucose oxidase was immobilized onto the glucose sensor was studied by measuring the absorption spectra of rinse solutions in conjunction with either the o-dianisidine assay or the Amplex Red assay. A 1 ml volume was used for all rinse solutions.
For the first rinse, the amount of active enzyme in a rinse solution was somewhat independent of the rinse duration. The majority of the rinse solutions tested (ranging in rinse duration from 20 minutes to 8 hours) showed roughly 20 mU of glucose oxidase per milliliter. Sensors rinsed for 24-hours had a slightly higher concentration of enzyme present in the rinse solution (25 mU/ml). Figure 3 shows a graph of the glucose oxidase concentration (mU/ml) as a function of the rinse duration (hours). The glucose oxidase concentration for the first rinse (diamonds) was calculated from the standard curve for the o-dianisidine assay.
Figure 3.
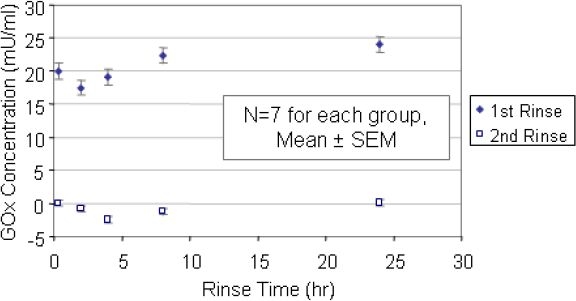
Glucose oxidase concentration (mU/ml, using the Amplex Red assay) as a function of the rinse duration (hour). The first rinse is shown with diamonds and the second rinse with squares. By the second rinse, there was no glucose oxidase remaining. All of the rinse solutions had a 1 ml volume. Each of the 5 data sets for the second rinse was significantly lower (P < 0.01) than the corresponding data set for the first rinse.
The sensors used for the first rinse were rinsed a second time for 16 hours to examine whether or not the enzyme layer would continue to shed active glucose oxidase. The second rinse solutions were categorized by the first rinse duration. The glucose oxidase present in each rinse solution was analyzed using the Amplex Red UV-visible assay. The glucose oxidase concentrations shown in Figure 3 as open squares were determined using the corresponding standard curve. The enzyme concentration was below 2.5 mU/ml.
When sensors coated with enzyme incubated at room temperature for anywhere from 30 minutes to 24 hours before being rinsed for 20 minutes in purified water, the amount of enzyme present in the rinse solution was found to decline with increasing waiting incubation period. This is an indication of a higher degree of crosslinking over time. The glucose oxidase concentration (as determined from an Amplex Red standard curve) fell from approximately 22 mU/ml for a 30 minute wait period to on average 5 mU/ml for a 24-hour wait period. Figure 4 shows the decline in the glucose oxidase concentration as the wait period increas ed.
Figure 4.
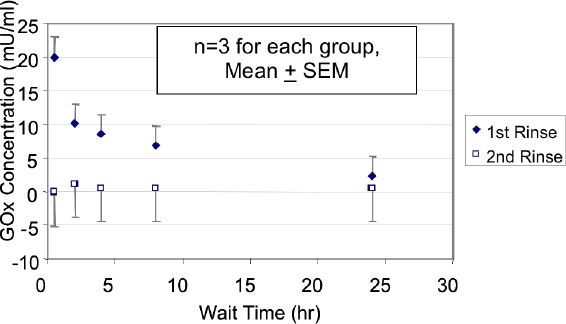
Glucose oxidase concentration (mU/ml, using the Amplex Red assay) as a function of the wait duration (hour). The first rinse is shown with diamonds and the second rinse with squares. During the first rinse, the wait duration markedly reduced the glucose oxidase concentration. All of the rinse solutions had a 1 ml volume. For the first rinse, each of the 4 data sets beyond the first one was significantly lower (P < 0.02) than the first set. For the second rinse, each of the 5 data sets was significantly lower (P < 0.001) than the first data set for the first rinse.
A second 16-hour rinse in purified water was completed on these same sensors, maintaining the groupings by wait period. The rinse solutions were tested for the presence of glucose oxidase using the Amplex Red assay, and the results are shown in the open squares in Figure 4. All of the second rinse solutions show a glucose oxidase concentration below 2 mU/ml.
Immobilized enzyme stability: purposeful damage from UV exposure
Sensors coated only with enzyme were exposed to different durations of UV light. The enzyme activity of the sensors was electrochemically monitored before and after UV light exposure. The 1.25 mM glucose response declined by 90% within 8 minutes of UV light exposure (Figure 5). In comparison, those sensors not exposed to UV light showed a 15% decline in 1.25 mM glucose response from the first test to the second test.
Figure 5.
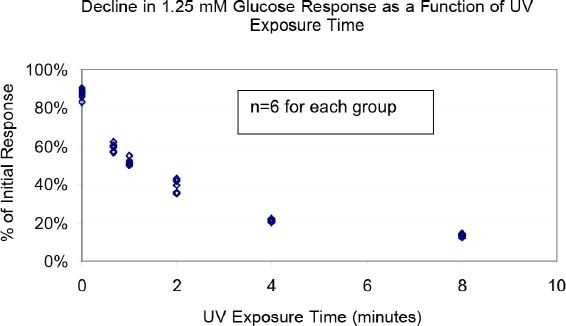
Use of UV exposure as a model of graded enzyme destruction:Electrochemical Measurement – Note decline in the response to 1.25 mM glucose of sensors coated only with enzyme (no permselective membrane) as a function of UV-exposure time (minutes). At each of 6 times, 6 different sensors were tested, and each data point from each time is displayed. Each of the 5 data sets beyond the first data set was significantly lower (P < 0.001) than the first data set.
Half of the sensors fabricated were tested using the o-dianisidine UV-assay. During the course of the measurement, the enzyme layer appeared to absorb the o-dianisidine working solution, changing the color of and visibly swelling the membrane. Figure 6 summarizes the relationship between the glucose oxidase (mU/ml) and the UV exposure time (min). As the UV exposure time increases, the glucose oxidase activity declines.
Figure 6.
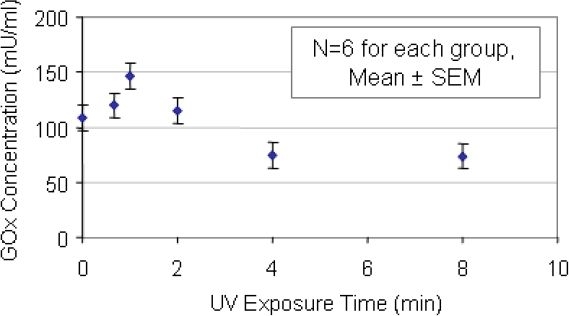
Use of UV exposure as a model of graded enzyme destruction:o-dianisidine Spectrophotometric Assay - Note the decline between the glucose oxidase concentration (mU/ml) and the UV exposure time (minutes). At each of 6 times, 6 different sensors were tested, and the mean values and SEM for each time are displayed.
The change in glucose oxidase activity is very different from that seen in the electrochemical tests. Sensors that were not exposed to UV light showed an average glucose oxidase concentration of 110 mU/ml. After 8 minutes of UV light exposure, the level fell by 36% to an average of 70 mU/ml.
The effect of Glutaraldehyde concentration on electrochemical sensor function
The study of the relationship between the glutaraldehyde concentration and glucose sensor performance was partially motivated by the results from the rinse solution leaching studies. The first rinse solutions showed the presence of active glucose oxidase. The glutaraldehyde concentration influences the degree to which enzyme is fully immobilized. However, prior studies of lactate sensors also indicate that there is an optimal amount of glutaraldehyde desirable to enable natural enzyme conformation.7
We performed electrochemical tests to examine sensors built with a range of glutaraldehyde concentrations. The first test measured the glucose response of newly built sensors, and the second test examined the properties of the same sensors one year later. It was hypothesized that sensors with incomplete immobilization would show a higher degree of degradation in sensor performance over time.
The normalized 5 mM glucose response for new sensors built with a range of glutaraldehyde concentrations is shown in Figure 7. The control group was built using a 1x glutaraldehyde concentration of 0.6% by weight. This group shows the highest glucose sensitivity, approximately 80% higher than the group with the second largest sensitivity; sensors built with a 10x glutaraldehyde solution. The sensors built with less than 0.1x concentration of the glutaraldehyde had a much lower sensitivity – 1% to 2 % of the sensitivity seen from the sensors built with a 1x glutaraldehyde concentration.
Figure 7.
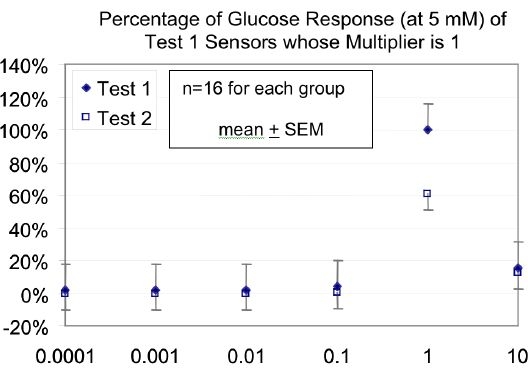
Graph showing the normalized 5 mM glucose responses of new sensors (Test 1 – solid diamonds) and the same sensors one year later (Test 2 – open squares) built with a range of glutaraldehyde concentrations. Standard error bars are shown. The sensors built with the highest concentration of glutaraldehyde show the smallest decline in sensitivity after one year. For the multiplier of 1, there was a significantly lower response (P < 0.001) for Test 2 (one year later) than for Test 1. For both Test 1 and Test 2, data from all multipliers other than 1 had significantly lower response (P < 0.001) than the corresponding data with a multiplier of 1.
Figure 7 shows the decline in the 5 mM glucose response as a function of the amount of glutaraldehyde in the enzyme layer. A glutaraldehyde concentration of 1x (considered to be the control) shows an average 40% loss of sensitivity over the year. A higher concentration of glutaraldehyde (10x) shows less degradation (20%). In comparison, the sensors built with glutaraldehyde concentrations below 10% of the control showed a 100% decline in sensitivity over the year.
Discussion
Our one-year study of enzyme layer stability for our amperometric sensor is strongly dependent upon the degree to which the glutaraldehyde crosslinks the glucose oxidase. The glutaraldehyde concentration in the enzyme solution (containing purified water, glucose oxidase, bovine serum albumin, and glutaraldehyde) is critical in determining the sensor shelf-life. In addition, the fabrication method requires sufficient time to allow the crosslinking process to reach completion and a subsequent rinse procedure to eliminate any remaining free enzyme. Even with the rinse process in place, however, it appears that free enzyme, originally trapped within the enzyme layer, can slowly leach out and contribute to a long term decline in sensor response.
In this study, we explored UV-visible spectroscopy as a means to analyze enzyme stability as a function of application conditions and solution formulation. Two different UV-visible spectrophotometric assays were applied: an o-dianisidine assay and an Amplex Red assay. Both assays require the presence of horseradish peroxidase to catalyze a reaction between the specific reagent and hydrogen peroxide, a product of the reaction between glucose and oxygen or lactate and oxygen. The Amplex Red assay is more sensitive, with a detection limit of 5 mU/ml of enzyme. We found these assays to be very useful for testing enzyme-containing solutions. However, the Amplex Red assay is more difficult to work with as the reagent is both light sensitive and hygroscopic.
In some situations where enzyme concentration is high, dilution can be carried out to allow use of the more sensitive (Amplex Red) assay. On the other hand, when studying sensors on which enzyme is immobilized, the o-dianisidine assay is more useful because dilution is not an option (the small cuvette volume must be assayed in real time). The o-dianisidine assay detects up to 3000 mU/ml of enzyme. Because both assays detect the level of hydrogen peroxide in solution, both assays are useful for both glucose oxidase and lactate oxidase. In the design of the working solution, the glucose or lactate need be in excess supply so as to not limit the reaction.
In this study, we used assays for the oxidase enzymes that measure the function of the enzymes (production of hydrogen peroxide). We did not carry out assays that measure the quantity of enzyme protein. While it would be desirable to understand both functional activity and protein quantity, resource limitations forced a choice. Since the crucial aspect of an enzyme sensor is to produce a compound that is measurable at a working electrode, we elected to measure function. We acknowledge that in some circumstances, the quantity of protein may change without a change in the functional state. This can occur, for example, in the situation in which excess enzyme is present beyond what is needed to catalyze the reaction with the substrates. If some is lost, but the overall enzyme quantity remains in excess, a functional assay would not be expected to detect the change.
The study of the enzyme layer rinse solutions indicated the majority of glucose oxidase not completely immobilized in the layer will be removed within the first 20 minutes of rinsing. In addition, the immobilization (crosslinking) process appears to continue for 24-hours after the enzyme layer has been applied. Fortunately, the enzyme layer appears stable after the first rinse and the study of the second rinse solution shows a very small enzyme concentration (below 2 mU/ml). The potential for enzyme shedding in vivo is further eliminated in our sensors by the addition of an outer membrane that regulates the relative amount of oxygen and glucose reaching the enzyme layer. The outer membrane is permeable to small molecules only and is impermeable to glucose oxidase, a large protein.
The electrochemical test of the glucose response of each sensor used in the rinse study shows no relationship between the glucose response and the amount of enzyme that had been measured in the rinse solution probably because the amount of enzyme lost into the rinse solutions was small compared to the total amount of enzyme loaded onto the sensors. The glucose sensors studied here are intended to be inserted into interstitial fluid and therefore, any loss of enzyme could present a potential health risk to human subjects. Glucose oxidase is a non-mammalian protein, an enzyme that is derived from the fungus, Aspergillus niger. Like other foreign proteins, it may have a potential for allergenicity if it leaks into human tissue. In addition, biosensors like ours that produce hydrogen peroxide and gluconic acid have a potential for local inflammation if these compounds leach into surrounding tissue, though the amounts of these compounds are small.
To better understand any variations in enzyme loading, it would be desirable to apply the same UV-visible spectroscopic technique to immobilized enzyme. Here, we studied enzyme layers that were intentionally damaged to determine whether or not the assay would be sensitive to the degree of damage. Electrochemical tests of the sensors before and after exposure to different durations of UV light indicated that 90% of the enzyme activity had been destroyed within 8 minutes of exposure. In contrast, the o-dianisidine assay of the enzyme on the same sensors showed an average glucose concentration of 70 mU/ml. This represents only a 36% decline in concentration from the sensors that had not been exposed to UV light. It is hypothesized that measurement is unable to fully assay an entire immobilized enzyme layer, and is only measuring the conversion to hydrogen peroxide occurring at the outer surface layers of enzyme.
The presence of glucose oxidase in rinse solutions is partially an indication of incomplete enzyme immobilization. We asked whether this might be due, in part, to an insufficient concentration of glutaraldehyde in the mixture. Past results with lactate sensors indicated sensors have a higher sensitivity and shelf life if fabricated with a minimal amount of glutaraldehyde. In contrast, glucose sensors appear to require more glutaraldehyde for improved shelf-life, but not for initial sensitivity. It is possible that the higher sensitivity seen with the 0.6% glutaraldehyde concentration in the enzyme layer reflects a higher degree of active enzyme loading, but not necessarily complete immobilization. The degradation of the sensitivity over time could reflect incomplete immobilization within the enzyme layer. The sensors were stored for one year at room temperature. Native (non-crosslinked) glucose oxidase has a shelf-life of six months when stored at -20°C. It is possible that the glucose oxidase molecules may have been entrapped inside the enzyme layer, but not fully bound to the glutaraldehyde over the one year duration. This hypothesis is supported by the much smaller loss in sensitivity, at the end of the year, of the sensors built with a higher glutaraldehyde concentration (6% by weight).
We conclude that the long-term stability of our sensors is dependent upon optimization of the glutaraldehyde concentration and the elimination of any residual free enzyme in the enzyme layer. The use of oxidase enzyme assays that quantify hydrogen peroxide production allows achievement of these goals.
Acknowledgements
We also thank Russell Potts for his advice on assay techniques, Mark Neinast for electrode preparation, and Robert Bruce and Peter Jacobs for assistance with potentiostat design and firmware.
References
- 1.Korn A, Feairheller S, Filachione E. Glutaraldehyde: nature of the reagent. J Mol Biol. 1972;65:525–529. doi: 10.1016/0022-2836(72)90206-9. [DOI] [PubMed] [Google Scholar]
- 2.Russell A, Hopwood D. The biological uses and importance of glutaraldehyde. In: Ellis G, West G, editors. Progress in medicinal chemistry. Vol. 13. The Netherlands: North Holland Publishing Company; 1976. pp. 271–301. [DOI] [PubMed] [Google Scholar]
- 3.Donoghue A. Type A lactic acidosis in occupational heat exhaustion. Occup Med (Lond) 2003;53:139–142. doi: 10.1093/occmed/kqg025. [DOI] [PubMed] [Google Scholar]
- 4.Donoghue A, Bates G. The risk of heat exhaustion at a deep underground metalliferous mine in relation to surface temperatures. Occup Med (Lond) 2000;50:334–336. doi: 10.1093/occmed/50.5.334. [DOI] [PubMed] [Google Scholar]
- 5.Donoghue A, Sinclair M, Bates G. Heat exhaustion in a deep underground metalliferous mine. Occup Environ Med. 2000;57:165–174. doi: 10.1136/oem.57.3.165. [DOI] [PMC free article] [PubMed] [Google Scholar]
- 6.Kenefick RW, Mahood NV, Mattern CO, Kertzer R, Quinn TJ. Hypohydration adversely affects lactate threshold in endurance athletes. J Strength Cond Res. 2002;16:38–43. [PubMed] [Google Scholar]
- 7.Ward WK, House JL, Birck J, Anderson EM, Jansen LB. A wire-based dual-analyte sensor for glucose and lactate: in vitro and in vivo evaluation. Diabetes Technol Ther. 2004;6:389–401. doi: 10.1089/152091504774198106. [DOI] [PubMed] [Google Scholar]
- 8.van den Berghe G, Wouters P, Weekers F, Verwaest C, Bruyninckx F, Schetz M, Vlasselaers D, Ferdinande P, Lauwers P, Bouillon R. Intensive insulin therapy in the critically ill patients. N Engl J Med. 2001;345(19):1359–1367. doi: 10.1056/NEJMoa011300. [DOI] [PubMed] [Google Scholar]
- 9.Schlosser M, Ziegler B, Abel P, Fischer U, Ziegler M. Implantation of non-toxic materials from glucose sensors: evidence for specific antibodies detected by ELISA. Horm Me Res. 1994;26(11):534–537. doi: 10.1055/s-2007-1001751. [DOI] [PubMed] [Google Scholar]
- 10.Ziegler M, Schlosser M, Abel P, Ziegler B. Antibody response in rats against non-toxic glucose sensor membranes tested in cell culture. Biomaterials. 1994;15(10):859–864. doi: 10.1016/0142-9612(94)90043-4. [DOI] [PubMed] [Google Scholar]
- 11.Moussy F, Reichert WM. Biomaterials community examines biosensor biocompatibility. Diabetes Technol Ther. 2000;2(3):473–477. doi: 10.1089/15209150050194341. [DOI] [PubMed] [Google Scholar]
- 12.Valdes TI, Moussy F. In vitro and in vivo degradation of glucose oxidase enzyme used for an implantable glucose biosensor. Diabetes Technol Ther. 2000;2(3):367–376. doi: 10.1089/15209150050194233. [DOI] [PubMed] [Google Scholar]
- 13.Chen LQ, Zhang XE, Xie WH, Zhou YF, Zhang ZP, Cass AE. Genetic modification of glucose oxidase for improving performance of an amperometric glucose biosensor. Biosens Bioelectron. 2002;17(10):851–857. doi: 10.1016/s0956-5663(02)00051-9. [DOI] [PubMed] [Google Scholar]
- 14.Betancor L, Lopez-Gallego F, Hidalgo A, Alonso-Morales N, Dellamora-Ortiz G, Guisan JM, Fernandez-Lafuente R. Preparation of a very stable immobilized biocatalyst of glucose oxidase from Aspergillus niger. J Biotechnol. 2006;121(2):284–289. doi: 10.1016/j.jbiotec.2005.07.014. [DOI] [PubMed] [Google Scholar]
- 15.Yu B, Moussy Y, Moussy F. Coil-type implantable glucose biosensor with excess enzyme loading. Front Biosci. 2005;10:512–520. doi: 10.2741/1547. [DOI] [PubMed] [Google Scholar]
- 16.Zhu H, Srivastava R, Brown JQ, McShane MJ. Combined physical and chemical immobilization of glucose oxidase in alginate microspheres improves stability of encapsulation and activity. Bioconjug Chem. 2005;16(6):1451–1458. doi: 10.1021/bc050171z. [DOI] [PMC free article] [PubMed] [Google Scholar]
- 17.Washko M, Rice EW. Determination of glucose by an improved enzymatic procedure. Clin Chem. 1961;7:542–545. [PubMed] [Google Scholar]
- 18.Bergmeyer H, Bernt E, editors. 2nd. New York:: Academic Press; 1974. Methods of enzymatic analysis. [Google Scholar]
- 19.Raabo E, Terkildsen T. On the enzymatic determination of blood glucose. Scand J Clin Lab Invest. 1960;12:402–407. doi: 10.3109/00365516009065404. [DOI] [PubMed] [Google Scholar]
- 20.Huggett AS, Nixon D. Use of glucose oxidase, peroxidase, and O-dianisidine in determination of blood and urinary glucose. Lancet. 1957;273(6991):368–370. doi: 10.1016/s0140-6736(57)92595-3. [DOI] [PubMed] [Google Scholar]
- 21.Zhou M, Diwu Z, Panchuk-Voloshina N, Haugland RP. A stable nonfluorescent derivative of resorufin for the fluorometric determination of trace hydrogen peroxide: applications in detecting the activity of phagocyte NADPH oxidase and other oxidases. Anal Biochem. 1997;253:162–168. doi: 10.1006/abio.1997.2391. [DOI] [PubMed] [Google Scholar]
- 22.Ward WK, Jansen LB, Anderson E, Reach G, Klein JC, Wilson GS. A new amperometric glucose microsensor: in vitro and short term in vivo evaluation. Biosens Bioelectron. 2002;17:181–189. doi: 10.1016/s0956-5663(01)00268-8. [DOI] [PubMed] [Google Scholar]