

Abstract
Background
Patients with noninsulin-treated type 2 diabetes were documented from diagnosis to determine whether patients taking up self-monitoring of blood glucose (SMBG) are distinct by baseline characteristics, exhibit a different natural disease course, and are treated differently.
Methods
The German multicenter, retrospective cohort study (ROSSO) followed 3268 persons from diagnosis of type 2 diabetes for a mean of 6.5 years. During follow-up, 1912 persons received oral antidiabetic agents (OAD) for at least 1 year, but no insulin. Data were retrieved from patient files of randomly contacted primary care practices.
Results
During follow-up, 742 patients (38.8%) began with SMBG prior to an end point. Initiation of SMBG was followed by improved glycemic control. Patients in the SMBG cohort were treated more often by an internist, younger by a mean of 3 years, and more often male (p < 0.001, each). A higher percentage of persons in the SMBG cohort were treated with metformin (74.7% vs 65.0%, p < 0.001) or changed OAD therapy (66.3% of patients vs 48.3% of patients, p < 0.001). SMBG was not accompanied by more comedication. In the SMBG cohort, 68 persons had a clinical end point (myocardial infarction, stroke, foot amputation, blindness, hemodialysis, or all-cause mortality) (9.2%) compared to 155 persons (13.2%) in the cohort without SMBG (p = 0.04 after multivariate adjustments).
Conclusion
This first large documentation of OAD-treated persons from diagnosis for 6.5 years indicates that the use of SMBG is associated with younger age at diagnosis, a higher prescription rate of metformin, more frequent changes of oral therapy, and a lower risk of a clinical end point.
Keywords: diabetes therapy, diabetic complications, epidemiology, mortality, self-monitoring of blood glucose, type 2 diabetes
Introduction
The possible benefit of self-monitoring of blood glucose (SMBG) in noninsulin-treated persons with type 2 diabetes has been the topic of several studies summarized in two position statements.1,2 Three recent meta-analyses of randomized trials came to the conclusion that SMBG as part of a multicomponent treatment strategy in noninsulin-treated type 2 diabetes led to significantly stronger reduction of HbA1c levels.3–5 Because none of the prospective studies extended beyond 1 year, the long-term outcome in relation to SMBG is not known.
Self-monitoring of blood glucose represents a diagnostic measure that by itself has no impact on disease course. Relevant for outcome are consequences taken because of SMBG results. These consequences include patient's attitude toward the disease, adaptation of lifestyle, or modification of antidiabetic therapy and appropriate education by the treating physician.6–10
The advantage of an observational trial is that it incorporates all of these SMBG-associated changes of attitude and treatment, as occurring in the unperturbed daily practice. In addition, long-term outcomes can be analyzed. The disadvantage is the lack of randomization, i.e., patient cohorts with or without SMBG differ somewhat in baseline characteristics, which may affect outcome. Therefore, nonrandomized studies are not suitable to prove a cause and effect relationship. Nevertheless, epidemiological studies can provide valuable information about the use of SMBG and associated outcomes. Relevant questions are whether patients performing SMBG are different by clinical or demographic characteristics and whether the use of SMBG is associated with different types of antidiabetic therapy prescribed or with extent and quality of comedication.
The German multicenter, retrospective cohort study (ROSSO) analyzed more than 3000 patients from diagnosis of type 2 diabetes for a mean of 6.5 years.11 The cohort comprised patients treated with diet only, with oral antidiabetic drugs (OAD), or with insulin. When all patients were analyzed together, the use of SMBG was associated with a lower risk of diabetes-related nonfatal events or death.11 The aim of this analysis was to evaluate the course of disease in OAD-treated patients of the ROSSO cohort and to identify SMBG-associated differences in patient characteristics, treatment, and outcome.
Materials and Methods
Subjects and Study Design
The design of ROSSO has been reported previously, as well as the participating centers of the ROSSO Study Group.11 In brief, a retrospective, comparative, epidemiological cohort study was performed in collaboration with 192 nonselected primary care practices throughout Germany. Of these practices, 143 (74.5%) were managed by a general practitioner and 49 (25.5%) by an internist. Based on patient files, data were collected from all patients diagnosed with type 2 diabetes between January 1, 1995 and December 31, 1999. Data were validated by monitors visiting the practices. Persons with a diabetes diagnosis prior to the age of 45 years or with a documented follow-up of less than 1 year were excluded.
Patients were followed from the time of diagnosis of diabetes until the end of 2003, or until death or loss to follow-up for other reasons (nine cases). The study protocol was submitted to the ethics committee of the General Medical Council of North-Rhine, Germany.
In total, 3268 patients were available for analyses. Predefined study end points were myocardial infarction, stroke, foot amputation, blindness (one or both eyes), end-stage renal failure requiring hemodialysis, and all-cause mortality. The composite end point included all of these events. End points were taken as documented in patient files. Analysis of nonfatal end points was based on the first event occurring in a patient during the observation period. The treating physician defined a patient as performing SMBG in any year based on the prescription of test strips and/or blood glucose data documented by the patient. Clinical chemistry data were from local laboratory analyses. Because HbA1c assays used by different practices were not standardized, all values were adjusted to 6.1% as the upper limit of the normal range of each laboratory.
Statistical Analyses
Differences in numeric baseline and follow-up data between patients with and without SMBG were assessed using two-sided t tests. A p value below 0.05 was considered statistically significant. Differences in incidence proportions of end points were analyzed with Fisher's exact test. Odds ratios for end points were calculated and adjusted to baseline variables with logistic regression. The main target variable was time from the date of diabetes diagnosis until a nonfatal or fatal end point (survival time). Survival analysis was performed based on Kaplan–Meier estimates. Differences in survival distribution were tested for statistical significance using the log-rank test. Estimates of hazard ratios (HR) and associated 95% confidence intervals (CI) were determined and adjusted for baseline variables by means of Cox regression based on the proportional hazard rate model. SMBG was the primary covariable, and various parameters with potential influence on the end points were further covariables. Statistical analyses were undertaken with SPSS+ for Windows, versions 11.5, 12.0, and 13.0.
Results
The ROSSO cohort comprised 3268 persons followed from diagnosis of type 2 diabetes. Of these, 1912 subjects received oral antidiabetic therapy (sulfonylureas, metformin, α-glucosidase inhibitor, glinides, glitazones) for at least 1 year but no insulin until the end of observation or until a first nonfatal end point. During this period, the use of SMBG for at least 1 year was documented for 38.8% of persons (n = 742), subsequently named the SMBG cohort. At diabetes diagnosis, biochemical and clinical baseline characteristics of the SMBG cohort were not significantly different from the no SMBG cohort except for higher diastolic (p = 0.02) but not systolic blood pressure (p = 0.32) (Table 1).
Table 1.
Baseline Characteristics of OAD-Treated Patients by Later SMBG Status
| Characteristic (mean ± SD) | OAD-treated patients | ||
|---|---|---|---|
| SMBG (n = 742)a | No SMBG (n = 1170) | P valueb | |
| Body mass index (kg/m2) | 29.7 ± 4.8 | 29.9 ± 5.2 | 0.486 |
| Systolic blood pressure (mm Hg) | 149.1 ± 20.6 | 150.1 ± 19.6 | 0.318 |
| Diastolic blood pressure (mm Hg) | 88.1 ± 11.9 | 86.8 ± 10.3 | 0.015 |
| Fasting blood glucose (mmol/l) | 9.5 ± 3.7 | 9.1 ± 3.3 | 0.071 |
| HbA1c (adjusted) (%)c | 7.7 ± 2.4 | 7.5 ± 1.8 | 0.150 |
| Total cholesterol (mmol/liter) | 6.0 ± 1.3 | 6.1 ± 1.2 | 0.205 |
| LDL cholesterol (mmol/liter) | 3.9 ± 1.0 | 3.9 ± 1.1 | 0.964 |
| HDL cholesterol (mmol/liter) | 1.3 ± 0.8 | 1.2 ± 0.4 | 0.089 |
| Trigycerides (mmol/liter) | 2.7 ± 1.9 | 2.6 ± 2.0 | 0.827 |
| Age (years) | 60.4 ± 8.7 | 63.4 ± 9.6 | <0.001 |
| Gender | |||
| Male-no. (%) | 417 (56.2%) | 549 (46.9%) | <0.001 |
| Female-no. (%) | 325 (43.8%) | 621 (53.1%) | |
| Qualification of treating physician | |||
| General practitioner | 522 (70.4%) | 902 (77.1%) | 0.001 |
| Internist | 220 (29.6%) | 268 (22.9%) | |
| Center size (diabetes type 2 patients 1995-1999) | |||
| ≤20 | 365 (49.2%) | 579 (49.5%) | 0.925 |
| >20 | 377 (50.8%) | 591 (50.5%) | |
| Center location | |||
| City | 362 (49.3%) | 646 (55.5%) | 0.009 |
| Small town | 372 (50.7%) | 518 (44.5%) | |
| Patient's habitation | |||
| City | 334 (45.0%) | 588 (50.3%) | 0.027 |
| Small town | 408 (55.0%) | 582 (49.7%) | |
| Health insurance | |||
| Public | 704 (94.0%) | 1134 (96.9%) | 0.028 |
| Private | 38 (5.1%) | 36 (3.1%) | |
| Smoker status | |||
| Smoker | 129 (17.3%) | 174 (14.9%) | 0.446 |
| Nonsmoker | 393 (53.0%) | 640 (54.6%) | |
| Previous smoker | 51 (6.9%) | 92 (7.9%) | |
| Unknown | 169 (22.8%) | 264 (22.6%) | |
Comprises patients with SMBG (documented for at least 1 year) during the observation period or prior to but not necessarily until a nonfatal end point.
P value for difference between the two subgroups (male sex distribution: Fisher's exact test; other variables: two-sided t test).
HbA1c adjusted to 6.1% as upper limit of normal range using the following formula: (HbA1c/upper limit of normal range) × 6.1.
Baseline differences between the two cohorts were noted with regard to some demographic factors, persons in the SMBG cohort were younger by a mean of 3 years, more often males, more often treated by an internist, lived more often not in a large city, and visited more often a center located in small town/rural areas (Table 1). Because only 74 of the 1912 patients were privately insured, their uneven distribution between the two cohorts did not affect any of the analyses described. There was no interaction between smoking status and use of SMBG (Table 1).
Information on the Initiation of SMBG
There was a continuous increase of the percentage of patients using SMBG from the year of diagnosis (10.0%) until year 7 (30.2%). The mean time from beginning SMBG to an end point was 2.8 years. Of patients in the SMBG cohort (set as 100%), 13% started with SMBG before and an additional 36% concomitant with OAD treatment and another 51% of patients took up SMBG only after therapy began.
Patients who initiated oral therapy and SMBG in the same year exhibited considerable deterioration of metabolic control before and substantial improvement after the start of OAD therapy and SMBG (Figures 1A and 1B). Patients who received OAD already for at least 1 year before the start of SMBG also showed some deterioration of metabolic control prior to and improvement after beginning SMBG (Figures 1C and 1D).
Figure 1.
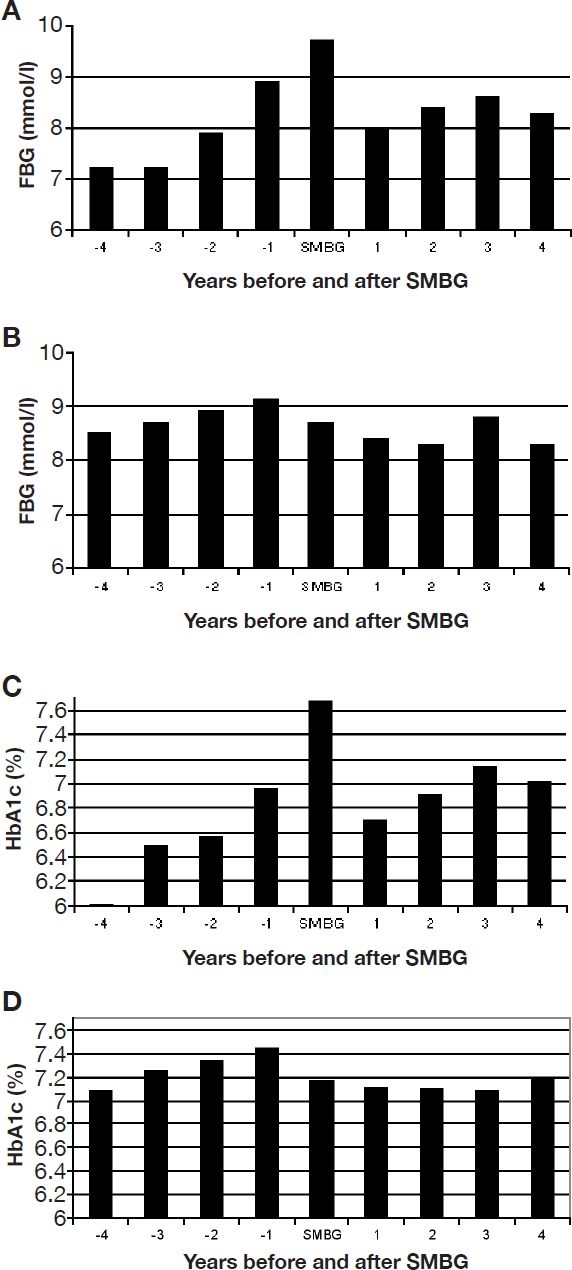
Glycemic control before and after the initiation of SMBG. All patients with the SMBG cohort were synchronized for the year of initiation of SMBG. The subgroup starting with OAD treatment and SMBG is shown in A for mean FBG and in C for mean HbA1c levels, adjusted to 6.1% as upper limit of normal range. The subgroup starting with SMBG only after OAD treatment for at least 1 year is shown in B (FBG) and D (HbA1c).
Because the initiation of SMBG was spread over several years from diagnosis, a comparison of metabolic control between the two cohorts was only meaningful from year 5 on when >75% of the patients in the SMBG cohort actually used SMBG. The means of fasting blood glucose (FBG) levels of years 5–7 were 8.3, 8.2, and 8.1 mmol/liter in the no SMBG cohort (baseline 9.1 mmol/liter) compared to 8.4, 8.4, and 8.1 mmol/liter in the SMBG cohort (baseline 9.4 mmol/liter). The means of HbA1c of years 5–7 were 7.1, 7.1, and 7.0% for the no SMBG cohort (baseline 7.5%) compared to 7.1, 7.1, and 7.0% for the SMBG cohort (baseline 7.7%). Taken together, the SMBG cohort had slightly poorer metabolic control at baseline and reached the level of the no SMBG cohort later on.
Antidiabetic Therapy in SMBG versus No SMBG Cohort
About two-thirds of patients received sulfonylurea in both cohorts, but metformin was prescribed more often to patients of the SMBG cohort (74.7% as compared to 65% in the no SMBG cohort, p < 0.001, Table 2). α-Glucosidase inhibitors were also prescribed more often to patients of the SMBG cohort (24.5% versus 19.7%, p = 0.02). Because less than 3% of patients received glinides or glitazones, a separate analysis was not conducted. OAD therapy of any type began about the same time in both cohorts (mean of 1.35 years from diagnosis in the SMBG cohort versus 1.49 years in the no SMBG cohort, p = 0.12). The mean time periods until introduction of sulfonylurea, metformin, α-glucosidase inhibitor, or any combination were comparable in the two cohorts (Table 2). However, there was a longer duration of treatment with sulfonylurea in the SMBG cohort. Also, the duration with treatment of combinations of oral agents was longer in the SMBG cohort. The combination seen most often was sulfonylurea + metformin (28.7% of patients of the SMBG group versus 24.8% of patients in the no SMBG group, p = 0.06). Finally, the type of pharmacological agents used for therapy was changed more often in the SMBG cohort, i.e., in 66.3% of patients compared to 48.3% of patients in the no SMBG cohort, p < 0.001 (Table 2).
Table 2.
Interaction of SMBG with Antidiabetic Therapy or Comedicationa
| Parameter | OAD-treated patients | ||
|---|---|---|---|
| SMBG (n = 742)a | No SMBG (n = 1170) | P valueb | |
| Patients treated with OAD during follow-up (single or combined) | |||
| Sulfonylurea | 508 (68.5%) | 786 (67.2%) | 0.581 |
| Metformin | 554 (74.7%) | 761 (65.0%) | <0.001 |
| α-Glucosidase inhibitor | 182 (24.5%) | 230 (19.7%) | 0.012 |
| Begin of antidiabetic therapy (mean years from diagnosis ± SD) | |||
| Sulfonylurea | 1.73 ± 2.09 | 1.93 ± 2.21 | 0.117 |
| Metformin | 2.39 ± 2.24 | 2.31 ± 2.15 | 0.500 |
| α-Glucosidase inhibitor | 1.92 ± 2.04 | 1.57 ± 2.02 | 0.080 |
| Any combination of these | 1.36 ± 1.78 | 1.50 ± 1.92 | 0.105 |
| Any OAD, single or combined | 1.35 ± 1.79 | 1.49 ± 1.91 | 0.117 |
| Duration of antidiabetic therapy (mean years ± SD) | |||
| Sulfonylurea | 4.61 ± 2.32 | 4.26 ± 2.38 | 0.009 |
| Metformin | 4.15 ± 2.14 | 4.04 ± 2.21 | 0.348 |
| α-Glucosidase inhibitor | 2.52 ± 2.33 | 3.46 ± 2.19 | 0.788 |
| Any combination of these | 5.11 ± 2.10 | 4.71 ± 2.24 | <0.001 |
| Any OAD, single or combined | 5.15 ± 2.06 | 4.73 ± 2.22 | <0.001 |
| Type of OAD changed or added during therapy | 66.3 | 48.3 | <0.001 |
| Antihypertensive drugs | |||
| % patients | 75.2 | 79.2 | 0.043 |
| Mean duration of treatment in years | 5.6 ± 2.3 | 5.7 ± 2.3 | 0.337 |
| Lipid-lowering drugs | |||
| % patients | 30.5 | 30.9 | 0.839 |
| Mean duration of treatment in years | 4.1 ± 2.5 | 4.2 ± 2.4 | 0.730 |
| Thrombocyte aggregation inhibitors | |||
| % patients | 11.9 | 10.2 | 0.258 |
| Mean duration of treatment in years | 2.8 ± 2.2 | 3.5 ± 2.3 | 0.035 |
Comedication had to be documented for at least 1 year. Lipid-lowering drugs comprised fibrates, statins, and rare other compounds. Antihypertensive drugs comprised diuretics, β blocker, angiotensin-converting enzyme inhibitors, angiotensin II type 1 receptor, and Ca antagonists.
Adjusted odd ratio 0.717 (CI: 0.523-0.982, p = 0.04), multivariate adjustment for baseline parameters: qualification of treating physician, center size, center location, patient's age, sex, habitation, health insurance, smoker status, macrovascular disease in anamnesis, fasting blood glucose, and triglycerides at diagnosis. Unadjusted odd ratio 0.661 (CI: 0.489-0.893, p = 0.007)
Comedication in SMBG versus No SMBG Cohort
Fewer patients in the SMBG cohort were treated with antihypertensive drugs as compared to the no SMBG cohort (75.2% versus 79.2%, p = 0.04, Table 2). No differences were observed with regard to prescriptions for lipid-lowering drugs or thrombocyte aggregation inhibitors (Table 2). The mean duration of treatment was comparable for antihypertensive or lipid-lowering therapy, whereas treatment with thrombocyte aggregation inhibitors was shorter in the SMBG cohort.
Follow-Up of Biochemical and Clinical Parameters
The two cohorts exhibited little differences with regard to the course of BMI, systolic and diastolic blood pressure, total and low-density lipoprotein (LDL) cholesterol, or triglycerides from diagnosis of diabetes (Figure 2). The possible impact of SMBG can be best analyzed from year 5 on, when >75% of patients in the SMBG cohort performed self-control. In comparison to baseline levels there was a trend toward better levels in the SMBG cohort for total cholesterol and diastolic blood pressure but not for other parameters.
Figure 2.
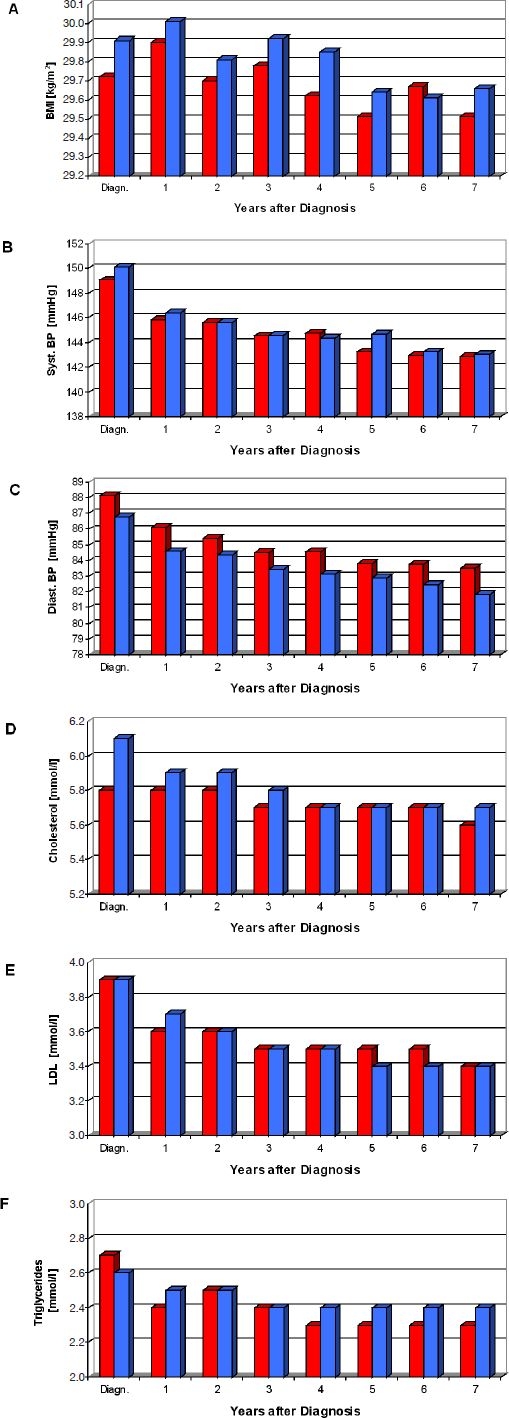
Follow-up of biochemical and clinical parameters. The time course of mean values of BMI (A), systolic (B) and diastolic (C) blood pressure, total (D) and LDL cholesterol (E), or triglycerides (F) is shown for the SMBG (red columns) and no SMBG (blue columns) cohorts.
Clinical Outcome in SMBG versus No SMBG Cohort
During the observation period, 223 patients (11.7%) experienced an end point. Of these patients, 155 had not performed SMBG prior to the event (Table 3). Odds ratios were calculated after multivariate adjustments for baseline parameters and showed a 28.3% reduction for the composite end point (p = 0.038). As shown in Table 3, the lower number of events in the SMBG group was primarily a consequence of a lower number of macrovascular end points and decreased mortality. At baseline, the SMBG cohort did not differ significantly from the no SMBG cohort for the prior occurrence of macrovascular events (myocardial infarction 3.8% vs 3.9%, stroke 2.4% vs 2.8%).
Table 3.
Long-Term Outcome in OAD-Treated Patients with Type 2 Diabetes
| Characteristic | OAD-treated patients | |
|---|---|---|
| SMBG (n = 742)a | No SMBG (n = 1170) | |
| Composite end points (n) | 68 (9.2%) b,c | 155 (13.2%) |
| Deathd (n) | 19 (2.6%) | 52 (4.4%) |
| Myocardial infarctiond (n) | 19 (2.6%) | 44 (3.8%) |
| Stroked (n) | 26 (3.5%) | 54 (4.6%) |
| Amputation (n) | 5 (0.7%) | 6 (0.5%) |
| Blindness (n) | 1 (0.1%) | 2 (0.2%) |
| Hemodialysisd | 3 (0.4%) | 9 (0.8%) |
Comprises patients with SMBG (documented for at least 1 year) during the observation period or prior to a nonfatal end point.
Unadjusted odds ratio 0.661 (CI: 0.489-0.893, p = 0.007).
Adjusted odds ratio 0.717 (CI: 0.523-0.982, p = 0.04), multivariate adjustment for baseline parameters: qualification of treating physician, center size, center location, patient's age, sex, habitation, health insurance, smoker status, macrovascular disease in anamnesis, fasting blood glucose, and triglycerides at diagnosis.
Eight patients (six non-SMBG, two SMBG) suffered nonfatal events before the fatal event [no SMBG: six patients (two myocardial infarction, one stroke, one myocardial infarction and stroke, two dialyses); SMBG: two patients (myocardial infarction)]. Eight patients without a fatal end point (five non-SMBG, three SMBG) had more than one nonfatal end point during follow-up. In the non-SMBG cohort, five patients had myocardial infarction and stroke, whereas in the SMBG cohort, two patients had myocardial infarction and stroke and one patient had stroke and dialysis.
Kaplan–Meier analysis (Figure 3) demonstrated superior survival regarding the composite end point for patients receiving OAD with SMBG over the entire observation period (p = 0.002), adjusted HR 0.69, 95% confidence interval 0.49–0.87, and p = 0.001.
Figure 3.
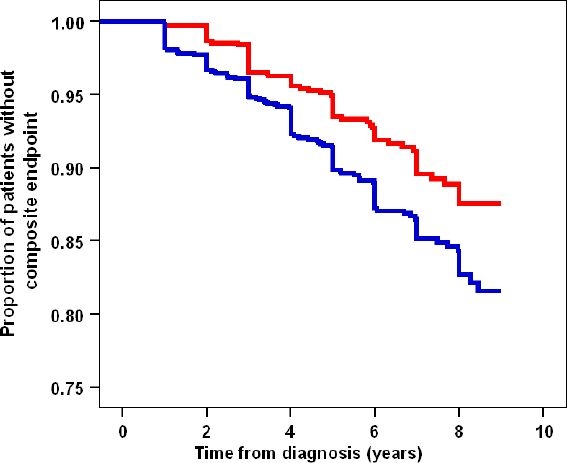
Kaplan–Meier survival curves for composite end points in OAD-treated patients with and without SMBG. The SMBG cohort is shown in red and the no SMBG cohort in blue. Patients with SMBG showed better survival throughout the observation period. Unadjusted log-rank test: p = 0.002, hazard ratio (unadjusted): 0.65 (95% CI: 0.49–0.87) and adjusted for all baseline parameters: 0.69 (95% CI: 0.51–0.92), p = 0.01.
Discussion
Within the first 8 years after diagnosis of type 2 diabetes, more than one-third of patients began self-monitoring of blood glucose before or during treatment with oral antidiabetic drugs. This figure was unexpected for Germany, as costs of SMBG are usually not reimbursed by public health insurances in the context of OAD therapy, except for possibly a low number of strips.
Is there is special “phenotype” of patients using SMBG in routine primary care? The major differences observed were that future SMBG users were younger by a mean of 3 years at diabetes diagnosis and were more often male than those not using SMBG during the observation period. There were only minor differences in disease characteristics at diagnosis. Although SMBG users were treated more often by an internist, a major influence of qualification of the treating physician was not recognizable, i.e., more than 70 % of patients were in the care of a practitioner in both cohorts.
The motivation to initiate SMBG probably came from a continuous worsening of glycemic control, as documented in the patient files. After the initiation of SMBG, both FBG and HbA1c declined to stable lower levels. The concomitant start of OAD therapy contributed to the improvement in glycemic control. Patients who started with SMBG while on OAD therapy also exhibited deterioration of metabolic control prior to the start of SMBG and improvement thereafter. This suggests a positive impact of SMBG on metabolic control in these patients but does not prove it. It would have been of interest to relate the changes in glycemic control to the frequency of self-monitoring, but such information was documented only rarely. It has been reported in another observational study that more frequent self-monitoring was associated with better levels of glycemic control.12 Another type of information not available from patient files was the occurrence of hypoglycemic episodes so that the relationship to initiation or use of SMBG could not be analyzed.
We searched for differences in pharmacological treatment in relation to SMBG status. Antidiabetic therapy was started at about the same time in the two cohorts when comparing the use of sulfonylurea, metformin, or α-glucosidase inhibitor. A higher percentage of patients in the SMBG cohort received metformin or α-glucosidase inhibitor. Most notably, types of OAD were changed or added significantly more often in the SMBG cohort. These differences in OAD therapy fit with the assumption that SMBG allows for more adaptation of antidiabetic therapy, although this may not be always the case.13
Treatment with drugs modulating the risks of macrovascular events, i.e., antihypertensive or lipid-lowering drugs and thrombocyte aggregation inhibitors, did not differ in favor of the SMBG cohort when the percentage of patients treated or the mean duration of treatment was compared. Although there is a higher awareness of the disease and its complications in patients using SMBG14 and a more intense interaction with treating doctors when showing diabetes diaries can be expected, this did not result in recognizable differences of comedication.
Of the 1912 OAD-treated persons analyzed, 223 (11.7%) experienced an end point. Of the latter, more than 80% were macrovascular end points, myocardial infarction, or stroke in both the SMBG and the no SMBG cohort. In the SMBG cohort the HR for an end point was 0.69 (compared to 1.0 for the no SMBG cohort) after adjustment for biochemical, clinical, and demographic differences between the two cohorts at diagnosis of type 2 diabetes, with logistic regression.
The modest differences in antidiabetic therapy may have contributed to the better prognosis in the SMBG cohort. More frequent adjustments of antidiabetic therapy may have contributed to improvement in metabolic control so that the initially higher levels of HbA1c and FBG levels in the SMBG cohort reached that of the no SMBG cohort. Metabolic control was assessed by FBG and HbA1c only and did not include postprandial glucose levels. Only the latter have been reported to be strong risk factors of macrovascular events in type 2 diabetes.15–22 Postprandial glucose is only poorly reflected by FBG or HbA1c.23–25
An additional factor to be considered is lifestyle. It has been reported previously that dietary and exercise habits have an impact on risk factors of cardiovascular events, such as serum levels of C-reactive protein, adiponectin, or postprandial glucose.26–30 A somewhat “healthier” lifestyle of patients performing SMBG is conceivable.31,32 We therefore assume that SMBG is associated with different dietary and exercise patterns, leading to a decrease of postprandial glycemia and concomitant oxidative stress in the vasculature. An alternative explanation that cannot be excluded is that persons who take up SMBG present with a different type of disease for genetic or other reasons.
Future randomized prospective trials should include documentation of patients' lifestyle and of postprandial blood glucose levels in order to assess the possible role of these parameters in translating SMBG into clinical benefit.
Abbreviations
- CI
confidence interval
- FBG
fasting blood glucose
- HR
hazard ratio
- LDL
low-density lipoprotein
- OAD
oral antidiabetic agents
- SMBG
self-monitoring of blood glucose
References
- 1.Ipp E, Aquino RL, Christenson P. Point: Self-monitoring of blood glucose in type 2 diabetic patients not receiving insulthe sanguine approach. Diabetes Care. 2005 Jun;28(6):1528–1530. doi: 10.2337/diacare.28.6.1528. [DOI] [PubMed] [Google Scholar]
- 2.Davidson MB. Counterpoint: Self-monitoring of blood glucose in type 2 diabetic patients not receiving insula waste of money. Diabetes Care. 2005 Jun;28(6):1531–1533. doi: 10.2337/diacare.28.6.1531. [DOI] [PubMed] [Google Scholar]
- 3.Sarol JN, Nicodemus NA, Tan KM, Grava MB. Self-monitoring of blood glucose as part of a multi-component therapy among non-insulin requiring type 2 diabetes patients: a meta-analysis (1966-2004) Curr Med Res Opin. 2005 Feb;21(2):173–184. doi: 10.1185/030079904X20286. [DOI] [PubMed] [Google Scholar]
- 4.Welschen LM, Bloemendal E, Nijpels G, Dekker JM, Heine RJ, Stalman WA, Bouter LM. Self-monitoring of blood glucose in patients with type 2 diabetes who are not using insula systematic review. Diabetes Care. 2005;28:1510–1517. doi: 10.2337/diacare.28.6.1510. [DOI] [PubMed] [Google Scholar]
- 5.Welschen LM, Bloemendal E, Nijpels G, Dekker JM, Heine RJ, Stalman WA, Bouter LM. Self-monitoring of blood glucose in patients with type 2 diabetes who are not using insulin. Cochrane Database Syst Rev. 2005;2 doi: 10.1002/14651858.CD005060.pub2. CD005060. [DOI] [PubMed] [Google Scholar]
- 6.Williams GC, Freedman ZR, Deci EL. Supporting autonomy to motivate patients with diabetes for glucose control. Diabetes Care. 1998 Oct;21(10):1644–1651. doi: 10.2337/diacare.21.10.1644. [DOI] [PubMed] [Google Scholar]
- 7.Glasgow RE, Anderson RM. In diabetes care, moving from compliance to adherence is not enough. Something entirely different is needed. Diabetes Care. 1999 Dec;22(12):2090–2092. doi: 10.2337/diacare.22.12.2090. [DOI] [PubMed] [Google Scholar]
- 8.Aljasem LI, Peyrot M, Wissow L, Rubin RR. The impact of barriers and self-efficacy on self-care behaviors in type 2 diabetes. Diabetes Educ. 2001 May–Jun;27(3):393–404. doi: 10.1177/014572170102700309. [DOI] [PubMed] [Google Scholar]
- 9.Williams GC, McGregor HA, Zeldman A, Freedman ZR, Deci EL. Testing a self-determination theory process model for promoting glycemic control through diabetes self-management. Health Psychol. 2004;23(1):58–66. doi: 10.1037/0278-6133.23.1.58. [DOI] [PubMed] [Google Scholar]
- 10.Renard E. Monitoring glycemic control: the importance of self-monitoring of blood glucose. Am J Med. 2005 Sep;118(Suppl 9A):12S–19S. doi: 10.1016/j.amjmed.2005.07.052. [DOI] [PubMed] [Google Scholar]
- 11.Martin S, Schneider B, Heinemann L, Lodwig V, Kurth HJ, Kolb H, Scherbaum WA. Self-monitoring of blood glucose in type 2 diabetes and long-term outcome: an epidemiological cohort study. Diabetologia. 2006 Feb;49(2):271–278. doi: 10.1007/s00125-005-0083-5. [DOI] [PubMed] [Google Scholar]
- 12.Karter AJ, Moffet HH, Liu J, Parker MM, Ahmed AT, Ferrara A, Selby JV. Achieving good glycemic control: initiation of new antihyperglycemic therapies in patients with type 2 diabetes from the Kaiser Permanente Northern California Diabetes Registry. Am J Manag Care. 2005 Apr;11(4):262–270. [PMC free article] [PubMed] [Google Scholar]
- 13.Stewart D, McCaig D, Davie A, Juroszek L, Blackwood L, Findlay N, McCarthy S. Glucose self-monitoring in primary care: a survey of current practice. J Clin Pharm Ther. 2004 Jun;29(3):273–277. doi: 10.1111/j.1365-2710.2004.00555.x. [DOI] [PubMed] [Google Scholar]
- 14.Franciosi M, Pellegrini F, De Berardis G, Belfiglio M, Cavaliere D, Di Nardo B, Greenfield S, Kaplan SH, Sacco M, Tognoni G, Valentini M, Nicolucci A QuED Study Group. The impact of blood glucose self-monitoring on metabolic control and quality of life in type 2 diabetic patients: an urgent need for better educational strategies. Diabetes Care. 2001 Nov;24(11):1870–1877. doi: 10.2337/diacare.24.11.1870. [DOI] [PubMed] [Google Scholar]
- 15.Hanefeld M, Fischer S, Julius U, Schulze J, Schwanebeck U, Schmechel H, Ziegelasch HJ, Lindner J. Risk factors for myocardial infarction and death in newly detected NIDDM: the Diabetes Intervention Study, 11-year follow-up. Diabetologia. 1996 Dec;39(12):1577–1583. doi: 10.1007/s001250050617. [DOI] [PubMed] [Google Scholar]
- 16.Heine RJ, Balkau B, Ceriello A, Del Prato S, Horton ES, Taskinen MR. What does postprandial hyperglycaemia mean? Diabet Med. 2004 Mar;21(3):208–213. doi: 10.1111/j.1464-5491.2004.01149.x. [DOI] [PubMed] [Google Scholar]
- 17.Ceriello A. Postprandial hyperglycemia and diabetes complications: is it time to treat? Diabetes. 2005 Jan;54(1):1–7. doi: 10.2337/diabetes.54.1.1. [DOI] [PubMed] [Google Scholar]
- 18.Karasik A. Glycaemic control is essential for effective cardiovascular risk reduction across the type 2 diabetes continuum. Ann Med. 2005;37(4):250–258. doi: 10.1080/07853890510037365. [DOI] [PubMed] [Google Scholar]
- 19.Home P. Contributions of basal and post-prandial hyperglycaemia to micro- and macrovascular complications in people with type 2 diabetes. Curr Med Res Opin. 2005 Jul;21(7):989–998. doi: 10.1185/030079905x49662. [DOI] [PubMed] [Google Scholar]
- 20.Gerich JE. The importance of tight glycemic control. Am J Med. 2005 Sep;118(Suppl 9A):7S–11S. doi: 10.1016/j.amjmed.2005.07.051. [DOI] [PubMed] [Google Scholar]
- 21.Hanefeld M, Schaper F. Prandial hyperglycemia: is it important to track and treat? Curr Diab Rep. 2005 Oct;5(5):333–339. doi: 10.1007/s11892-005-0090-4. [DOI] [PubMed] [Google Scholar]
- 22.Cavalot F, Petrelli A, Traversa M, Bonomo K, Fiora E, Conti M, Anfossi G, Costa G, Trovati M. Postprandial blood glucose is a stronger predictor of cardiovascular events than fasting blood glucose in type 2 diabetes mellitus, particularly in women. Lessons from the San Luigi Gonzaga Diabetes Study. J Clin Endocrinol Metab. 2006 Mar;91(3):813–819. doi: 10.1210/jc.2005-1005. [DOI] [PubMed] [Google Scholar]
- 23.Jeffcoate SL. Diabetes control and complications: the role of glycated haemoglobin, 25 years on. Diabet Med. 2004 Jul;21(7):657–665. doi: 10.1046/j.1464-5491.2003.01065.x. [DOI] [PubMed] [Google Scholar]
- 24.Landgraf R. The relationship of postprandial glucose to HbA1c. Diabetes Metab Res Rev. 2004 Nov–Dec;20(Suppl 2):S9–S12. doi: 10.1002/dmrr.517. [DOI] [PubMed] [Google Scholar]
- 25.Shibata K, Suzuki S, Sato J, Ohsawa I, Goto S, Iritani I, Tokudome S. Diagnostic accuracy of glycohemoglobin A1c (HbA1c) for postprandial hyperglycemia was equivalent to that of fasting blood glucose. J Clin Epidemiol. 2005 Oct;58(10):1052–1057. doi: 10.1016/j.jclinepi.2005.01.019. [DOI] [PubMed] [Google Scholar]
- 26.Libby P. Inflammation and cardiovascular disease mechanisms. Am J Clin Nutr. 2006 Feb;83(2):456S–460S. doi: 10.1093/ajcn/83.2.456S. [DOI] [PubMed] [Google Scholar]
- 27.Kasim-Karakas SE, Tsodikov A, Singh U, Jialal I. Responses of inflammatory markers to a low-fat, high-carbohydrate diet: effects of energy intake. Am J Clin Nutr. 2006 Apr;83(4):774–779. doi: 10.1093/ajcn/83.4.774. [DOI] [PubMed] [Google Scholar]
- 28.Gable DR, Hurel SJ, Humphries SE. Adiponectin and its gene variants as risk factors for insulin resistance, the metabolic syndrome and cardiovascular disease. Atherosclerosis. 2006 Oct;188(2):231–244. doi: 10.1016/j.atherosclerosis.2006.02.010. [DOI] [PubMed] [Google Scholar]
- 29.Neschen S, Morino K, Rossbacher JC, Pongratz RL, Cline GW, Sono S, Gillum M, Shulman GI. Fish oil regulates adiponectin secretion by a peroxisome proliferator-activated receptor-gamma-dependent mechanism in mice. Diabetes. 2006 Apr;55(4):924–928. doi: 10.2337/diabetes.55.04.06.db05-0985. [DOI] [PubMed] [Google Scholar]
- 30.Leiter LA, Ceriello A, Davidson JA, Hanefeld M, Monnier L, Owens DR, Tajima N, Tuomilehto J International Prandial Glucose Regulation Study Group. Postprandial glucose regulation: new data and new implications. Clin Ther. 2005;27(Suppl B):S42–56. doi: 10.1016/j.clinthera.2005.11.020. [DOI] [PubMed] [Google Scholar]
- 31.Siebolds M, Gaedeke O, Schwedes U SMBG Study Group. Self-monitoring of blood glucose—psychological aspects relevant to changes in HbA(1c) in type 2 diabetic patients treated with diet or diet plus OAD medication. Patient Educ Couns. 2006 Jul;62(1):104–110. doi: 10.1016/j.pec.2005.06.013. [DOI] [PubMed] [Google Scholar]
- 32.Gilden JL, Casia C, Hendryx M, Singh SP. Effects of self-monitoring of blood glucose on quality of life in elderly diabetic patients. J Am Geriatr Soc. 1990 May;38(5):511–515. doi: 10.1111/j.1532-5415.1990.tb02399.x. [DOI] [PubMed] [Google Scholar]