

Abstract
Background
This study investigated continuous glucose profiles in nondiabetic subjects.
Methods
Continuous interstitial glucose measurement was performed under everyday life conditions (2 days) and after ingestion of four meals with standardized carbohydrate content (50 grams), but with different types of carbohydrates and variable protein and fat content. Twenty-four healthy volunteers (12 female, 12 male, age 27.1 ± 3.6 years) participated in the study. Each subject wore two microdialysis devices (SCGM1, Roche Diagnostics) simultaneously.
Results
The mean 24-hour interstitial glucose concentration under everyday life conditions was 89.3 ± 6.2 mg/dl (mean ± SD, n = 21), and mean interstitial glucose concentrations at daytime and during the night were 93.0 ± 7.0 and 81.8 ± 6.3 mg/dl, respectively. The highest postprandial glucose concentrations were observed after breakfast: 132.3 ± 16.7 mg/dl (range 101–168 mg/dl); peak concentrations after lunch and dinner were 118.2 ± 13.4 and 123.0 ± 16.9 mg/dl, respectively. Mean time to peak glucose concentration was between 46 and 50 minutes. After ingestion of standardized meals with fast absorption characteristics, peak interstitial glucose concentrations were 133.2 ± 14.4 and 137.2 ± 21.1 mg/dl, respectively. Meals with a higher fiber, protein, and fat content induced a smaller increase and a slower decrease of postprandial glucose concentrations with peak values of 99.2 ± 10.5 and 122.1 ± 20.4 mg/dl, respectively.
Conclusions
This study provided continuous glucose profiles in nondiabetic subjects and demonstrated that differences in meal composition are reflected in postprandial interstitial glucose concentrations. Regarding the increasing application of continuous glucose monitoring in diabetic patients, these data suggest that detailed information about the ingested meals is important for adequate interpretation of postprandial glucose profiles.
Keywords: continuous glucose monitoring, continuous glucose profiles, healthy subjects, interstitial fluid glucose, postprandial glucose
Introduction
Tight glycemic control has been shown to reduce the risk of complications in patients with type 1 and type 2 diabetes.1,2 Frequent blood glucose (BG) measurements are an integral part of intensive diabetes management; however, therapy adjustment is still based on few single spot glucose values. Several devices for continuous glucose measurement in the subcutaneous tissue, using needle-type glucose sensors or the microdialysis technique, have become available. Contradictory results have been published concerning the relationship between blood glucose and interstitial fluid glucose levels3–6; however, several studies have suggested that differences between blood glucose and interstitial glucose concentrations seem to be negligible.3,7,8 Some investigators have reported that differences between interstitial glucose concentrations and blood glucose concentrations seem to increase during rapid changes of glucose concentrations8–10 with a time delay of tissue glucose changes versus blood glucose changes of about 2–10 minutes,7,11,12 whereas another published study found no significant difference between interstitial fluid glucose and capillary blood glucose concentrations during an oral glucose load.13 Regarding the increasing clinical application of continuous glucose monitoring devices, detailed knowledge about postprandial interstitial glucose excursions in nondiabetic subjects is essential for the interpretation of postprandial tissue glucose traces in diabetic patients. This study investigated continuous glucose profiles in healthy subjects by means of the microdialysis technique under everyday life conditions and after ingestion of meals with a standardized amount of carbohydrates, but with different glycemic indices and variable fiber, protein, and fat content.
Subjects and Methods
Study Subjects
The study was performed in 24 healthy volunteers [12 female, 12 male, age 27.1 ± 3.6 years, body mass index (BMI) 22.6 ± 1.7 kg/m2] enrolled after an initial screening visit at the study site. Inclusion criteria were age 18–35 years and BMI <25 kg/m2. Exclusion criteria were diabetes, impaired fasting glucose or impaired glucose tolerance, acute or severe chronic illness, pregnancy or lactation, medication with anticoagulants, suspected alcohol or drug abuse, and severe allergic condition. During the initial screening visit, a 75-gram oral glucose tolerance test (Dextro, O.G-T. Roche-Hoffmann-La Roche AG, Grenzach-Wyhlen, Germany) was performed to exclude diabetes, impaired fasting glucose, or impaired glucose tolerance. Glucose concentrations were measured in duplicate in hemolyzed capillary blood samples: 0 minute 76.7 ± 4.6 mg/dl, 30 minutes 137.5 ± 18.8 mg/dl, 60 minutes 137.2 ± 25.9 mg/dl, 90 minutes 112.7 ± 20.7 mg/dl, 120 minutes 105.6 ± 13.5 mg/dl, 150 minutes 89.4 ± 15.6 mg/dl, and 180 minutes 75.6 ± 17.2 mg/dl (means ± SD, n = 24); inclusion criteria were glucose 0 minutes <90 mg/dl and glucose 120 minutes <140 mg/dl. All study participants exhibited normal values for HbA1c (5.0 ± 0.2%), fasting concentrations of insulin (42.4 ± 16.0 pmol/liter), C-peptide (0.59 ± 0.17 nmol/liter), proinsulin (3.5 ± 2.3 pmol/liter), lipids (total cholesterol 4.6 ± 0.7 mmol/liter, high-density lipoprotein cholesterol 1.3 ± 0.3 mmol/liter, low-density lipoprotein cholesterol 2.9 ± 0.7 mmol/liter, triglycerides 0.8 ± 0.3 mmol/liter), creatinine (86.4 ± 12.6 µmol/liter), uric acid (272.2 ± 58.6 µmol/liter), liver enzymes, and hematology parameters.
Prior to participation in the study, all subjects gave their informed consent. The study was approved by the local ethical committee (University Ulm, Germany, Study Number 105/2005) and was performed in accordance with the Declaration of Helsinki (revised version, Tokyo 2004), Guidelines for proper conduct of clinical trials in the European Union Good Clinical Practice, Guidelines of the International Conference on Harmonisation, and the German Medical Device Act.
Experimental Protocol
Study participants arrived at the study site between 4:00 and 6:00 PM on day 1. After physical examination and repeated evaluation of inclusion and exclusion criteria, two microdialysis catheters (CMA-60, CMA Microdialysis, Solna, Sweden) were placed in the abdominal subcutaneous tissue for continuous glucose monitoring (subcutaneous continuous glucose monitor, SCGM1, Roche Diagnostics, Mannheim, Germany). On days 2 and 3, subjects received standardized meals for breakfast (7:30 AM, meals 1 and 3) and lunch (12:30 PM, meals 2 and 4), and free choice dinner (6:00 PM) from a buffet. The four meals contained equal carbohydrate amounts (50 grams); meals 1 and 2 were supposed to exhibit fast absorption characteristics, whereas meals 3 and 4 were supposed to exhibit slow absorption characteristics because of lower glycemic indices of the components, as well as higher fiber, protein, and fat content (Table 1). In the evening of day 3, study participants left the study site and followed their usual daily routine at home until the evening of day 5. Subjects were asked to have breakfast, lunch, and dinner at the same time points as on days 2 and 3 (7:30 AM, 12:30 PM, 6:00 PM) and to take pictures of the ingested meals for retrospective estimation of the meal composition (Table 2).
Table 1.
Composition of Standardized Meals
| Meal 1 | Meal 2 | Meal 3 | Meal 4 | |
|---|---|---|---|---|
| Composition | Rice pudding with sugar and cinnamon | Toast, honey, jam, curd cheese, orange juice | Kidney beans, wholemeal bread, salami, cheese | Grilled salmon, broccoli, carrots, wild rice, cream |
| Total weight | 258 g | 235 g | 325 g | 493 g |
| Total energy | 271 kcal | 252 kcal | 750 kcal | 778 kcal |
| Carbohydrates | 50.5 g 74.6% | 50.1 g 79.6% | 50.2 g 26.8% | 51.0 g 26.2% |
| Protein | 9.6 g 14.2% | 7.4 g 11.7% | 30.9 g 16.5% | 39.8 g 20.5% |
| Fat | 3.4 g 11.2% | 2.4 g 8.6% | 47.3 g 56.7% | 46.1 g 53.3% |
| Fiber | 0.8 g | 1.6 g | 12.8 g | 7.4 g |
Table 2.
Composition of Meals under Everyday Life Conditionsa
| Breakfast | Lunch | Dinner | |
|---|---|---|---|
| Total energy | 619 ± 266 kcal | 786 ± 324 kcal | 887 ± 383 kcal |
| Carbo-hydrates | 84.2 ± 39.2 g 56.5 ± 11.2% | 74.0 ± 37.9 g 39.6 ± 13.3% | 94.9 ± 35.5 g 45.9 ± 11.1% |
| Protein | 19.7 ± 10.0 g 13.0 ± 5.6% | 34.6 ± 13.1 g 18.6 ± 5.2% | 40.1 ± 17.1 g 18.5 ± 4.6% |
| Fat | 21.2 ± 11.9 g 30.5 ± 10.8% | 37.6 ± 19.8 g 41.8 ± 12.7% | 37.9 ± 25.0 g 35.6 ± 10.9% |
Data are means ± SD (n = 21).
In the evening of day 5, study participants came to the study site for removal of the subcutaneous glucose monitoring devices, and after a final physical examination the study was finished at about 9:00 PM.
For calibration of the continuous glucose monitoring devices, 16 capillary BG measurements per day were performed in duplicate: 3:00 AM, 6:30 AM, 7:30 AM, 8:30 AM, 9:30 AM, 10:30 AM, 12:30 AM, 1:30 PM, 2:30 PM, 3:30 PM, 5:00 PM, 6:00 PM, 7:00 PM, 8:00 PM, 9:00 PM, and 10:00 PM. In addition, after ingestion of meals 1 and 3 (for breakfast on days 2 and 3), frequent venous blood samples were drawn for comparative determination of venous BG concentrations (7:30–8:30 AM: every 10 minutes; 8:30–9:30 AM: every 15 minutes; 9:30 AM–12:30 PM: every 30 minutes).
Subcutaneous Continuous Glucose Monitoring
The subcutaneous continuous glucose monitor (SCGM1, Roche Diagnostics) is based on the microdialysis technique. The microdialysis catheter (CMA-60, CMA Microdialysis) is connected to the glucose monitoring device via short tubing. The microdialysis catheter is perfused with Ringer's solution at a flow rate of 0.3 µl/min, and the glucose oxidase solution is added to the dialysate before entering the glucose sensor chamber, as described in detail elsewhere.14,15 Time-averaged glucose signals are recorded every minute, enabling high temporal resolution recordings of interstitial glucose concentrations. Because of the low perfusion rate, a full equilibrium across the membrane is believed to occur.3,8 The physical lag time of the system is approximately 38 minutes. The SCGM1 device allows continuous interstitial glucose monitoring for up to 5 days. In this study, each subject wore two SCGM1 devices simultaneously, and glucose measurements were started after a run-in phase of about 12 hours.
For calibration of the SCGM1 devices, 16 capillary BG measurements per day were performed in duplicate using the Accu-Chek Active system (Roche Diagnostics, Mannheim, Germany; Accu-Chek is a trademark of Roche), which is integrated in the SCGM1 device and calibrated for whole blood glucose. The model for retrospective calibration of the SCGM1 devices comprised intercept and slope parameters, compensation of the system drift, and a correction of the physical lag time. In order to achieve a continuous signal as reliable as possible, a method was developed that generated a single glucose curve, taking into account the signals of the two SCGM1 systems used simultaneously in one subject and the capillary blood glucose measurements. The single glucose curves were merged into one with weighting factors depending on the reliability of the single curves at each moment; these factors were derived from the deviation between the single curves and the reference curve, generated from reference blood glucose concentrations by cubic splining. This procedure allowed one single system glucose curve to overrule the other system's signal when the latter was disturbed. The mean absolute relative error of the single systems was 11.0 ± 12.3%; Clarke error grid analysis showed that, compared to capillary blood glucose measurements, 89.2% out of 2349 single SCGM1 system results were in region A, 9.6% in region B, 0.2% in region C, 1.0% in region D, 0.0% in region E, and 98.8% in regions A and B.
No serious adverse events or device effects were observed during the study. Mild side effects included catheter site erythema, discrete catheter site inflammation, and mild catheter site pain. In three study participants, data were not available during the whole duration of the experiment because of technical failure of the SCGM1 devices. Technical failure of the devices was not related to skin fold thickness.
Laboratory Methods
During the oral glucose tolerance test, capillary blood samples from the finger tip were drawn in duplicate and glucose concentrations were measured in hemolyzed samples using the glucose oxidase method (Ecomatic, Care Diagnostica, Voerde, Germany). HbA1c was measured in whole blood using a latex immunoagglutination inhibition method (DCA 2000®, Bayer Diagnostics Europe, Dublin, Ireland). C-peptide, insulin, proinsulin, clinical chemistry, hematology, and hemostaseology parameters were measured with routine methods: serum C-peptide and insulin—ElectroChemiLuminescence ImmunoAssays (Modular Analytics E 170, Roche Diagnostics, Mannheim, Germany; Modular is a trademark of Roche); proinsulin—enzyme-linked immunosorbent assay (IBL, Hamburg, Germany); lipid profiles and other clinical chemistry parameters—Dimension® RxL Max (Dade Behring, Liederbach, Germany); blood cell count—LH 750 (Beckman Coulter, Palo Alto, CA); and hemostaseology—BCS (Dade Behring, Liederbach, Germany). After ingestion of meals 1 and 3, venous BG concentrations were measured in duplicate using the Accu-Chek Compact device (calibrated for whole blood glucose; Roche Diagnostics).
Statistical Analysis
Results are given as means ± SD, unless stated otherwise. Mean interstitial glucose values under everyday life conditions were obtained by first calculating the mean 24-hour glucose profile out of 2 days monitoring per study subject and then calculating the mean of the study subjects. Differences between areas under the curve (AUC) of postprandial interstitial glucose traces were evaluated by one-way analysis of variance, followed by the Scheffé test.
Results
Everyday Life Conditions
Continuous interstitial glucose profiles under everyday life conditions were available in 21 out of 24 healthy subjects; in the remaining 3 study participants, data were not available because of technical failure of the glucose monitoring devices. Representative 24-hour glucose traces of 2 study participants are shown in Figure 1. The mean 24-hour interstitial glucose trace under everyday life conditions is shown in Figure 2. The mean 24-hour interstitial glucose concentration was 89.3 ± 6.2 mg/dl (range 79.2–101.3 mg/dl), with a mean glucose concentration of 93.0 ± 7.0 mg/dl at daytime (7 AM to 11 PM) and 81.8 ± 6.3 mg/dl during the night (11 PM to 7 AM).
Figure 1.
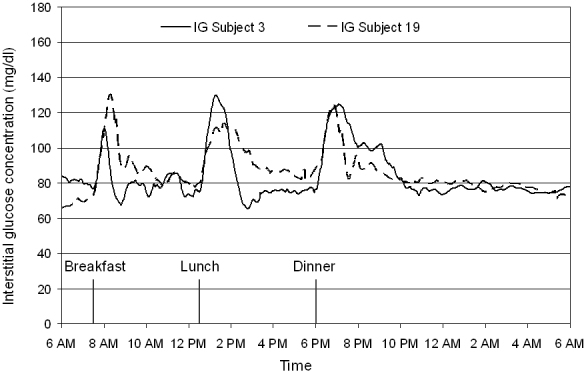
Representative continuous interstitial fluid glucose traces obtained in study subjects 3 and 19 under everyday life conditions by means of the microdialysis technique.
Figure 2.
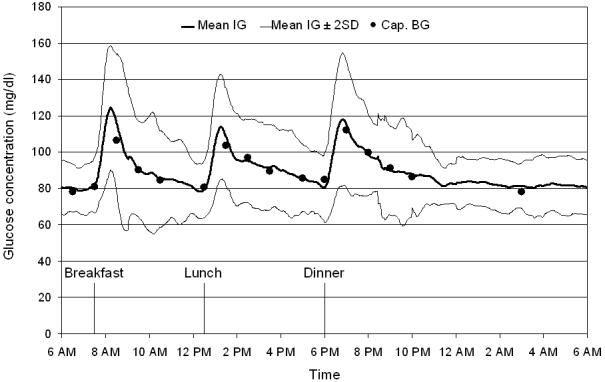
Mean continuous IG trace obtained in healthy volunteers under everyday life conditions by means of the microdialysis technique. Mean interstitial glucose trace ± 2 SD (corresponding to the 95% range), n = 21; Cap. BG: capillary blood glucose values, used for calibration of the continuous glucose monitoring device.
The mean 24-hour capillary blood glucose concentration was 90.9 ± 6.8 mg/dl (16 values per 24 hours), and mean blood glucose concentrations at daytime and during the night were 92.7 ± 6.9 mg/dl (14 values per day) and 78.1 ± 7.9 mg/dl (2 values per night).
Minimum and maximum interstitial glucose values, observed under everyday life conditions, were 59 and 168 mg/dl, respectively. The percentage of time spent in different glucose ranges is shown in Figure 3.
Figure 3.
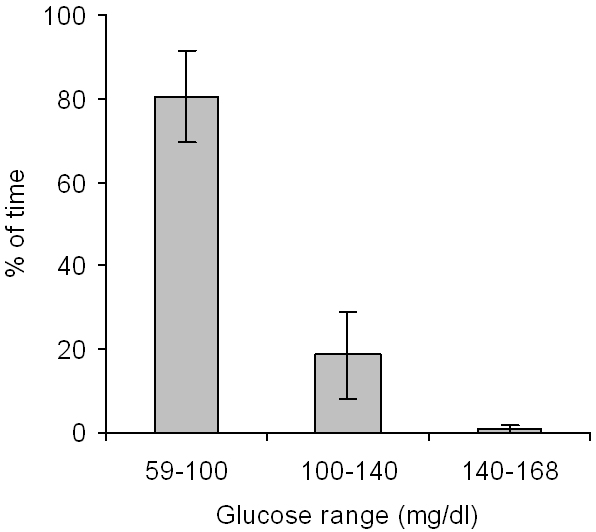
Percentage of time spent in different glucose ranges under everyday life conditions (means ± SD, n = 21).
Preprandial and postprandial interstitial glucose concentrations after the ingestion of free choice meals under everyday life conditions are shown in Table 3; postprandial AUC are shown in Figure 4.
Table 3.
Interstitial Glucose Concentrations and Time to Peak Glucose Value after Ingestion of Free Choice Meals under Everyday Life Conditionsa
| Breakfast | Lunch | Dinner | |
|---|---|---|---|
| Premeal glucose | 82.1 ± 7.9 mg/dl | 79.4 ± 8.0 mg/dl | 80.4 ± 9.8 mg/dl |
| Peak glucose | 132.3 ± 16.7 mg/dl | 118.2 ± 13.4 mg/dl | 123.0 ± 16.9 mg/dl |
| Range of peak glucose | 101-168 mg/dl | 95-143 mg/dl | 98-160 mg/dl |
| Glucose increase | 50.2 ± 14.5 mg/dl | 38.8 ± 11.2 mg/dl | 42.6 ± 18.7 mg/dl |
| Time to peak | 46.0 ± 11.8 min | 47.1 ± 11.5 min | 49.6 ± 17.0 min |
Data are means ± SD (n = 21).
Figure 4.
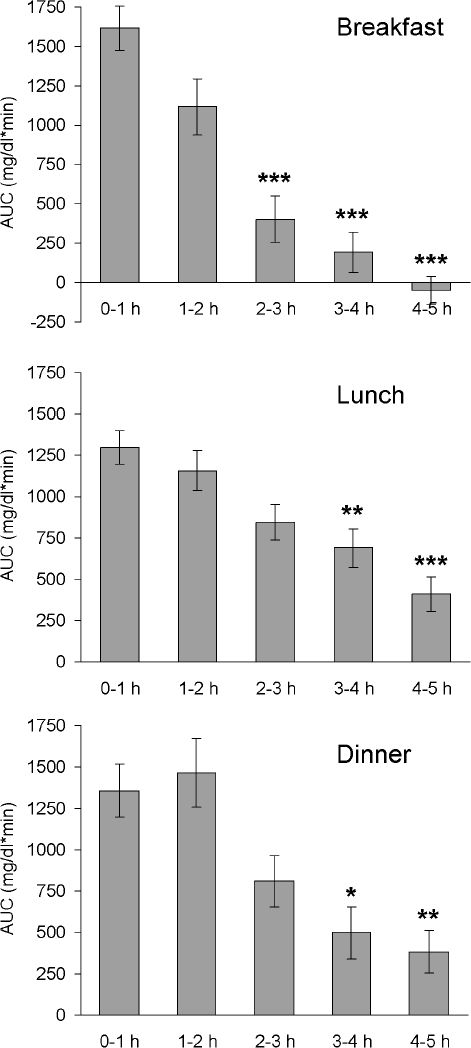
Areas under the curve (above baseline) after intake of free choice meals under everyday life conditions. Mean AUC ± SEM: AUC 0-1, 1-2, 2-3, 3-4, and 4-5 hours after start of meal (n = 21); *P < 0.05, **P < 0.01, ***P < 0.001 versus AUC 0-1 hour.
Premeal capillary BG concentrations were 80.9 ± 7.8, 80.8 ± 6.8, and 84.8 ± 8.4 mg/dl before breakfast, lunch, and dinner, respectively.
Standardized Meals
Mean interstitial glucose traces after the ingestion of standardized meals, as well as AUC of postmeal glucose traces, are shown in Figure 5. Meal 1 (rice pudding with sugar and cinnamon, 7:30 AM) and meal 2 (toast, honey, jam, curd cheese, orange juice, 12:30 PM), both supposed to exhibit fast absorption characteristics, induced a higher and shorter-lasting increase in glucose concentrations than meal 3 (kidney beans, wholemeal bread, salami, cheese, 7:30 AM) and meal 4 (grilled salmon, broccoli, carrots, wild rice, cream, 12:30 PM), which were supposed to exhibit slow absorption characteristics. Especially after ingestion of meal 3, significantly lower postprandial glucose values and AUC were observed. Data are shown in Table 4 and Figure 5.
Figure 5.
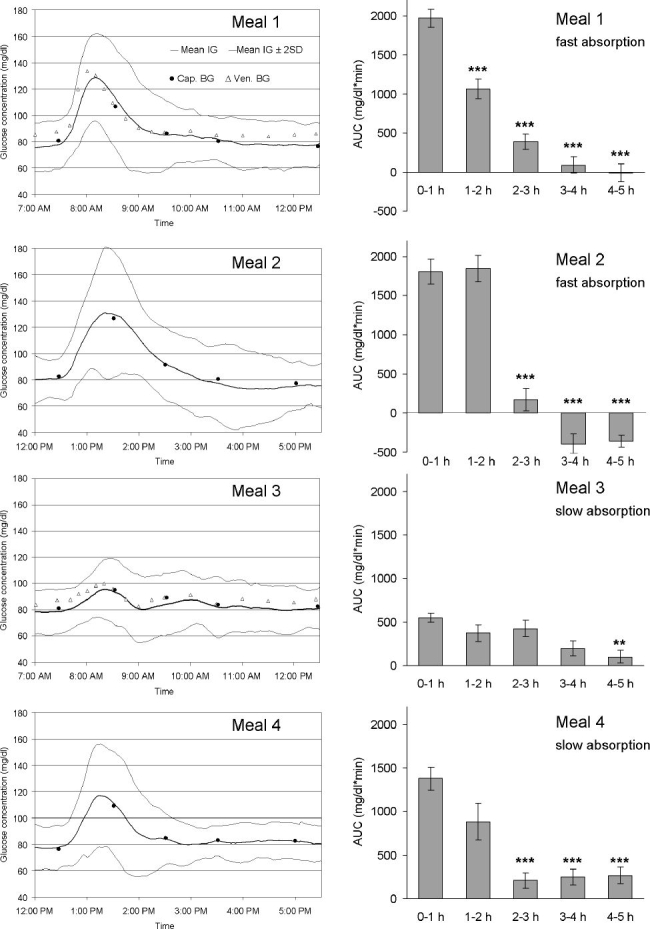
(Left) Mean continuous IG trace obtained by the microdialysis technique in healthy volunteers after ingestion of meals with identical carbohydrate amount, but with different fiber, protein, and fat content. Mean interstitial glucose trace ± 2 SD (corresponding to the 95% range), n = 23; Cap. BG: capillary blood glucose values, used for calibration of the tissue glucose monitoring device; Ven. BG: venous blood glucose values. Meal 1: rice pudding with sugar and cinnamon; meal 2: toast, honey, jam, curd cheese, and orange juice; meal 3: kidney beans, wholemeal bread, salami, cheese; and meal 4: grilled salmon, broccoli, carrots, wild rice, and cream. (Right) Areas under the curve (above baseline) after intake of standardized meals. Mean AUC ± SEM: AUC 0-1, 1-2, 2-3, 3-4, and 4-5 hours after start of meal (n = 23); **P < 0.01, ***P < 0.001 versus AUC 0-1 hour.
Table 4.
Interstitial Glucose Concentrations and Time to Peak Glucose Value after Ingestion of Standardized Meals with Identical Amount of Carbohydrates, but Different Types of Carbohydrates and Different Protein and Fat Contenta
| MEAL 1 7:30 AM | MEAL 2 12:30 PM | MEAL 3 7:30 AM | MEAL 4 12:30 PM | |
|---|---|---|---|---|
| Rice pudding with sugar and cinnamon | Toast, honey, jam, curd cheese, orange juice | Kidney beans, wholemeal bread, salami, cheese | Grilled salmon, broccoli, carrots, wild rice, cream | |
| Premeal glucose | 78.3 ± 9.3 mg/dl | 81.4 ± 8.0 mg/dl | 79.0 ± 8.4 mg/dl | 78.4 ± 7.9 mg/dl |
| Peak glucose | 133.2 ± 14.4 mg/dl | 137.2 ± 21.1 mg/dl | 99.2 ± 10.5 mg/dl | 122.1 ± 20.4 mg/dl |
| Range of peak glucose | 111-162 mg/dl | 103-171 mg/dl | 79-115 mg/dl | 86-168 mg/dl |
| Glucose increase | 54.8 ± 11.9 mg/dl | 55.8 ± 21.7 mg/dl | 20.2 ± 7.2 mg/dl | 43.7 ± 20.5 mg/dl |
| Range, glucose increase | 38-80 mg/dl | 19-92 mg/dl | 7-37 mg/dl | 5-85 mg/dl |
| Time to peak | 42.7 ± 10.8 min | 59.0 ± 16.7 min | 57.5 ± 24.5 min | 54.6 ± 18.4 min |
Data are means ± SD (n = 23).
Discussion
This study investigated continuous interstitial fluid glucose profiles in healthy subjects by means of the microdialysis technique. Each subject wore two glucose sensors simultaneously. The two continuous glucose traces were merged to one curve by a standardized procedure in order to exclude technical artifacts as far as possible. Calibration was performed with 16 blood glucose measurements per day.
Under everyday life conditions, the mean 24-hour interstitial fluid glucose concentration was about 90 mg/dl and the mean fasting glucose concentration was about 80 mg/dl. The highest postprandial increase in interstitial glucose concentrations was observed after breakfast (peak 132.3 ± 16.7 mg/dl, range 101–168 mg/dl), and mean time to peak glucose was between 46 and 50 minutes. Previous studies investigating blood glucose concentrations in healthy subjects have demonstrated similar results for fasting glucose and postprandial peak glucose levels.16–19 To our knowledge, only few data about continuous glucose profiles in nondiabetic subjects are available.20–23 Continuous interstitial fluid glucose monitoring using a needle-type glucose sensor (CGMS®, Medtronic MiniMed) showed an average glucose value of 95.4 mg/dl in normal individuals with peak and nadir glucose levels of 140.4 ± 25.2 and 70.2 ± 12.6 mg/dl23; in pregnant women a mean interstitial fluid glucose concentration of 83.7 ± 18 mg/dl and a mean postprandial peak glucose concentration of 110.1 ± 16 mg/dl were observed.22 Investigation of postprandial glucose concentrations using two viscosimetric affinity sensors, one placed in the forearm and the other one in the abdominal tissue, showed similar results for venous blood glucose values and interstitial glucose values with a mean peak tissue glucose concentration of about 120 mg/dl.21
In our study, tissue glucose concentrations in nondiabetic subjects were below 140 mg/dl during 99.2% of the total day, whereas other studies investigating continuous glucose profiles in type 1 and type 2 diabetic patients demonstrated that glucose concentrations were above 140 mg/dl during about 60% of the total day24 or above 180 mg/dl during about 30% of the total day,25 respectively. Postprandial hyperglycemic excursions are a major problem, and increasing efforts are recommended to reduce postprandial hyperglycemia in diabetic patients.26 Regarding the recent availability of continuous glucose monitoring devices with an online display of glucose concentrations, interstitial fluid glucose values will be integrated in therapeutic decisions more and more. However, up until now postprandial interstitial glucose target ranges have not been defined.
We have investigated interstitial fluid glucose profiles after ingestion of standardized meals with identical carbohydrate amount, but with different types of carbohydrates and different fiber, protein, and fat content in order to evaluate the variability of postprandial glucose traces in nondiabetic subjects. The highest postprandial interstitial glucose concentrations were observed after ingestion of meals with fast absorption characteristics; peak glucose concentrations were 133.2. ± 14.4 and 137.2 ± 21.1 mg/dl after ingestion of meal 1 (rice pudding with sugar and cinnamon) and meal 2 (toast with honey, jam, curd cheese, and orange juice), respectively. After ingestion of meal 3 (kidney beans, wholemeal bread, salami, and cheese) and meal 4 (grilled salmon, broccoli, carrots, thoroughly boiled wild rice, and cream) peak glucose concentrations were 99.2 ± 10.5 and 122.1 ± 20.4 mg/dl, respectively.
Areas under the postprandial tissue glucose curve after ingestion of meals 1 and 2 showed the highest values in the first 2 hours and a rapid decline after 2 hours (Figure 5). A similar pattern of postprandial tissue glucose values was observed after breakfast under everyday life conditions (Figure 4), probably because of the intake of a higher percentage of fast-absorbing carbohydrates with breakfast. In contrast, meal 3 induced only a small, flat increase in tissue glucose concentrations. Meal 4, as well as lunch and dinner under everyday life conditions, induced a prolonged increase in tissue glucose concentrations with the highest areas under the curve in the first 2 hours and a slow decline thereafter (Figures 4 and 5). These data confirm that meal composition-dependent differences in postprandial blood glucose levels are also reflected in postprandial interstitial fluid glucose traces. In accordance with our results, it has been demonstrated that interstitial fluid glucose values (CGMS, Medtronic MiniMed) do not differ significantly from capillary blood glucose values after ingestion of foods with a different glycemic index.27
The presented results, demonstrating continuous glucose profiles and postprandial interstitial glucose excursions in nondiabetic subjects, might be helpful for the evaluation of glucose target ranges in diabetic patients. Normative interstitial glucose values are essential for conventional diabetes therapy, as well as for the further development of subcutaneous closed loop or semiclosed loop systems. In addition, data suggest that detailed information about the meal composition is important for the interpretation of postprandial glucose traces and for adequate therapy adjustment.
Acknowledgements
The study was supported by an unrestricted grant from Roche Diagnostics and was performed in collaboration with the Glucose Monitoring Study Group.
Abbreviations
- AUC
area under the curve
- BG
blood glucose
- BMI
body mass index
- IG
interstitial glucose
- SD
standard deviation
- SEM
standard error of the mean
References
- 1.The Diabetes Control and Complications Trial Research Group. The effect of intensive treatment of diabetes on the development and progression of long-term complications in insulin-dependent diabetes mellitus. N Engl J Med. 1993;329:977–986. doi: 10.1056/NEJM199309303291401. [DOI] [PubMed] [Google Scholar]
- 2.UK Prospective Diabetes Study (UKPDS) Group. Effect of intensive blood-glucose control with metformin on complications in overweight patients with type 2 diabetes (UKPDS 34) Lancet. 1998;352:854–865. [PubMed] [Google Scholar]
- 3.Bolinder J, Ungerstedt U, Arner P. Microdialysis measurement of the absolute glucose concentration in subcutaneous adipose tissue allowing glucose monitoring in diabetic patients. Diabetologia. 1992;35:1177–1180. doi: 10.1007/BF00401374. [DOI] [PubMed] [Google Scholar]
- 4.Schmidt FJ, Sluiter WJ, Schoonen AJM. Glucose concentration in subcutaneous extracellular space. Diabetes Care. 1993;16:695–700. doi: 10.2337/diacare.16.5.695. [DOI] [PubMed] [Google Scholar]
- 5.Thomas K, Kiwit M, Kerner W. Glucose concentration in human subcutaneous adipose tissue: comparison between forearm and abdomen. Exp Clin Endocrinol Diabetes. 1998;106:465–469. doi: 10.1055/s-0029-1212017. [DOI] [PubMed] [Google Scholar]
- 6.Tiessen RG, Rhemrev-Boom MM, Korf J. Glucose gradient differences in subcutaneous tissue of healthy volunteers assessed with ultraslow microdialysis and a nanolitre glucose sensor. Life Sci. 2002;70:2457–2466. doi: 10.1016/s0024-3205(02)01515-1. [DOI] [PubMed] [Google Scholar]
- 7.Jansson PA, Fowelin J, Smith U, Lönnroth P. Characterization by microdialysis of intercellular glucose level in subcutaneous tissue in humans. Am J Physiol. 1988;255:E218–20. doi: 10.1152/ajpendo.1988.255.2.E218. [DOI] [PubMed] [Google Scholar]
- 8.Moberg E, Hagström-Toft E, Bolinder J. Detection of hypoglycaemia by microdialysis measurements of glucose in subcutaneous adipose tissue. Horm Metab Res. 1997;29:440–443. doi: 10.1055/s-2007-979073. [DOI] [PubMed] [Google Scholar]
- 9.Hagström E, Arner P, Engfeldt P, Rössner S, Bolinder J. In vivo subcutaneous adipose tissue glucose kinetics after glucose ingestion in obesity and fasting. Scand J Clin Lab Invest. 1990;50:129–136. doi: 10.1080/00365519009089144. [DOI] [PubMed] [Google Scholar]
- 10.Monsod TP, Flanagan DE, Rife F, Saenz R, Caprio S, Sherwin RS, Tamborlane WV. Do sensor glucose levels accurately predict plasma glucose concentrations during hypoglycemia and hyperinsulinemia? Diabetes Care. 2002;25:889–893. doi: 10.2337/diacare.25.5.889. [DOI] [PubMed] [Google Scholar]
- 11.Boyne MS, Silver DM, Kaplan J, Saudek CD. Timing of changes in interstitial and venous blood glucose measured with a continuous subcutaneous glucose sensor. Diabetes. 2003;52:2790–2794. doi: 10.2337/diabetes.52.11.2790. [DOI] [PubMed] [Google Scholar]
- 12.Steil GM, Rebrin K, Mastrototaro J, Bernaba B, Saad MF. Determination of plasma glucose during rapid glucose excursions with a subcutaneous glucose sensor. Diabetes Technol Ther. 2003;5:27–31. doi: 10.1089/152091503763816436. [DOI] [PubMed] [Google Scholar]
- 13.Wilhelm B, Forst S, Weber MM, Larbig M, Pfutzner A, Forst T. Evaluation of CGMS® during rapid blood glucose changes in patients with type 1 diabetes. Diabetes Technol Ther. 2006;8:146–155. doi: 10.1089/dia.2006.8.146. [DOI] [PubMed] [Google Scholar]
- 14.Kapitza C, Lodwig V, Obermaier K, Wientjes KJ, Hoogenberg K, Jungheim K, Heinemann L. Continuous glucose monitoring: reliable measurements for up to 4 days with the SCGM1 system. Diabetes Technol Ther. 2003;5:609–614. doi: 10.1089/152091503322250622. [DOI] [PubMed] [Google Scholar]
- 15.Schoemaker M, Andreis E, Röper J, Kotulla R, Lodwig V, Obermaier K, Stephan P, Reuschling W, Rutschmann M, Schwaninger R, Wittmann U, Rinne H, Kontschieder H, Strohmeier W. The SCGM1 system: subcutaneous continuous glucose monitoring based on microdialysis technique. Diabetes Technol Ther. 2003;5:599–608. doi: 10.1089/152091503322250613. [DOI] [PubMed] [Google Scholar]
- 16.Crapo PA, Reaven G, Olefsky J. Plasma glucose and insulin responses to orally administered simple and complex carbohydrates. Diabetes. 1976;25:741–747. [PubMed] [Google Scholar]
- 17.Crapo PA, Reaven G, Olefsky J. Postprandial plasma-glucose and insulin responses to different complex carbohydrates. Diabetes. 1977;26:1178–1183. doi: 10.2337/diab.26.12.1178. [DOI] [PubMed] [Google Scholar]
- 18.Polonsky KS, Given BD, Van Cauter E. Twenty-four-hour profiles and pulsatile patterns of insulin secretion in normal and obese subjects. J Clin Invest. 1988;81:442–448. doi: 10.1172/JCI113339. [DOI] [PMC free article] [PubMed] [Google Scholar]
- 19.Service FJ, O'Brien PC, Rizza RA. Measurements of glucose control. Diabetes Care. 1987;10:225–237. doi: 10.2337/diacare.10.2.225. [DOI] [PubMed] [Google Scholar]
- 20.Brynes AE, Adamson J, Dornhorst A, Frost GS. The beneficial effect of a diet with low glycaemic index on 24 h glucose profiles in healthy young people as assessed by continuous glucose monitoring. Br J Nutr. 2005;93:179–182. doi: 10.1079/bjn20041318. [DOI] [PubMed] [Google Scholar]
- 21.von Dobeln A, Adamson U, Lins PE. Nocturnal differences in subcutaneous tissue glucose between forearm and abdominal sites during continuous glucose monitoring in normal subjects. Diabetes Metab. 2005;31:347–352. doi: 10.1016/s1262-3636(07)70203-3. [DOI] [PubMed] [Google Scholar]
- 22.Yogev Y, Ben-Haroush A, Chen R, Rosenn B, Hod M, Langer O. Diurnal glycemic profile in obese and normal weight nondiabetic pregnant women. Am J Obstet Gynecol. 2004;191:949–953. doi: 10.1016/j.ajog.2004.06.059. [DOI] [PubMed] [Google Scholar]
- 23.Yu M, Zhou J, Xiang KS, Lu HJ, Ma XJ, Lu W. The glycemic excursions in normal glucose tolerance individuals revealed by continuous glucose monitoring system. Natl Med J China. 2004;84:1788–1790. [PubMed] [Google Scholar]
- 24.Garg S, Zisser H, Schwartz S, Bailey T, Kaplan R, Ellis S, Jovanovic L. Improvement in glycemic excursions with a transcutaneous, real-time continuous glucose sensor. Diabetes Care. 2006;29:44–50. doi: 10.2337/diacare.29.01.06.dc05-1686. [DOI] [PubMed] [Google Scholar]
- 25.Bode BW, Schwartz S, Stubbs HA, Block JE. Glycemic characteristics in continuously monitored patients with type 1 and type 2 diabetes. Diabetes Care. 2005;28:2361–2366. doi: 10.2337/diacare.28.10.2361. [DOI] [PubMed] [Google Scholar]
- 26.Davidson J. Should postprandial glucose be measured and treated to a particular target? Yes. Diabetes Care. 2003;26:1919–1921. doi: 10.2337/diacare.26.6.1919. [DOI] [PubMed] [Google Scholar]
- 27.Chlup R, Jelenová D, Kudlová P, Chlupová K, Bartek J, et al. Langová K, Chlupová L. Continuous glucose monitoring—a novel approach to the determination of the glycaemic index of foods (DEGIF 1)—determination of the glycaemic index of foods by means of the CGMS. Exp Clin Endocrinol Diabetes. 2006;114:68–74. doi: 10.1055/s-2006-923806. [DOI] [PubMed] [Google Scholar]