Abstract
Background
A primary challenge for closed-loop glucose control in type 1 diabetes mellitus (T1DM) is the development of a control strategy that will be applicable during all daily activities, including meals, stress, and exercise. A model-based control algorithm requires a mathematical model that has the simplicity for online glucose prediction, yet retains the complexity necessary to cope with variations in insulin sensitivities and carbohydrate ingestion.
Methods
A modified Bergman minimal model was linearized for Kalman filter (KF) state estimation on data from T1DM subjects, and multiple methods of parameter augmentation were developed for online adaptation. In addition, model deterioration for glucose prediction was assessed to determine an appropriate prediction horizon for model predictive control (MPC). Furthermore, MPC strategies were validated using advisory mode simulations.
Results
Twenty days of continuous glucose data, which included 97 meals, were evaluated for three subjects. A constant parameter minimal model was used to predict glucose levels for normal days with meal announcement and with a maximum prediction horizon of approximately 45 minutes. In order to attain this prediction horizon in the absence of meal announcement, parameter adaptation was necessary to capture the glucose disturbance. Evaluation of advisory mode MPC permitted effective tuning for a moderately aggressive controller that responded well to meal disturbances.
Conclusions
Estimation and prediction of glucose were accomplished using a KF based on a modified Bergman model. For a model with no meal announcement, parameter adaptation provided the means for closed-loop implementation. This state estimation and model validation scheme established the necessary framework for advisory mode MPC.
Keywords: artificial pancreas, model predictive control, patient model, type 1 diabetes
Introduction
Diabetes is a disease characterized by the improper production of insulin or insulin-mediated glucose disposal. This insulin deficiency results in hyperglycemia, as the hormone controls the metabolism of ingested carbohydrates and the glucose generated from gluconeogenic amino acids in protein. Complications associated with diabetes include high blood pressure, kidney disease, heart disease, and blindness, which result from the inability to maintain tight glucose control.1–3 The severity of these long-term complications can be reduced through the regulation of blood glucose levels.4 Currently, there is no cure for type 1 diabetes mellitus (T1DM), and although the only treatment is through insulin therapy, a healthy life can be sustained when normoglycemia is achieved and maintained.
Many T1DM subjects use manually controlled insulin pumps to administer meal-time insulin boluses and correction insulin boluses, but the insulin pump can be preprogrammed to deliver basal insulin. Continuous glucose monitoring systems (CGMS) allow subjects with diabetes to track absolute blood glucose concentrations and trends in real time.5 The two technologies of continuous glucose sensing and continuous insulin infusion presently work independently, but much research has been focused on developing a controller that will combine these two technologies for closed-loop glucose control and eliminate the need for the individual with T1DM from insulin dosage decision making in this control loop.
Model predictive control (MPC) and state estimation have been the foundation of simulated studies of glucose control, but only a few clinical studies have been reported.6–11 Parker et al.6–8 developed several MPC schemes, including controllers with state estimation, which were tested on the 19-state Sorensen model.12 Lynch and Bequette10 demonstrated plant-model mismatch with linear Kalman filter (KF) state estimation and designed a model predictive controller based on the Bergman “minimal” model.13 The discrete state space model used by Lynch and Bequette10 included an augmented input disturbance term. Control performance was tested in a subject simulated by the higher order Sorensen model.12 Hovorka and colleagues11 experimentally demonstrated the capabilities of a complex, nonlinear MPC strategy for T1DM subjects through fasting conditions; several model parameters were adapted online using a Bayesian approach.
The focus of this article was to develop a state estimation method that implements a simple model capable of online adaptation to capture glucose–insulin dynamics in actual data generated in a clinical setting. This estimation scheme was tested on a total of 97 meal responses for three T1DM subjects and model prediction degradation as the prediction horizon increased. Model updating through parameter augmentation is presented as a method for online adaptation. Additionally, advisory mode MPC for 20 days of ambulatory subject data validates the MPC strategy.
Modeling
A number of physiological, compartmental models have been developed to describe insulin–glucose kinetics, ranging from simple three-state models to comprehensive models that include transport and diffusion rates.12–17 Two models are considered in this article: the so-called Bergman and Hovorka models.
Bergman et al.13 developed the “minimal model” to characterize plasma insulin and plasma glucose dynamics during an intravenous glucose tolerance test. The model is described by
| (1) |
| (2) |
| (3) |
where G(t) is the differential plasma glucose relative to the basal glucose value, Gb (mg/dl), X (unitless) is the insulin in the remote compartment, and I (mU/liter) is the differential plasma insulin relative to the basal insulin value, Ib. The volumes of gut and insulin distributions are VG and VI, respectively. The Bergman model parameters used for this study are p1 = 1.0e-2 min−1, p2 = 3.33e-2 mU liter−1 min−2, and p3 = 1.33e-5 min−1.18 Model inputs are the plasma glucose appearance rate, m(t), and the plasma insulin appearance rate, U(t), a modification for T1DM in which insulin appears only from an exogenous source.19
The Bergman model describes the dynamics of insulin and glucose where the inputs are appearance rates into the bloodstream. For control applications and practical estimation of input values, an additional meal submodel is used to describe meal dynamics. Hovorka and co-workers11 used the meal submodel described by a second-order process model:
| (4) |
where DG is the meal carbohydrate load (mg), AG is the carbohydrate bioavailability, and tmax,G (min−1) is the time-of-maximum appearance rate of glucose in the accessible glucose compartment. The meal submodel can be expressed as a two-compartment gut absorption model
| (5) |
| (6) |
where g(t) is the glucose appearance in the first compartment and m(t) (mg) is the plasma appearance of glucose, an input for the Bergman model.
There is also the need to incorporate the subcutaneous insulin kinetics into the model. The model used to describe the subcutaneous insulin transport to plasma insulin was reported by Hovorka et al.11 as a two-compartment insulin absorption model:
| (7) |
| (8) |
where S1 is the amount of insulin in the first compartment, S2 is the amount of insulin in the second compartment, tmax,I is the time to maximum of absorption of subcutaneously injected insulin, and u(t) is the administration of insulin, which can be either bolus or basal infusion.8 The plasma insulin appearance rate that appears as an input in Equation (1) of the Bergman model, U(t), is represented by
| (9) |
For in silico testing, the full model of Hovorka et al.11 is used to describe the glucose–insulin dynamics of a T1DM subject. The physiological model, which describes the glucoregulatory network, incorporates a two-compartment glucose subsystem, an insulin subsystem, and a three-compartment insulin action subsystem.
State Estimation
The KF is a state estimator used to estimate state variables that cannot be measured directly. It is based on a linear discrete state space model,
| (10) |
| (11) |
where x (nx1) is the state vector of n state variables, the input vector, u (nux1), has nu inputs, Ф (nxn), C (nyxn), Г (nxnu), Гw (nx1), and Гv (nyx1) are consistent matrices, and k is the time index. The measured output, y (nyx1), is the output vector of ny measurements. In this research, process noise, wk, and measurement noise, vk, are assumed to be scalars with zero means and variances denoted by
| (12) |
| (13) |
Because Q and R are not measurable, they are considered to be tuning parameters. The ratio of Q/R is adjusted as a tuning parameter, reflecting the trade-off between trusting the measurement and trusting the model prediction. A large Q/R ratio is used when confidence is placed on the measurement, and a small Q/R ratio is applied when the measurement noise is high, the model is accurate, and thus is trusted more.
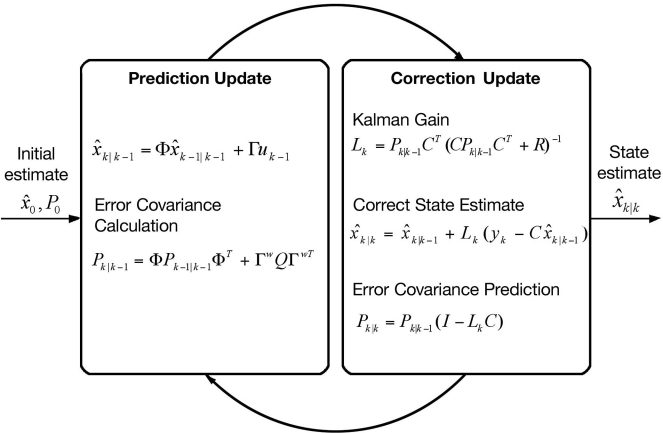
The KF algorithm is illustrated in Figure 1 where is the state estimate at time k based on information at time k − 1, i.e., the one-step ahead prediction, Lk is the Kalman gain, Pk is the state covariance, and I is the identity matrix. The state estimate is based on the model:
| (14) |
| (15) |
where ŷk|k − 1 is the predicted output at time k. The corrected estimate of the state vector, , is obtained by updating using the current measurement, yk, and the Kalman gain, Lk,
| (16) |
Figure 1.
The recursive Kalman filter, which uses the previous estimated state, xk|k − 1, and current measurement, yk, to calculate the estimate of the current state based on the error covariance, Pk.20
Model Predictive Control
The control actions determined by MPC are calculated by minimizing the objective function,
| (17) |
and the error is calculated over the prediction horizon, P:
| (18) |
where r is the set point, ŷ is the vector of predicted outputs, and the superscript T denotes transpose of the matrices.21 Because all state variables are not measurable, the KF is used to estimate the current model state across P. The change in manipulated input from one sample time to the next is Δu, which is evaluated over the control move horizon, and M, Wy, and Wu are diagonal matrices with identical elements equal to wy and wu, respectively. For MPC applications, the first control move, Δuk, is implemented and the optimization is repeated at the next time step.
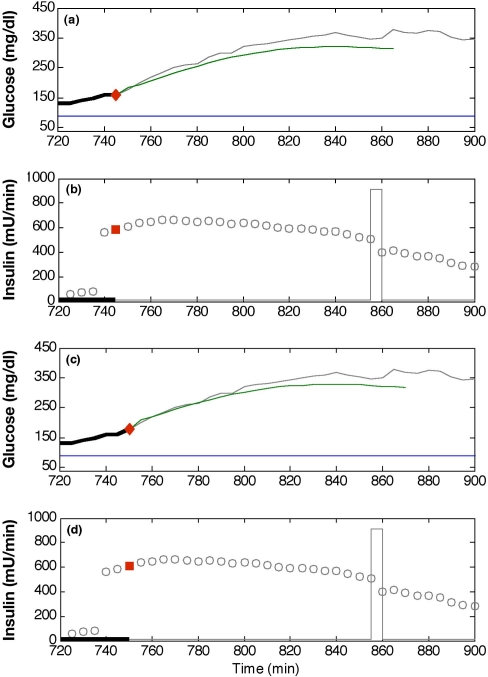
Advisory mode MPC is used to calculate control moves based on historical data in order to test the validity of the control system. This method is described by Seborg et al.22 as a step in the implementation of MPC, referred to as “prediction mode.” Because the control moves calculated for advisory mode have no causal impact on historical data, the moves are analyzed on a time-step by time-step basis. For diabetes control, the advisory moves are compared to insulin recommendations made by physicians for the conditions of the historical data set. Figure 2 compares the information provided to the controller at a single time step and the recommended MPC insulin move for actual glucose and insulin infusion data. Because this insulin recommendation is not implemented, the information provided to the controller at the next time step only includes insulin and glucose from the historical data set.
Figure 2.
Two advisory mode MPC recommendations for the insulin infusion rate. They were calculated at the times denoted by diamonds: t = 745 minutes (a and b) and t = 750 minutes (c and d). Each G plot compares clinical glucose data (solid line) with the predicted trajectory (dot–dash line) and the desired value of 80 mg/dl (dashed line). Actual insulin infusion rates are denoted by hollow squares, whereas the two advisory mode recommendations are shown as solid squares. At t = 735 minutes, a 57-gram carbohydrate meal was ingested. The correction insulin bolus at approximately t = 855 minutes is shown as a rectangular pulse.
Data Collection
Data were collected from three adult subjects with T1DM [two females, one male; age: 45 ± 18 years (mean ± standard deviation); body mass index: 20.9 ± 1.7 kg/m2; weight: 61 ± 7 kg; glycosylated hemoglobin A1c: 6.8 ± 1.3%] wearing continuous glucose sensors (CGMS®, Medtronic MiniMed, Inc., Northridge, CA). Five-minute glucose sampling produced 288 measurements per day for a total of 26 days. Insulin infusion information was retrieved from the insulin pump after the test period. Meal size estimates, exercise, and stress data were logged in a diary by subjects. Data sets that included saturation at the upper (400 mg/dl) or lower (40 mg/dl) limit of the CGMS for more than 12 consecutive samples were discarded from the analysis. Ninety-seven meal responses over 20 days of data were analyzed for the three subjects: 8 days with 42 meals for subject 1, 8 days with 29 meals for subject 2, and 4 days with 26 meals for subject 3.
Table 1.
Maximum Model Prediction Horizons for Each Subject (Mean ± Standard Deviation)
| Subject 11 (min) | Subject 21 (min) | Subject 32 (min) | ||
|---|---|---|---|---|
| with meal estimate | constant model | 33 ± 12 | 48 ± 16 | 44 ± 19 |
| adaptation through | 36 ± 9 | 45 ± 23 | 43 ± 25 | |
| no meal estimate | constant model | 33 ± 14 | 34 ± 11 | 40 ± 13 |
| adaptation through | 45 ± 12 | 48 ± 17 | 45 ± 28 | |
| adaptation through | 43 ± 13 | 49 ± 16 | 44 ± 30 | |
Based on 8 days of subject data.
Based on 4 days of subject data.
Results
A KF based on the linearized Bergman minimal model with online model adaptation was used for glucose estimation and extended for application in MPC. State estimation and MPC were initially validated on the Hovorka model. These methods were then applied to historical subject data.
Simulation Study
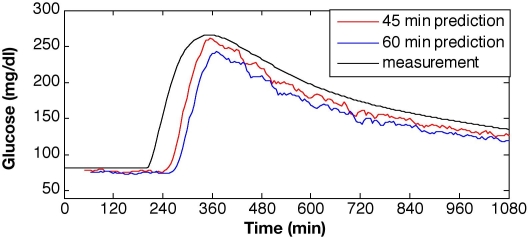
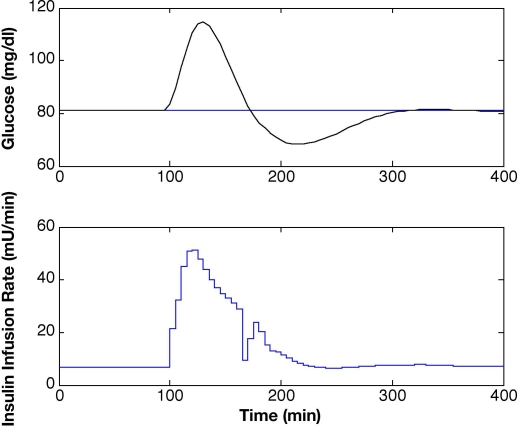
Plant-model mismatch, similar to the ones considered by Lynch and Bequette,10 was used to test the estimation capability of the KF in silico. To simulate a subject with T1DM, the Hovorka model was used to produce glucose values for a meal response with 10% Gaussian noise on the measurements, which is in the expected range for the physical system. The linearized Bergman-based KF with Q/R = 0.1 was validated on meal response data in Figure 3. The state vector for the Bergman model is xT = [G; X; I; S1; S2; g; m], where the initial steady-state condition for linearization is x0T = [81; -2.7e-3; -1.13; 0; 0; 0; 0] for a basal insulin infusion rate of 4.25 mU/min. Estimated glucose values were very close to those generated by the open-loop meal response of the Hovorka model, showing only minor mismatch at the onset of the meal response. The maximum glucose excursion was reduced from Gmax = 260 mg/dl to Gmax = 115 mg/dl, and an improvement in the settling time from ts > 1000 minutes to ts < 300 minutes was accomplished using MPC (Figure 4). The MPC tuning parameters were P = 12, M = 3, and wu/wy = 0.001.
Figure 3.
Glucose predictions using a constant model Kalman filter with no meal information for a 50-gram carbohydrate meal at t = 200 minutes and prediction horizons of 45 and 60 minutes (Q/R = 0.1).
Figure 4.
Model predictive control with state estimation based on linearized Bergman model with constant parameter values and insulin infusion rates for a 50-mg CHO meal at t = 100 minutes and P = 12, M = 3, and wu/wy = 0.001.
Experimental Study
Glucose estimation and prediction obtained from a KF were applied to historical data for ambulatory conditions to determine the maximum number of steps ahead that glucose values can be accurately predicted by the model (i.e., the maximum prediction horizon). It was determined using qualitative analysis of the fit of the prediction as well as the evaluation of the median relative absolute difference (MRAD). The MRAD is calculated as
| (19) |
The threshold for maximum model prediction for the 24-hour period was specified in this study as MRAD ≤ 16%. Maximizing the prediction horizon is essential for the successful application of advanced control strategies.
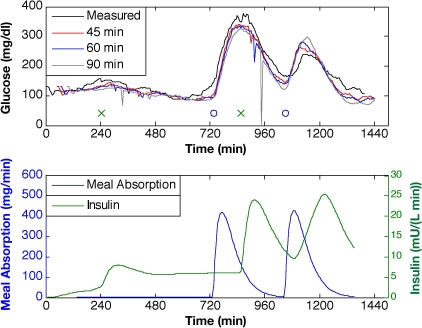
The KF was first evaluated with meal estimates for the estimator based on the linearized Bergman model, modified to include gut absorption and subcutaneous insulin processing models with Q/R = 10. In Figure 5, 45-, 60-, and 90-minute-ahead glucose predictions show the limits in the prediction capability of the model for subject 2, day 6. The KF is able to predict the glucose levels of these ambulatory subject data through meal responses and subcutaneous insulin boluses, while exhibiting only slight subject-model mismatch for the smaller prediction horizons (45 or 60 minutes), but as the horizon is increased to 90 minutes, the prediction is less accurate. Maximum prediction horizons for the multiple data sets (mean ± standard deviation) are 33 ± 12 minutes for subject 1, 48 ±16 minutes for subject 2, and 44 ± 19 minutes for subject 3.
Figure 5.
Glucose predictions for prediction horizons of 45, 60, and 90 minutes ahead based on KF state estimation with Q/R = 10 and meal estimate provided. Meal time is denoted by “o” and insulin bolus time by “x” (top plot).
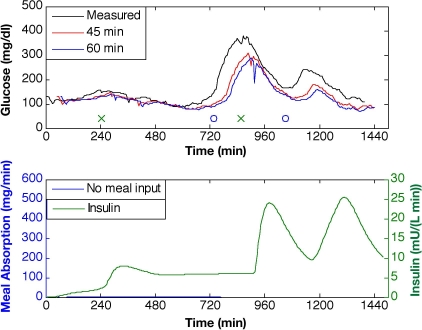
Ideally, an artificial pancreatic β cell should remove the subject entirely from the closed-loop system, which requires the model and estimator to predict glucose accurately with no meal information. Figure 6 illustrates the KF glucose predictions for horizons of 45 and 60 minutes based on the modified, linear Bergman model (Q/R = 10). With no meal information provided to the model, the prediction exhibits no input-driven glucose response. Maximum prediction horizons are 33 ± 14, 34 ± 11, and 40 ± 13 minutes for subjects 1, 2, and 3, respectively.
Figure 6.
Glucose predictions for prediction horizons of 45 and 60 minutes based on KF state estimation with Q/R = 10 and no meal estimate provided. Meal time is denoted by “o” and insulin bolus time by “x” (top plot).
Model adaptation was introduced to compensate for subject-model mismatch and the lack of meal information. Two approaches were taken to allow online adaptation of the modified Bergman model. First, Equation (1) was revised with the augmentation and estimation of in the form:
| (20) |
| (21) |
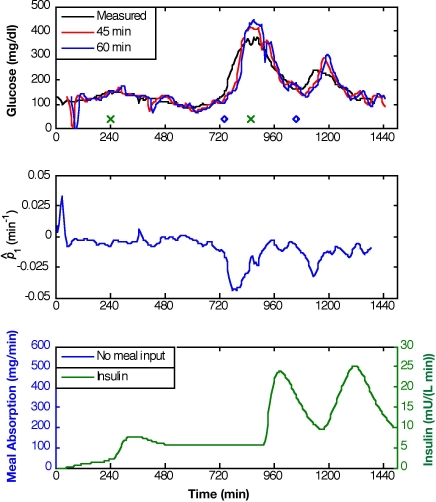
which was linearized for use in the Kalman filter. Adaptation of improves the prediction ability for input responses with no meal information given, as demonstrated in Figure 7 (Q/R = 10−2). The negative excursion in during a meal response to simulate glucose production allows the model to respond to the glucose peak; maximum prediction horizons are improved to 45 ± 12 minutes for subject 1, 48 ± 17 minutes for subject 2, and 45 ± 28 minutes for subject 3.
Figure 7.
Glucose predictions for prediction horizons of 45 and 60 minutes based on KF state estimation with adaptation, Q/R = 10−2, and no meal information provided. Meal time is denoted by “o” and insulin bolus time by “x” (top plot).
An alternative approach incorporates an additive disturbance term, , for adaptation of Equation (1) in the form:
| (22) |
| (23) |
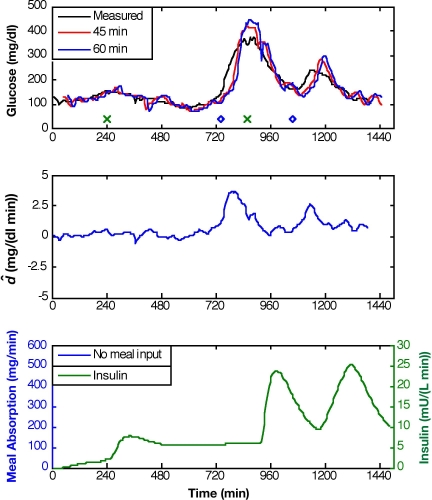
Because adaptation of either or has an indirect effect on G(t), the prediction capability for either type of model adaptation is similar, as shown in Figures 7 and 8. Figure 8 presents model predictions for adaptation and Q/R = 10−4. The maximum prediction horizons are 43 ± 13, 49 ± 16, and 44 ± 30 minutes for subjects 1, 2, and 3, respectively.
Figure 8.
Glucose predictions for prediction horizons of 45 and 60 minutes based on KF state estimation with adaptation, Q/R = 10-4, and no meal information provided. Meal time is denoted by “o” and insulin bolus time by “x” (top plot).
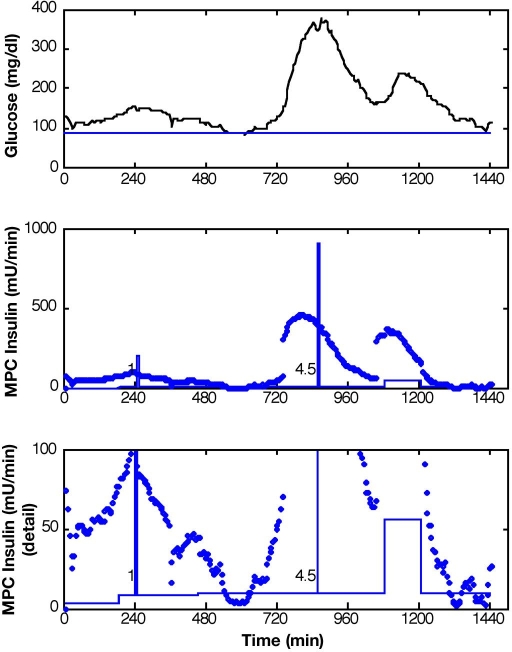
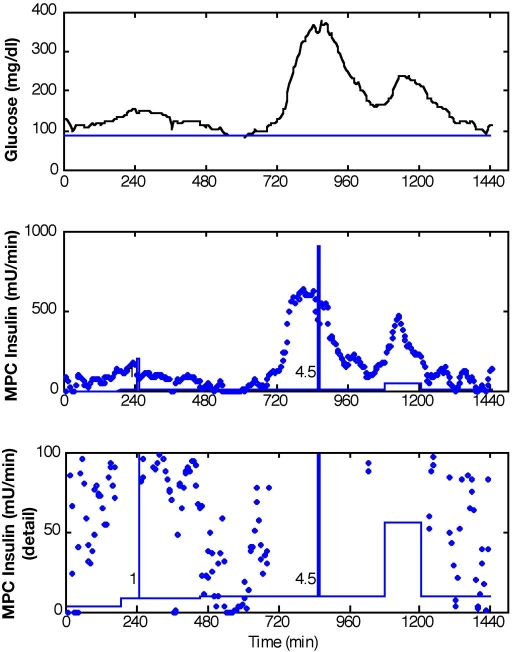
A prediction horizon of 60 minutes was implemented in an advisory mode MPC scheme, with KF state estimation, to evaluate the controller action based on retrospective subject data. The controller was tuned to generate moderately aggressive control moves in response to meal excursions. Advisory moves from MPC with P = 12, M = 3, and wu/wy = 0.1 with the KF based on a constant model with meal estimates given and Q/R = 10 are reported in Figure 9 for subject 2, day 6. The controller recommends significant increases in insulin at the moments that the meals were reported to have begun (t = 735 minutes and t = 1050 minutes), which resulted from the meal estimates. This response preceded the insulin action from a late meal bolus reported by the subject. Insulin recommendations from MPC with the same controller tuning and subject data are reported in Figure 10 for conditions when the MPC received no meal information. The KF was based on adaptation with Q/R = 0.005. Although the calculated MPC insulin action did not change at the exact moment that the first meal was reported, the increased insulin recommendation led the actual insulin bolus. By responding early to the onset of the meal, the glucose excursion could probably be reduced using MPC.
Figure 9.
Results for measured meal disturbance (meals: t = 735 and t = 1050). Glucose levels and advisory mode MPC recommendations Q/R = 10, P = 12, M = 3, and wu/wy = 0.1.
Figure 10.
Results for unmeasured meal disturbance (meals: t = 735 and t = 1050). Glucose levels and advisory mode MPC recommendations Q/R = 0.005, P = 12, M = 3, and wu/wy = 0.1.
Conclusions and Future Work
Glucose estimation and prediction for T1DM subject data were accomplished using a KF based on a linearized version of a modified Bergman model. Maximum prediction horizons were determined for 20 days of ambulatory subject data. With meal estimates provided, the constant model adequately predicted the glucose levels through meal information with a maximum prediction horizon of 48 minutes. By incorporating model parameter adaptation, comparable prediction horizons were obtained when no meal information was available. Results of the advisory mode MPC indicate that this control strategy could improve glucose control through the meal response in subjects with T1DM. This was demonstrated with advisory MPC insulin in response to the rising glucose levels prior to the late insulin boluses for the meals.
Future studies will include clinical implementation of MPC to control glucose levels through the entire meal responses. This control method will be validated for both “normal” and days with abnormal insulin sensitivities due to exercise or stress.
Abbreviations
- CGMS
continuous glucose monitoring systems
- KF
Kalman filter
- MPC
model predictive control
- MRAD
median relative absolute difference
- T1DM
type 1 diabetes mellitus
References
- 1.Geiss LS, Herman WH, Smith PJ. Mortality in non-insulin-dependent diabetes. In: National Diabetes Data Group, editor. Diabetes in America. 2nd ed. Washington, DC: U.S. Department of Health and Human Services, National Institutes of Health, National Institute of Diabetes and Digestive and Kidney Diseases; 1995. pp. 233–257. NIH Publication No. 95-1468. [Google Scholar]
- 2.Geiss LS, Rolka DB, Engelgau MM. Elevated blood pressure among U.S. adults with diabetes, 1988–1994. Am J Prev Med. 2002;22(1):42–49. doi: 10.1016/s0749-3797(01)00399-3. [DOI] [PubMed] [Google Scholar]
- 3.Klein R, Klein BE. Vision disorders in diabetes. In: National Diabetes Data Group, editor. Diabetes in America. 2nd ed. Washington, DC: U.S. Department of Health and Human Services, National Institutes of Health, National Institute of Diabetes and Digestive and Kidney Diseases; 1995. pp. 293–336. NIH Publication No. 95-1468. [Google Scholar]
- 4.The Diabetes Control and Complications Trial Research Group. The effect of intensive treatment of diabetes on the development and progression of long-term complications in insulin-dependent diabetes mellitus. N Engl J Med. 1993;329:977–986. doi: 10.1056/NEJM199309303291401. [DOI] [PubMed] [Google Scholar]
- 5.Centers for Disease Control and Prevention. Atlanta GA: U.S. Department of Health and Human Services, Centers for Disease Control and Prevention; 2005. National diabetes fact sheet: general information and national estimates on diabetes in the United States, 2005. [Google Scholar]
- 6.Parker RS, Doyle FJ, III, Peppas NA. The intravenous route to blood glucose control. IEEE Trans Biomed Eng. 2001;20(1):65–73. doi: 10.1109/51.897829. [DOI] [PubMed] [Google Scholar]
- 7.Parker RS, Doyle FJ, III, Peppas NA. A model-based algorithm for blood glucose control in type I diabetic patients. IEEE Trans Biomed Eng. 1999;46(2):148–157. doi: 10.1109/10.740877. [DOI] [PubMed] [Google Scholar]
- 8.Parker RS, Gatzke EP, Doyle FJ., III Advanced model predictive control (MPC) for type I diabetic patient blood glucose control. Proc Am Contr Conf. 2000:3483–3487. [Google Scholar]
- 9.Kuure-Kinsey M, Palerm CC, Bequette BW. A dual-rate Kalman filter for continuous glucose monitoring. Proceedings of the 28th IEEE EMBS Annual International Conference; 2006. [DOI] [PubMed] [Google Scholar]
- 10.Lynch SM, Bequette BW. Model predictive control of blood glucose in type I diabetics using subcutaneous glucose measurements. Proc Am Contr Conf. 2002:4039–4043. [Google Scholar]
- 11.Hovorka R, Canonico V, Chassin LJ, Haueter U, Massi-Benedetti M, Federici MO, Pieber TR, Schaller HC, Schaupp L, Vering T, Wilinska ME. Nonlinear model predictive control of glucose concentration in subjects with type 1 diabetes. Physiol Meas. 2004;25(4):905–920. doi: 10.1088/0967-3334/25/4/010. [DOI] [PubMed] [Google Scholar]
- 12.Sorensen JT. Cambridge: MIT; 1985. A physiologic model of glucose metabolism in man and its use to design and assess improved insulin therapies for diabetes [thesis] [Google Scholar]
- 13.Bergman RN, Ider YZ, Bowden CR, Cobelli C. Quantitative estimation of insulin sensitivity. Am J Physiol Endocrinol Metab Gastrointest Physiol. 1979;236(6):E667–E677. doi: 10.1152/ajpendo.1979.236.6.E667. [DOI] [PubMed] [Google Scholar]
- 14.Cobelli C, Federspil G, Pacini C, Salvan A, Scandellari C. An integrated mathematical model of the dynamics of blood glucose and its hormonal control. Math Biosci. 1982;58:27–60. [Google Scholar]
- 15.Cobelli C, Mari A. Validation of mathematical models of complex endocrine--metabolic systems. A case study on a model of glucose regulation. Med Biol Eng Comput. 1983;21:390–399. doi: 10.1007/BF02442625. [DOI] [PubMed] [Google Scholar]
- 16.Hovorka R, Shojaee-Moradie F, Carroll PV, Chassin LJ, Gowrie IJ, Jackson NC, Tudor RS, Umpleby AM, Jones RH. Partitioning glucose distribution/transport, disposal, and endogenous production during IVGTT. Am J Physiol Endocrinol Metab. 2002;282(5):992–1007. doi: 10.1152/ajpendo.00304.2001. [DOI] [PubMed] [Google Scholar]
- 17.Makroglou A, Li J, Kuang Y. Mathematical models and software tools for the glucose-insulin regulatory system and diabetes: an overview. Appl Num Math. 2006;56(3–4):559–573. [Google Scholar]
- 18.Owens CL. Newark (DE): University of Delaware; 2004. Control of blood glucose concentration for people with type 1 diabetes mellitus [thesis] [Google Scholar]
- 19.Ollerton RL. Application of optimal control theory to diabetes mellitus. Int J Control. 1989;50(6):2503–2522. [Google Scholar]
- 20.Welch G, Bishop G. An introduction to the Kalman filter. SIGGRAPH 2001 course 8. In Computer Graphics, Annual Conference on Computer Graphics & Interactive Techniques; 2001 Aug 12–17; Los Angeles. ACM Press; Addison-Wesley SIGGRAPH 2001 course pack edition. [Google Scholar]
- 21.Bequette BW. Upper Saddle River (NJ): Prentice Hall; 2003. Process control: modeling, design, and simulation. [Google Scholar]
- 22.Seborg DE, Edgar TF, Mellichamp DA. 2nd ed. Hoboken (NJ): John Wiley & Sons, Inc.; 2004. Process Dynamics and Control. [Google Scholar]


