

Abstract
Background
The V-Go™ is a once-daily disposable device that allows coverage of basal and prandial insulin requirements over a period of 24 hours. The aim of this proof-of-concept study was to evaluate the clinical functionality, safety, and pharmacodynamics of the V-Go delivering insulin aspart and redistributing a single basal dose of insulin glargine as a constant basal infusion supplemented with prandial insulin in subjects with type 2 diabetes mellitus.
Methods
In six subjects receiving once-daily subcutaneous (SC) injections of insulin glargine (≥15 U/day) with or without concomitant oral antidiabetic drugs, glargine was discontinued following a 3-day baseline phase. The V-Go was then applied to the lower abdomen of the subjects once daily for 7 days (days 1–3 inpatient, days 4–7 outpatient). Each V-Go provided a continuous 24-hour preset basal infusion rate of insulin aspart (0.6 U/h) and up to three daily prandial doses at mealtimes. Capillary blood glucose concentrations were measured at 11 time points per day during the baseline and inpatient phases and at 4 time points per day during the outpatient phase. Additionally, glucose profiles were measured continuously on all days.
Results
The V-Go was well tolerated and operated as anticipated. The mean ± SEM prestudy daily dose of SC insulin glargine was 33.3 ± 13.8 U; the mean daily total insulin aspart dose infused with the V-Go was 31.5 ± 7.5 and 32.3 ± 7.8 U for the inpatient and outpatient periods, respectively. Fasting blood glucose values were similar to those observed at baseline throughout the study, with nonsignificant (NS) reductions in readings collected during the outpatient phase before lunch (-35 ± 27 mg/dl) and before dinner (-38 ± 25 mg/dl). The 2-hour postprandial glucose trended lower from 231 to 195 mg/dl (NS) at breakfast, 234 to 166 mg/dl (NS) at lunch, and 222 to 171 mg/dl (NS) at dinner. Bedtime blood glucose decreased (mean change from baseline -52 ± 21 mg/dl; P = 0.0313), as did nighttime (3:00 AM) measurements (-20 ± 9 mg/dl; P = 0.0313). Overall glycemic control tended to improve, as shown by continuous glucose monitoring changing from 173 to 157 mg/dl (P = 0.063, NS) and 156 mg/dl (P = 0.219) during inpatient and outpatient periods, respectively. Glycemic variability assessed by the M value similarly tended to decrease from 33 ± 9 to 25 ± 4 (NS) and 21 ± 4 (NS) for inpatient and outpatient periods, respectively.
Conclusions
These first data suggest that use of the V-Go is an attractive alternative to SC insulin injection therapy because metabolic control appears to be maintained or even improved without increasing daily insulin doses.
Keywords: basal–prandial insulin, continuous subcutaneous insulin infusion, glycemic control, h-Patch, type 2 diabetes, V-Go
Introduction
Several trials have demonstrated that despite aggressive insulin dose titration, about half of patients with type 2 diabetes (T2DM) who initiate subcutaneous (SC) insulin therapy with intermediate or long-acting insulin formulations but without prandial insulin coverage in addition to oral antidiabetic drugs (OADs) do not reach target hemoglobin A1c (HbA1c).1–3 Data from the Diabetes Control and Complications Trial (DCCT) support the importance of prandial insulin coverage. The DCCT indicated that intensive therapy does not equate to more insulin. Subjects were randomized to either ≤2 injections per day (conventional therapy) or ≥3 injections per day or pump therapy (intensive therapy). Despite a difference in total daily insulin administration between the two groups of only 0.01 to 0.05 U/kg, subjects treated with the intensive regimen had HbA1c levels that were approximately 2% units better than those whose T2DM was treated conventionally. The marked differences in HbA1c achieved by the intensive group with similar amounts of insulin indicate that it is not just total daily dose that improves glycemic control, but how that dose is delivered.4
Data from the Glycemia Optimization Treatment study demonstrated that even with rigorous titration of insulin glargine to reach a target fasting plasma glucose (FPG) concentration of 80 to 120 mg/dl, adequate HbA1c control was achieved in a minority of the subjects.5 Furthermore, the average insulin dose in the 80-mg/dl target group was 20 U higher than in the 120-mg/dl target group, but the incremental HbA1c reduction achieved was only 0.25%. Also, the rates of severe hypoglycemic events increased with progressively lower target FPG concentrations.5
These observations of targeting fasting blood glucose (FBG) only indicate that prandial insulin is required for those patients not reaching glycemic goals with OADs and intermediate or long-acting insulin alone.6 It has also been acknowledged that postprandial glucose excursions appear to be the predominant contributor to overall hyperglycemia in patients with less severe hyperglycemia.7 Among reasons for the reluctance of patients to start and/or intensify the insulin therapy is the embarrassment of injections in public. Other reasons, in decreasing importance, are included in Table 1.8 Therefore, there is a need for a different application technique that is discreet and simple to use, while providing at least the same metabolic control.
Table 1.
Reasonsa for Reluctance to Start or Intensify Insulin Therapy
| Fear of hypoglycemia |
| Embarrassment of injections in public |
| Feeling of dependence on regular injections |
| Trepidation about dietary adherence |
| Trepidation about the perceived careful organization of the day insulin requires |
| Fear of pain with injections |
| Fear of injections in general |
Given in order of decreasing importance. Treatment study
The V-Go™ is a new disposable device that utilizes h-Patch™ technology for continuous subcutaneous insulin infusion (CSII). It is a discreet, simple-to-use, once-daily device that is entirely mechanical and does not require batteries or programming. The V-Go adheres to the skin and delivers insulin through a 4.6-mm 30-gauge hypodermic floating needle that is inserted perpendicular to the skin when the device is activated. Once in place, the floating needle can move relative to the rest of the device, eliminating or minimizing any sensation of the needle. It provides a continuous, consistent rate insulin infusion for 24 hours, as well as on-demand delivery of prandial doses that can be triggered easily through clothing, thus maintaining flexibility and privacy. The V-Go is developed with simplicity of operation in mind. For safety reasons, dosing of bolus insulin is deliberately designed as a two-button, two-step maneuver. There are devices on the market that operate with 2-unit increments and there is scant evidence that 1-unit increments provide any clinical benefit, particularly in type 2 diabetes patients. Based on that and the impracticality of the number of repetitions 1-unit increments would require for most patients, 2-unit increments were deliberately chosen.
The aim of this proof-of-concept study was to evaluate the clinical tolerability and functionality of the V-Go in subjects with T2DM. Standard in vitro flow rate, accuracy, and precision testing were performed on the same batch of V-Go devices as was used in the present report and will be reported later this year. Here we report clinical tolerability and functionality of the V-Go. Additionally, the study was designed to provide preliminary evidence that a constant basal infusion rate, supplemented with prandial insulin, results in equal or even better glycemic control than a single daily dose of a long-acting insulin analogue.
Methods
Study Design
A single-center, single-arm, open-label study was conducted by Profil Institut für Stoffwechselforschung GmbH, Neuss, Germany in subjects with T2DM taking ≥15 U/day insulin glargine (Lantus®, sanofi-aventis, Paris, France) with or without concurrent use of OADs. Continuous glucose monitoring (CGM) assessments were conducted for the baseline, inpatient, and outpatient phases, each lasting for more than 72 hours. Calibration was performed according to the instructions of the manufacturer four times per day by means of capillary blood glucose measurements. The study consisted of three phases.
Baseline (Days -3 to -1)
Beginning on day -3, subjects were fitted with an ambulatory CGM system (CGMS® System Gold™, Medtronic MiniMed, Inc., Northridge, CA). Subjects were also instructed to perform capillary blood glucose measurements (11-point daily glucose profiles) and to record dietary intake. Previous insulin therapy was maintained.
Inpatient (Days 1 to 4)
Beginning on day 1, subjects prepared, applied, and operated the V-Go device under supervision. Each subject's daily glucose profile was assessed on days 1, 2, and 3, similar to the baseline assessments. On day 4, subjects were discharged after blood samples were taken for FBG, subjects underwent a physical examination, instructions on the use of the V-Go were reviewed, and sufficient V-Go devices to last until visit day 7 were provided. Dietary intake during the inpatient phase was designed to mimic the intake recorded during the baseline phase.
Outpatient (Days 4 to 7)
Subjects continued daily application of the V-Go and recorded preprandial and bedtime capillary blood glucose concentrations (obtained via a glucose meter), deviations from their usual caloric and carbohydrate dietary habits, any reactions at the V-Go application sites, and any hypoglycemic events. Subjects returned to the study center on day 7 for disconnection of the CGM system, review of dietary cards, and investigator assessment of V-Go application sites and blood glucose concentrations. Subjects returned on day 8 for end-of-study evaluations.
Subjects
Eligible male and female patients with T2DM aged 35 to 65 years, with HbA1c levels between 7 and 9%, no known clinically relevant T2DM-related late complications, and no clinically relevant diseases in addition to T2DM were treated with insulin glargine at a daily dose of ≥15 U.
Treatment Regimen
Each V-Go (Figure 1) was applied by the subject to the skin of the lower abdomen via an adhesive that kept it in place for the 24-hour infusion period. A 30-gauge floating needle was deployed using a downward push on the needle button of the device until a click was heard. The needle was never seen by the subject. Prandial insulin delivery was accomplished by a two-step process of pressing the bolus activation button on the device until a click was heard and then releasing the bolus button. The bolus button delivered 2 U per click. Insulin aspart was infused SC via the V-Go at a constant basal infusion rate of 0.6 U/h with up to four individually titrated 2-U prandial doses administered immediately before breakfast, lunch, and dinner (0–8 U per meal, in 2-U increments; total of prandial doses ≤24 U/day).
Figure 1.
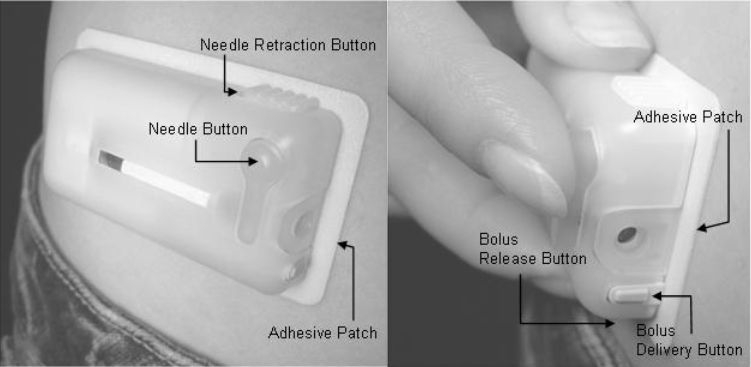
The V-Go™ device. The V-Go is applied using the adhesive patch and is activated by pushing the needle button. Prandial insulin is delivered by pushing both the bolus release button and the bolus delivery button. Photographs shown are of the commercial product and not the prototype used in this trial.
Pharmacodynamic Assessments
Glucose was assessed using 11-point blood glucose profiles that included FBG and 1- and 2-hour postprandial glucose concentrations. In addition, glucose curves during days -3 to -1 and days 1 to 6 were evaluated from the glucose profiles recorded by the CGM system.
Safety Assessments
To assess safety and tolerability of the V-Go, physical examinations, including an assessment of vital signs, were performed daily starting on day -1. Clinical laboratory and electrocardiogram (ECG) assessments were performed at screening and on days 4 and 8. The number and types of adverse events (AEs) were recorded on days 1 through 8. Application site reactions were also recorded according to the scoring system described in Table 2.
Table 2.
Application Site Reaction Assessments
| Irritation assessments | Edema/swelling assessments |
|---|---|
| 0 = No visible reaction | 0 = None |
| 1 = Erythema only | 1 = Mild |
| 2 = Papular reaction | 2 = Moderate |
| 3 = Vesicular or necrotic reaction | 3 = Severe |
| Ecchymosis/hematoma assessments | Tearing/laceration assessments |
|---|---|
| 0 = None | 0 = None |
| 1 = Ecchymosis only (i.e., bruising) | 1 = Small and superficial laceration |
| 2 = Small hematoma with mild swelling | 2 = Moderate and superficial laceration |
| 3 = Large hematoma with significant swelling | 3 = Deep laceration |
Statistical Methods
Descriptive statistics used included FBG, preprandial and postprandial blood, and bedtime and nighttime glucose from 11-point blood glucose profiles. Average glucose, proportional time in hypoglycemia (<70 mg/dl), and euglycemia (70–180 mg/dl)9 were calculated from CGM data. The variability measure (M value) for blood-sugar control was calculated as
where BG is the capillary blood glucose measurement and W is the difference between minimum and maximum glucose measured in the period tested.10 Changes from baseline were analyzed with a Wilcoxon signed-rank test. Descriptive statistics were also used to report safety parameters.
Results
Disposition and Demographics
Of nine subjects screened, six were enrolled, completed the study, and were included in the efficacy and safety analyses. Demographics of the subjects are given in Table 3. Four subjects were treated with OADs (two glimepiride, one metformin, one glibenclamide) in addition to SC insulin.
Table 3.
Baseline Subject Characteristics
| Characteristica | N = 6 |
|---|---|
| Age, years | 59.5 ± 5.2 |
| Height, meters | 1.75 ± 0.09 |
| Weight, kilograms | 85.3 ± 12.3 |
| Body mass index, kg/m2 | 27.7 ± 2.5 |
| Men, n | 5 |
| Women, n | 6 |
| Duration of type 2 diabetes mellitus, years | 10.5 ± 7.9 |
| Duration of glargine treatment, years | 2.4 ± 0.9 |
| Dose of glargine at study entry, U/day (range) | 33.3 (20-58) |
| Fasting blood glucose, mg/dl (range) | 173.8 ± 17.3 (159-196) |
| Hemoglobin A1c % (range) | 7.7 ± 1.2 (6.60-9.60) |
| Oral antidiabetic medications, n | 4 |
Values are expressed as mean ± SD unless otherwise stated.
Device Function
All 42 V-Go devices (six subjects for 7 days) remained firmly in place and functioned well in both basal and prandial modes. On a limited number of occasions during the inpatient phase, the devices did not release the needle when subjects pressed the needle button, probably because of improper use of the release mechanism or only partial depression of the needle button; in these instances, new V-Go devices were applied and the needles were deployed successfully.
Dietary Intake
There were no notable dietary changes with regard to calories or carbohydrates per meal for any of the subjects compared with baseline values.
Basal and Prandial Insulin Doses
Reported subject compliance with treatment was 100% throughout the study. All subjects received insulin aspart 0.6 U/h for 24 hours, totaling 14.4 U/day for each of the 7 treatment days. The mean prandial insulin dose during the 7-day treatment period ranged from 4.3 to 7.3 U per meal in each subject; total daily prandial doses of insulin ranged from 16.7 to 19.6 U in each subject. The mean ± SEM daily total insulin aspart dose with the V-Go was 31.5 ± 3.1 and 32.3 ± 3.2 U for the inpatient and outpatient periods, respectively.
Glycemic Control
Of the (3 + 3) × 11 × 6 = 396 glucose concentration measurements for a complete 11-point profile data set, we missed seven data points in all spread out on five subjects with nobody missing more than two values. During the inpatient phase, FBG values were similar to the values observed at baseline (148 vs 146 mg/dl; mean ± SEM change 2 ± 4 mg/dl; P = 0.8438). FBG levels during the outpatient phase were similar to those recorded at baseline, with an average of 150 mg/dl over days 4 to 7 (3 ± 6 mg/dl; P = 0.5625). A trend toward decreased blood glucose values was observed before lunch compared with baseline (-35 ± 27 mg/dl; P = 0.4375), as well as blood glucose values before dinner (-38 ± 25 mg/dl; P = 0.1563). There was a trend toward decreased postprandial blood glucose (Figure 2). Averages of values obtained on each of the 3 inpatient treatment days showed 2-hour postprandial blood glucose concentrations that trended lower from 231 to 195 mg/dl [nonsignificant (NS)] at breakfast, 234 to 166 mg/dl (NS) at lunch, and 222 to 171 mg/dl (NS) at dinner (Figure 2). Significant improvements in nighttime metabolic control were observed during the inpatient phase of the study. Bedtime blood glucose decreased (mean change from baseline, -52 ± 21 mg/dl; P = 0.0313), as did nighttime (3:00AM) measurements (-20 ± 9 mg/dl; P = 0.0313).
Figure 2.
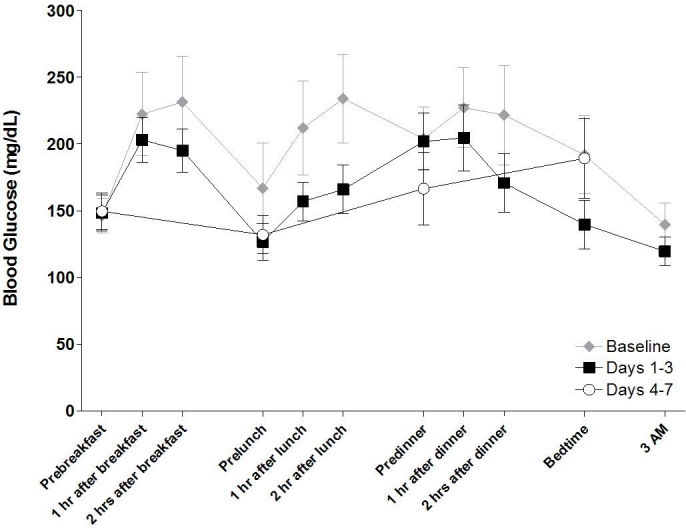
Mean 11-point blood glucose profiles during inpatient and outpatient periods. Each profile represents the average of values obtained for each collection period.
Glucose Profiles Measured by CGM
As measured by CGM, overall glycemic control tended to improve, with mean ± SEM continuous glucose values decreased from 173 ± 23 to 157 ± 17 mg/dl (P = 0.063) and 156 ± 17 mg/dl (P = 0.219) during inpatient and outpatient periods, respectively (Figure 3). The mean fractional time spent in hypoglycemia (<70 mg/dl; Figure 4) trended lower from baseline, changing from -6 ± 2 to 5 ± 3% during both inpatient and outpatient periods (NS); the inpatient mean change was -1 ± 3% (P = 0.6875). The mean time spent in euglycemia (70–180 mg/dl) increased from baseline (57 ± 12%), the inpatient mean change was 7 ± 5% (P = 0.1563), and the outpatient mean change was 7 ± 9% (P = 0.5625; Figure 5). These results are consistent with capillary blood glucose measurements. Glycemic variability assessed by the M value similarly tended to decrease from 33 ± 9 to 25 ± 4 (NS) and 21 ± 4 (NS) for inpatient and outpatient periods, respectively (Figure 6). Individual subject's data and means for all subjects for glucose concentrations as measured by CGM, fractional time spent in hypoglycemia, fractional time spent in euglycemia, and M values are displayed in Figures 3 to 6.
Figure 3.
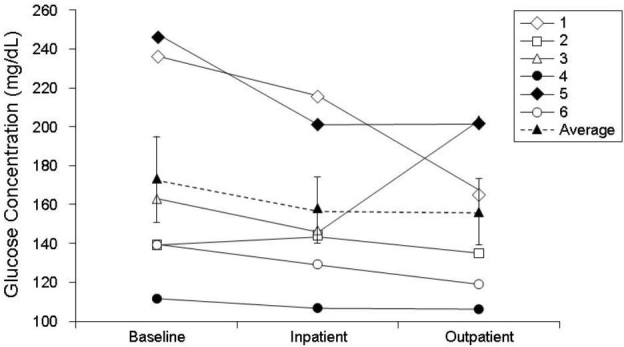
Changes in blood glucose concentrations from baseline to end of study for each subject. Data are presented as overall mean ± SE (dashed line).
Figure 4.
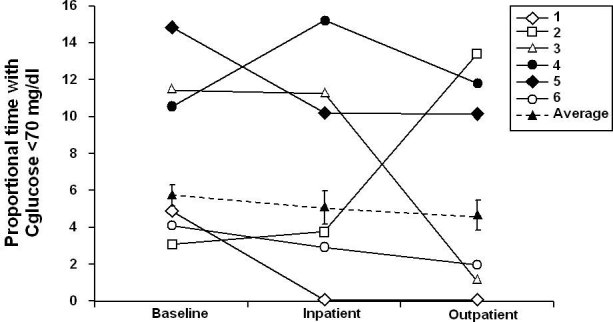
Mean time spent in hypoglycemia (<70 mg/dl) from baseline to end of study.
Figure 5.
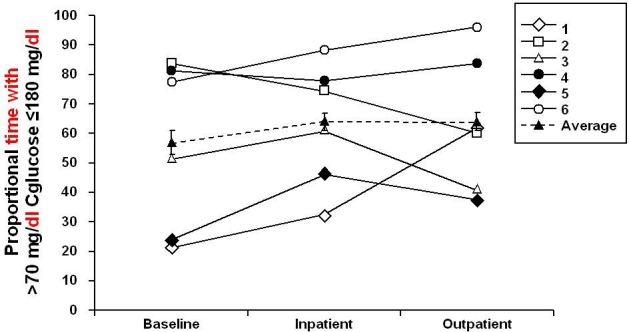
Mean time spent in euglycemia (70–180 mg/dl) from baseline to end of study.
Figure 6.
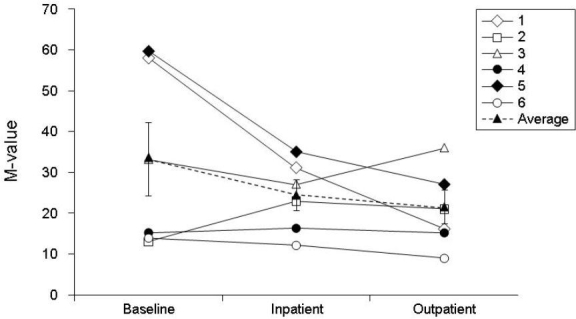
Glycemic variability assessed by M value from baseline to end of study for each subject. Data are presented as overall mean ± SE (dashed line).
Safety Findings
The V-Go was generally well tolerated. Two subjects experienced one AE each. One case of mild hypoglycemia was judged to be possibly related to the insulin delivered by the V-Go, whereas a mild questionable case of erythema or phlebitis in the left lower arm was most probably not related to the V-Go device. There were no serious AEs or other events of medical significance during the study, and none of the subjects discontinued the study early.
Three subjects experienced grade 1 irritation (erythema) at the application site on days 6 and 7. One subject experienced grade 1 (mild) swelling at the application site on days 6 and 7. There were no occurrences of ecchymosis, hematoma, tearing, or laceration associated with the V-Go during the study. One subject exhibited transient phlebitis of the left lower arm observed during the physical examination at day 4, which was not clinically significant.
No significant abnormalities or notable changes in vital signs, ECGs, or laboratory assessments were noted during the 7 days of treatment.
Discussion
In six insulin-treated T2DM subjects, CSII performed with the V-Go was efficacious in providing sufficient glycemic control during 1 week of therapy. The baseline FBG had already decreased from the screening value average of 174 mg/dl, indicating that study participation alone resulted in a decrease in FBG concentrations. Changes in fasting metabolic control were minimal compared with pretreatment observations, despite a mean reduction in the basal insulin dose of 19 U, but there was a trend toward decreases in postprandial glucose excursions during the study with prandial insulin applications. Although the changes in FBG from baseline were not significant, there was a trend toward a decreased magnitude of glucose excursions. Data from CGM also showed no significant differences from prestudy use of glargine but suggest that the V-Go provides at least comparable metabolic control. That the differences observed were not significant is most probably because of the small sample size in this proof-of-concept study.
The device demonstrated excellent adhesion to the skin; all 42 devices remained firmly attached for each 24-hour treatment period. A few of the devices did not deploy the needle successfully and these patients removed that particular device, applied a new device, and deployed the needle successfully. Subsequently, the prototype device used in this trial has been modified to change the needle retraction and lock-out feature from a two-button process to a one-button process, which has corrected this inadvertent deployment failure issue. In addition, the device has been modified to provide expanded dosing options. Subjects reported no pain or discomfort in wearing or removing the V-Go. They also reported that the device was convenient to wear and use during normal daytime activities and while sleeping.
The V-Go appears to be a safe and reliable method for the delivery of basal and prandial insulin, with the potential to facilitate more consistent insulin delivery and provide better control of fasting and postprandial glycemia, which may improve long-term metabolic control. Additional studies of the V-Go in larger numbers of subjects are required to refine the practical benefit of this novel device.
Acknowledgements
Portions of these data were presented at the 2007 American Association of Clinical Endocrinologists and 2007 American Diabetes Association meetings. We recognize editorial assistance provided by Arleen DeCicco. Funding and editorial support were provided by Valeritas, LLC.
Abbreviations
- AEs
adverse events
- CGM
continuous glucose monitoring
- CSII
continuous subcutaneous insulin infusion
- DCCT
Diabetes Control and Complications Trial
- ECG
electrocardiogram
- FBG
fasting blood glucose
- FPG
fasting plasma glucose
- HbA1c
hemoglobin A1c
- NS
nonsignificant
- OADs
oral antidiabetic drugs
- SC
subcutaneous
- T2DM
type 2 diabetes
References
- 1.Hermansen K, Davies M, Derezinski T, Martinez Ravn G, Clauson P, Home P. A 26-week, randomized, parallel, treat-to-target trial comparing insulin detemir with NPH insulin as add-on therapy to oral glucose-lowering drugs in insulin-naive people with type 2 diabetes. Diabetes Care. 2006;29(6):1269–1274. doi: 10.2337/dc05-1365. [DOI] [PubMed] [Google Scholar]
- 2.Kennedy L, Herman WH, Strange P, Harris A. Impact of active versus usual algorithmic titration of basal insulin and point-of-care versus laboratory measurement of HbA1c on glycemic control in patients with type 2 diabetes: the Glycemic Optimization with Algorithms and Labs at Point of Care (GOAL A1C) trial. Diabetes Care. 2006;29(1):1–8. doi: 10.2337/diacare.29.01.06.dc05-1058. [DOI] [PubMed] [Google Scholar]
- 3.Riddle MC, Rosenstock J, Gerich J Insulin Glargine 4002 Study Investigators. The treat-to-target trial: randomized addition of glargine or human NPH insulin to oral therapy of type 2 diabetic patients. Diabetes Care. 2003;26(11):3080–3086. doi: 10.2337/diacare.26.11.3080. [DOI] [PubMed] [Google Scholar]
- 4.Implementation of treatment protocols in the Diabetes Control and Complications Trial. Diabetes Care. 1995;18(3):361–376. doi: 10.2337/diacare.18.3.361. [DOI] [PubMed] [Google Scholar]
- 5.Tanenberg R, Zisman A, Stewart J. Glycemia Optimization Treatment (GOT): glycemic control and rate of severe hypoglycemia for 5 different dosing algorithms of insulin glargine in patients with type 2 diabetes. American Diabetes Association 66th Scientific Sessions; Jun 9–13; Washington, DC. [Google Scholar]
- 6.Strange P. Treat-to-target insulin titration algorithms when initiating long or intermediate acting insulin in type 2 diabetes. J Diabetes Sci Technol. 2007;1(4):540–548. doi: 10.1177/193229680700100412. [DOI] [PMC free article] [PubMed] [Google Scholar]
- 7.Monnier L, Lapinski H, Colette C. Contributions of fasting and postprandial plasma glucose increments to the overall diurnal hyperglycemia of type 2 diabetic patients: variations with increasing levels of HbA(1c) Diabetes Care. 2003;26:881–885. doi: 10.2337/diacare.26.3.881. [DOI] [PubMed] [Google Scholar]
- 8.Petrak F, Stridde E, Leverkus F, Crispin AA, Forst T, Pfutzner A. Development and validation of a new measure to evaluate psychological resistance to insulin treatment. Diabetes Care. 2007;30:2199–2204. doi: 10.2337/dc06-2042. [DOI] [PubMed] [Google Scholar]
- 9.Brewer KW, Chase HP, Owen S, Garg SK. Slicing the pie. Correlating HbA-values with average blood glucose values in a pie chart form. Diabetes Care. 1998;21:209–212. doi: 10.2337/diacare.21.2.209. [DOI] [PubMed] [Google Scholar]
- 10.Schlichtkrull J, Munck O, Jersild M. The M-valve, an index of blood-sugar control in diabetics. Acta Med Scand. 1965;177:95–102. doi: 10.1111/j.0954-6820.1965.tb01810.x. [DOI] [PubMed] [Google Scholar]