

Abstract
This article presents a mathematical model of glucose homeostasis that is valid during physical activity. Known changes in glucose dynamics during exercise were accounted for in the model, and exercise itself was detected and quantified through heart rate (beats per minute). The model was successfully fit to 21 type 1 diabetic subjects during a hyperinsulemic clamp protocol, and performance of the new model was compared with the standard minimal model of glucose kinetics that it was derived from.
Keywords: exercise, glucose dynamics, insulin sensitivity, minimal model, physiological modeling
Introduction
In health, blood glucose (BG) is tightly controlled by a hormonal network that includes the gut, liver, pancreas, and brain, ensuring stable fasting BG levels (∼80–100 mg/dl) and transient postprandial glucose fluctuations. Diabetes is a combination of disorders characterized by absent or impaired insulin action, resulting in hyperglycemia. Intensive insulin and oral medication treatment to maintain nearly normal levels of glycemia markedly reduces chronic complications in both type 1 diabetes mellitus (T1DM)1 and type 2 diabetes mellitus,2 but may cause a risk of potentially life-threatening severe hypoglycemia (SH). This SH results from imperfect insulin replacement, which may reduce warning symptoms and hormonal defenses.3 Consequently, hypoglycemia has been identified as the primary barrier to optimal diabetes management.4
Since the appearance of new technologies in glucose sensing and insulin infusion it is now possible to observe and act upon the glucose/insulin levels using real-time measurements: the sampling frequency of most meters is smaller or equal to 5 minutes. Therefore, increasing scientific and industrial effort is focused on the development of closed loop systems (e.g., artificial pancreas) to control the carbohydrate metabolism of people with diabetes, particularly those with T1DM. Experiments are being conducted with continuous glucose monitors coupled with an insulin pump and a control algorithm.5–7 While such systems have proven feasible in steady metabolic states, they fail during changing metabolic demands, such as meals and physical activity. While the problem in meals management is mainly how to inject, in a timely fashion, enough insulin to return to the targeted blood glucose value in a minimum amount of time, avoiding hypoglycemia, the challenge with physical activity is that we are not reacting to a perturbation (such as glucose entering the blood via the gastrointestinal track) but rather a transient change in the glucose/insulin dynamics' parameters, leading to increased effectiveness of insulin8 and potentially to hypoglycemia.
These changes are well known, although not always precisely quantified, and revolve mostly around changes in glucose transport through the cell membrane and vascular changes. Exercise has been shown to augment the availability of glucose transporter-4, both by translocation to the cell membrane9–11 and by increased transcription in muscle cells.12,13 These changes have been shown to be associated with an increase in insulin sensitivity and insulin-independent glucose uptake.8,11,14,15
Two major routes to closed loop control are actually under study: reactive algorithms (proportional integral derivative and linear quadratic Gaussian) and model predictive algorithms. Both methods are still being developed and no definite conclusions can yet be drawn on their ability to control both meals and exercise, but while the first method is blind to any glucose dynamics, the performances of the second could be improved greatly by a model including exercise. This article focuses on the model predictive control and the need of a manageable (identifiable parameters, limited number of states) exercise model.
Glucose/insulin dynamics have been modeled since the 1960s,16 and therefore dozens of models have been presented, although two major models are still at the center of the recent modeling effort: the Bergman–Cobelli minimal model of glucose kinetics (MMGK)17–19 and the T1DM model by Hovorka.6
Notwithstanding these modeling efforts, modeling glucose homeostasis during exercise has not yet reached the engineering literature mainstream. Although studied abundantly, the effect of exercise on glucose/insulin dynamics has been approached mainly in medical and biological terms, and concepts such as glucose transporter translocation, insulin sensitivity increase, or changes in transcription of transporters have been shown but never with a systemic approach in mind. It is not to say that models have not been used to study these phenomenons, but they have not been modified to take these changes into account, with research relying on pre–post comparison instead.8 Two counterexamples are to be noted: Derouich and Boutayeb in 200220 and Kim and colleagues in 2007.21 Both treat models of exercise at two opposite ends of the model spectrum: a minimal model for one and an extensive chemically based model for the second. Neither of these models includes heart rate.
Method
Subjects and Protocol
Data used for estimation of the model come from a hyperinsulemic clamp protocol with euglycemia stabilization, exercise, and hypoglycemia descent/recovery periods. Blood glucose was measured every 5 minutes (Yellow Springs Instruments), as well as injected insulin and dextrose (pump parameters associated with solution concentrations).
Twenty-one T1DM subjects underwent this euglycemic (at 100 mg/dl) hyperinsulemic clamp protocol, including an initial 1.5-hour steady-state period, followed by a 15-minute moderate exercise period at half VO2max and 30 minutes relaxation.
Mathematical Model of Glucose Homeostasis during Exercise
This model was derived from the minimal model of glucose kinetics.17 The initial 2 states–2 controls–6 parameters model was expanded to a 4 states–3 controls–11 parameters exercise model. The glucose equation from the MMGK was modified by taking into account both increased glucose uptake due to increased energy consumption (Y) and longer lasting changes in insulin action (Z).
Equation (4) was designed so that, during an exercise bout, V rises quickly (speed, f(Y) + 1/π, depending on intensity of exercise) and decreases much slower after exercise (1/π). Y [Equation (3)], however, is a filtered differential heart rate intended to mimic the increase in energy expenditure based on the literature finding that, at steady state, heart rate is highly correlated to the volume of oxygen consumed, which in turn is highly correlated to energy expenditure. Thus, in this model, exercise intensity and duration were accounted for through the use of heart rate.
| 1 |
Model Estimation and Validation
Data from this study did not allow for all parameters of the model to be estimated; for example, the exercise parameters πHR, π, and n were fixed for all subjects.
πHR was set at 5 minutes to include both energy expenditure adaptation22 and heart rate reaction to augmentation of energy expenditure.23
π and n were set for allowing detection of spikes more than 10% above basal heart rate (see Figure 1).
Figure 1.

Effect of heart rate (beats per minute, bpm) spike on model insulin sensitivity.
Because insulin was not measured during the protocol, the plasma concentration was not available, and we alternatively used the population parameters for volume of insulin dispersion and half-life of insulin in plasma. Therefore, insulin concentration is derived from injected insulin; Ib is “measured” as the steady state of the basal injection before the beginning of the clamp protocol.
Estimated Parameters
The seven remaining parameters were fit using a combination of nonlinear least-square fitting and Bayesian constraints. Both Gb and Vg were constrained around mean values with coefficient of variance values of 50% and 20%, respectively. The mean value for Gb was chosen as the initial glucose measure from the protocol, and Vg was estimated around its literature population mean (1.88 dl/kg). Parameters were limited by lower and upper bounds to retain physiological validity of the model (e.g., p2 could not be smaller than 0.01). A weighted least-square function was recursively minimized using a large-scale, trust region method (default of Matlab lsqnonlin function), with the starting point of iteration n + 1 calculated as a random perturbation of the optimization result at n, weighted by goodness of fit.
Validation
Weighted mean square errors (WMSE) are reported, and the exercise MMGK is compared with the regular MMGK (p2 constraint to be greater than 0.01).
Results
Twenty-one subjects were fitted with the previously described method. The WMSE was 7.77 ± 0.82; the parameter averages are reported in Table 1. It should be noted that parameters varied greatly among subjects (although stay of the same order of magnitude).
Table 1.
Parameter Averages and Standard Minimal Model Results
| A | Parameters | |
|---|---|---|
| Mean | SE | |
| Gb | 172 | 6.2 |
| p1 | 4.10E-03 | 1.10E-03 |
| p2 | 1.55E-02 | 1.70E-03 |
| SI | 4.46E-04 | 3.21E-05 |
| α | 0.974 | 0.107 |
| β | 3.39E-04 | 5.58E-05 |
| Vg | 2.028 | 0.0346 |
| B | WMSE | ||
|---|---|---|---|
| EMMGKa | MMGK p2 > 0.01 | MMGK | |
| Mean | 7.7 | 17.7 | 18.6 |
| SE | 0.82 | 0.74 | 0.76 |
Exercise minimal model of glucose kinetics.
The exercise minimal model was able to follow glucose dynamics during and after exercise and, most importantly, follow the descent in hypoglycemia (Figure 2) while avoiding unrealistic parameter values, whereas the standard MMGK forced value of p2 close to 0.001, meaning steady-state insulin, was not reached before 24 to 48 hours after start of the clamp procedure.
Figure 2.
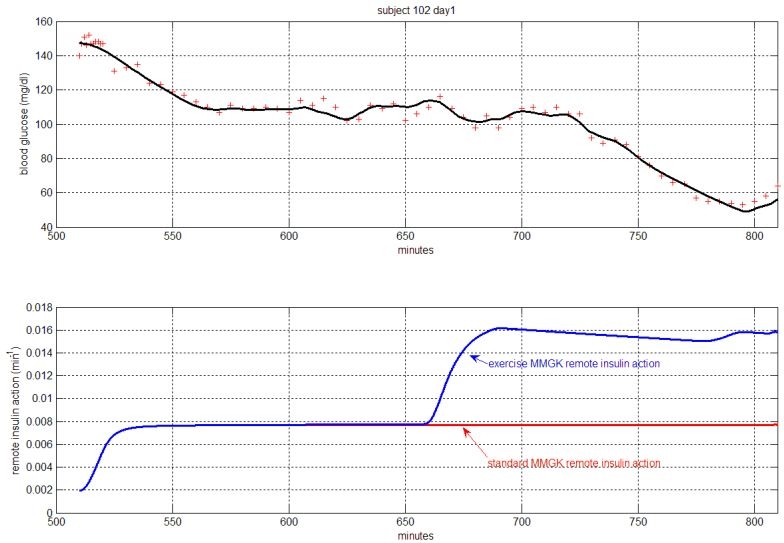
An example of fit.
Standard minimal model results are presented in part B of Table 1.
Discussion
This article presented what the author believes is the first functional exercise model of glucose homeostasis. Although a few models have been published previously, it is the first time such a model was fit individually to T1DM patient data. Results presented show the good performances of the model in predicting glucose during and after an exercise period. It is also the first use of heart rate as input in a glucose homeostasis model as a marker of energy expenditure.
This model was designed following the parsimony principle and was kept intentionally small, in terms of both states and parameters, as data fit permitted, therefore following the methodology presented by Bergman and colleagues.17 It is not to say that this model is minimal yet, but it was designed with minimization in mind.
This model represents a first effort from our group to tackle changes in glucose dynamics during and after exercise, and as such is not comprehensive. The two major unknowns about this model are due to lack of data: indeed liver glucose production was mostly shut down by the hyperinsulemic clamp, rendering any modeling of endogenous glucose production compensation of increased glucose uptake meaningless. Secondly, data do not provide any information on the training state of the subjects or on the effect training would have on glucose dynamics. In order to use this model in a closed loop algorithm, both issues will need to be addressed. The 24-hour period after exercise was not accessible to us, and even though parameters were chosen to reflect published results (significant difference after 20 hours, disputable at 24 hours),15 the dynamic of recovery from exercise-enhanced insulin sensitivity is not known.
It has not yet been proven that the minimal model approach is the one to follow to solve the model predictive closed loop problem. In particular, some important observed dynamics will probably need a more complex model than a two-compartment one. The exercise modification of glucose kinetics was designed to fit both the MMGK and the newest glucose homeostasis model presented in 2006 by Dalla Man and co-workers.24 Our data did not possess the depth needed for proper identification of this model, but future studies are planned to include more measured quantities, as well as the use of T1DM population parameters of this latest model.
In conclusion, the use of heart rate as a surrogate for physical activity was validated, which may ultimately permit closed loop control algorithms to not only maintain a safe euglycemic state during the night (actual state of the literature) and during a meal (pilot studies already available), but also during exercise, thus encompassing the two major metabolic disturbances occurring in vivo.
Acknowledgements
Special thanks go to Dr. Boris Kovatchev and Professor Claudio Cobelli for their critical appraisal and support.
Abbreviations
- BG
blood glucose
- MMGK
minimal model of glucose kinetics
- SH
severe hypoglycemia
- T1DM
type 1 diabetes mellitus
- WMSE
weighted mean square errors
References
- 1.The Diabetes Control Complications Trial Research Group. The effect of intensive treatment of diabetes on the development and regression of long-term complications of insulin-dependent diabetes mellitus. N Engl J Med. 1993;329:978–986. [Google Scholar]
- 2.UK Prospective Diabetes Study (UKPDS) Group. Intensive blood-glucose control with sulphonylureas or insulin compared with conventional treatment and risk of complications in patients with type 2 diabetes. Lancet. 1998;352(9131):837–853. [PubMed] [Google Scholar]
- 3.Gold AE, Deary IJ, Frier BM. Recurrent severe hypoglycemia and cognitive function in type 1 diabetes. Diabetes Med. 1993;10(6):503–508. doi: 10.1111/j.1464-5491.1993.tb00110.x. [DOI] [PubMed] [Google Scholar]
- 4.Cryer PE. Hypoglycemia: the limiting factor in the glycaemic management of Type I and Type II diabetes. Diabetologia. 2002;45(7):937–948. doi: 10.1007/s00125-002-0822-9. [DOI] [PubMed] [Google Scholar]
- 5.Trustees of Boston Univ. Damiano E, El Khatib F. Fully automated control system for type 1 diabetes. Patent WO/2006/124716. 2006 Nov 23; [Google Scholar]
- 6.Hovorka R, Shojaee-Moradie F, Carroll PV, Chassin LJ, Gowrie IJ, Jackson NC, Tudor RS, Umpleby AM, Jones RH. Partitioning glucose distribution/transport, disposal, and endogenous production during IVGTT. Am J Physiol Endocrinol Metab. 2002;282(5):E992–1007. doi: 10.1152/ajpendo.00304.2001. [DOI] [PubMed] [Google Scholar]
- 7.Steil GM, Rebrin K, Darwin C, Hariri F, Saad MF. Feasibility of automating insulin delivery for the treatment of type 1 diabetes. Diabetes. 2006;55(12):3344–3350. doi: 10.2337/db06-0419. [DOI] [PubMed] [Google Scholar]
- 8.Brun JF, Guintrand-Hugret R, Boegner C, Bouix O, Orsetti A. Influence of short-term submaximal exercise on parameters of glucose assimilation analyzed with the minimal model. Metabolism. 1995;44(7):833–840. doi: 10.1016/0026-0495(95)90234-1. [DOI] [PubMed] [Google Scholar]
- 9.Goodyear LJ, Hirshman MF, Horton ES. Exercise-induced translocation of skeletal muscle glucose transporters. Am J Physiol. 1991;261(6 Pt 1):E795–9. doi: 10.1152/ajpendo.1991.261.6.E795. [DOI] [PubMed] [Google Scholar]
- 10.Thorell A, Hirshman MF, Nygren J, Jorfeldt L, Wojtaszewski JF, Dufresne SD, Horton ES, Ljungqvist O, Goodyear LJ. Exercise and insulin cause GLUT-4 translocation in human skeletal muscle. Am J Physiol. 1999;277(4 Pt 1):E733–41. doi: 10.1152/ajpendo.1999.277.4.E733. [DOI] [PubMed] [Google Scholar]
- 11.Henriksen EJ. Invited review: Effects of acute exercise and exercise training on insulin resistance. J Appl Physiol. 2002;93(2):788–796. doi: 10.1152/japplphysiol.01219.2001. [DOI] [PubMed] [Google Scholar]
- 12.Dohm GL. Invited review: regulation of skeletal muscle GLUT-4 expression by exercise. J Appl Physiol. 2002;93(2):782–787. doi: 10.1152/japplphysiol.01266.2001. [DOI] [PubMed] [Google Scholar]
- 13.Ren JM, Semenkovich CF, Gulve EA, Gao J, Holloszy JO. Exercise induces rapid increases in GLUT4 expression, glucose transport capacity, and insulin-stimulated glycogen storage in muscle. J Biol Chem. 1994;269(20):14396–14401. [PubMed] [Google Scholar]
- 14.Borghouts LB, Keizer HA. Exercise and insulin sensitivity: a review. Int J Sports Med. 2000;21(1):1–12. doi: 10.1055/s-2000-8847. [DOI] [PubMed] [Google Scholar]
- 15.Goodyear LJ, Kahn BB. Exercise, glucose transport, and insulin sensitivity. Annu Rev Med. 1998;49:235–261. doi: 10.1146/annurev.med.49.1.235. [DOI] [PubMed] [Google Scholar]
- 16.Bolie VW. Coefficients of normal blood glucose regulation. J Appl Physiol. 1961;16:783–788. doi: 10.1152/jappl.1961.16.5.783. [DOI] [PubMed] [Google Scholar]
- 17.Bergman RN, Ider YZ, Bowden CR, Cobelli C. Quantitative estimation of insulin sensitivity. Am J Physiol. 1979;236(6):E667–77. doi: 10.1152/ajpendo.1979.236.6.E667. [DOI] [PubMed] [Google Scholar]
- 18.Cobelli C, Pacini G, Toffolo G, Saccà L. Estimation of insulin sensitivity and glucose clearance from minimal model: new insights from labeled IVGTT. Am J Physiol. 1986;250(5 Pt 1):E591–8. doi: 10.1152/ajpendo.1986.250.5.E591. [DOI] [PubMed] [Google Scholar]
- 19.Cobelli C, Caumo A, Omenetto M. Minimal model SG overestimation and Si underestimation: improved accuracy by a Bayesian two-compartment model. Am J Physiol. 1999;277(3 Pt 1):E481–8. doi: 10.1152/ajpendo.1999.277.3.E481. [DOI] [PubMed] [Google Scholar]
- 20.Derouich M, Boutayeb A. The effect of physical exercise on the dynamics of glucose and insulin. J Biomech. 2002;35(7):911–917. doi: 10.1016/s0021-9290(02)00055-6. [DOI] [PubMed] [Google Scholar]
- 21.Kim J, Saidel GM, Cabrera ME. Multi-scale computational model of fuel homeostatsis during exercise. Ann Biomed Eng. 2007;35(1):69–90. doi: 10.1007/s10439-006-9201-x. [DOI] [PubMed] [Google Scholar]
- 22.Ahlborg G, Felig P, Hagenfeldt L, Hendler R, Wahren J. Substrate turnover during prolonged exercise in man. Splanchnic and leg metabolism of glucose, free fatty acids, and amino acids. J Clin Invest. 1974;53(4):1080–1090. doi: 10.1172/JCI107645. [DOI] [PMC free article] [PubMed] [Google Scholar]
- 23.Fletcher GF, Balady G, Froelicher VF, Hartley LH, Haskell WL, Pollock ML. Exercise standards. A statement for healthcare professionals from the American Heart Association. Writing Group. Circulation. 1995;91(2):580–615. doi: 10.1161/01.cir.91.2.580. [DOI] [PubMed] [Google Scholar]
- 24.Dalla Man C, Rizza RA, Cobelli C. Meal simulation model of the glucose-insulin system. IEEE Trans Biomed Eng. 2007;54(10):1740–1749. doi: 10.1109/TBME.2007.893506. [DOI] [PubMed] [Google Scholar]