Abstract
Background
The quest toward an artificial β-cell has been accelerating, propelled by recent technological advances in subcutaneous glucose sensors and insulin pumps. The development and clinical testing of algorithms involves several challenges: communication and data transfer between a sensor and a pump via computer, a human interface presenting real-time information to the physician, safety issues when an automated system is used to administer insulin, and an architecture that supports different sensors, pumps, and control algorithms. These challenges were addressed in the development of a modular artificial β-cell system for clinical research.
Methods
The developmental environment of MATLAB® (The MathWorks, Inc., Natick, MA) allowed the flexible implementation of communication protocols for different sensors and pumps. The system has a plug-and-play option for the control algorithm and a human interface that presents and logs the data, enforces protocol safety rules, and facilitates physician oversight.
Results
A novel platform for use in clinical research trials was realized as a bridge toward a portable unit. This prototype encapsulates communication between the control algorithm, the pump, and the sensors. Its intuitive human interface presents all the relevant patient information to the physician and allows events to be electronically logged. It facilitates subject safety by way of integrated interlocks, checklists, and alarms.
Conclusion
The modular design of the system allows for the robust testing of various sensors and pumps as well as feedback control, meal detection, predictive hypoglycemia alarms, and device-related algorithms to detect sensor or pump failure.
Keywords: type 1 diabetes mellitus, closed-loop control, artificial pancreas
Introduction
An artificial β-cell can be simply described as a combination of hardware devices, namely, an insulin pump and a continuous glucose monitor (CGM), connected to a computer outfitted with software that runs a control algorithm for administering insulin according to a patient's needs, thereby maintaining glycemic control. The system needed for research purposes is far from simple and must address the following issues:
communication and data transfer from both a sensor and a pump to a computer, with each unique device requiring different communication protocols, as no communication standard has been adopted by the vendors (in the future, a communication standard would allow a flexible combination of pumps and sensors);
a human–machine interface (HMI) presenting real-time (RT) information to the physician and allowing data entry of events such as meals, activity, and other diagnostics such as capillary blood glucose (BG) measurements and control action overrides;
appropriate alarms and safeguards to address safety issues encountered when an automated system is used to administer insulin to subjects; and
an architecture that supports different sensors, pumps, and control algorithms.
A tailored, mobile, closed-loop system presented by Dudde et al.1 addressed these issues as part of the system design. Our prototype system generalizes this design to a modular platform that offers the freedom to use different type of sensors and pumps as well as different control algorithms, providing flexibility in clinical trial design while retaining a standardized main interface and data storage. In this current version, two different sensors are used: the FreeStyle Navigator® (Abbott Diabetes Care, Alameda, CA) and the STS7® (DexCom, San Diego, CA). The insulin pump is the current version of the OmniPod® (Insulet, Bedford, MA). Future versions will incorporate additional insulin pumps, and as additional sensors and pumps become available, the Plug-and-Play (PNP) concept allows for their integration in a simple, seamless manner. Control algorithms are linked-in with a separate shell file that communicates with the main algorithm, thus extending the modular design concept to the algorithms as well.
The following sections will describe the methods that were used to allow the automatic communication and data transfer between the subcomponents of the system as well as the PNP concept. The software capability and features are discussed and summarized in the Results and Conclusions sections, respectively.
Methods
We selected MATLAB® as the developmental environment. It is a leading platform for engineering prototyping that allows the flexibility to communicate using serial ports and Active X protocol (an automatic way to create and manipulate Microsoft software objects) for both hardware and software, the implementation of control algorithms, as well as the ability to customize a HMI with integrated interlocks.
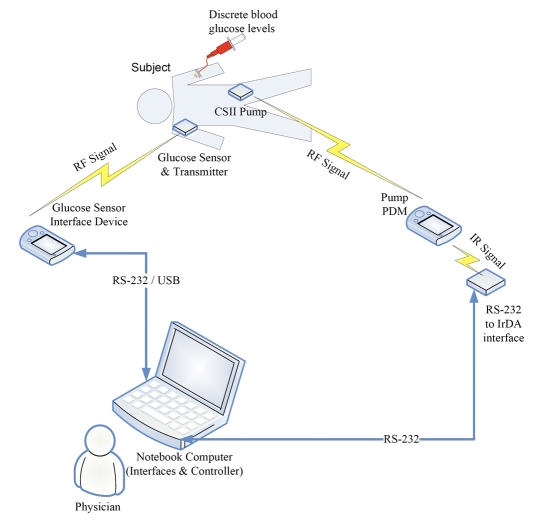
An overview of the system components and their configurations is illustrated in Figure 1. In this closed-loop system, there are two devices connected to the subject: a glucose sensor and a continuous subcutaneous insulin infusion (CSII) pump. The glucose sensor has a radio frequency (RF) transmitter that sends readings to the sensor receiver. The sensor signal is then transferred to the laptop computer using a serial (RS-232) connection or a universal serial bus (USB) connection. The CSII pump also uses a RF signal to communicate with its interface device, the personal diabetes manager (PDM). The PDM in turn communicates with the laptop computer via an infrared data association (IrDA) link, using an adapter connected through an RS-232 serial port.
Figure 1.
Schematic showing the components of the closed-loop system and identifying the communication links for each specific device. CSII is Continuous Subcutaneous Insulin Infusion; RF is Radio Frequency; PDM is Personal Diabetes Manager; RS-232 is a standard for serial binary data transfer; USB is Universal Serial Bus; and IrDA is Infrared Data Association.
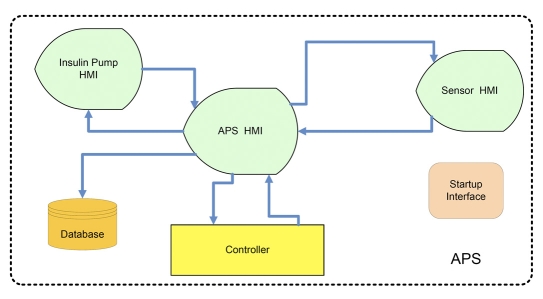
On the laptop computer, there is a graphical user interface (GUI) that runs on MATLAB®. This GUI is divided into three component interfaces: a main interface, an interface for the sensor, and another for the pump (Figure 2). The main interface oversees the closed-loop controller and presents all relevant information to the study staff. The sensor interface controls the sensor, logs all communication with the device, and transfers sensor readings to the main interface. Similarly, the pump interface controls the pump, logs all communication, and exchanges data with the main interface.
Figure 2.
APS layout showing the modularity concept. HMI denotes Human Machine Interface and APS is Artificial Pancreas Software.
The PNP concept is best illustrated in Figure 2, which presents an overview of the software modules. As can be seen, all are connected to the artificial pancreas software (APS) HMI, which is the main part of the software responsible for all communication, data transfer, data log, and display. By replacing either the sensor HMI or the pump HMI (each of which serve as a bridge between the main program and the hardware with a proprietary communication protocol), a closed-loop system may be implemented and tested with different devices. Furthermore, the controller block has the same modularity and can be realized using different control structures, from a simple proportional-integrative-derivative (PID) controller to a model predictive algorithm.
Results
This section describes the software architecture as well as the different subcomponents of the software, providing an overview of the software capabilities.
Software Architecture
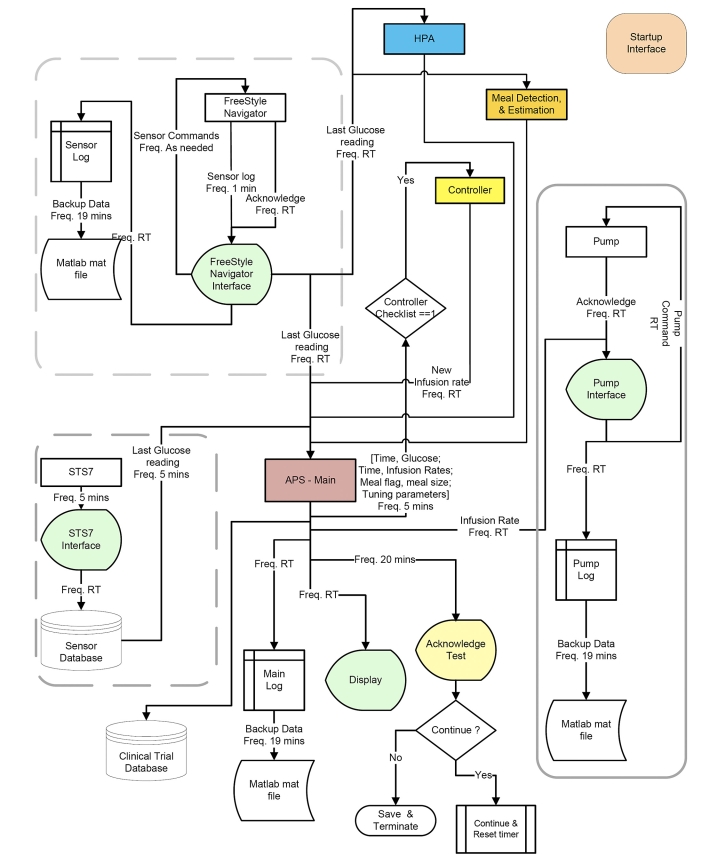
Simplicity and flexibility—the ideal goals of software architecture and design—can be achieved with PNP interfacing, thereby allowing easy product expansion. Figure 3 shows an engineering overview of the software layout and highlights the various subcomponents of the system. The arrows represent data transfer between modules and present both the frequency of communication and the content of the data packages. As can be seen from the layout, the system currently allows communication with two different sensors (highlighted by the dashed, rounded rectangles). The Abbott FreeStyle Navigator® and the DexCom STS7® utilize different methods to communicate with the hardware; each has its own bridge communication and display software. At the other end is the pump module (highlighted by the solid, rounded rectangle). The main software part, described here as the main interface, closes the loop between the sensor and the pump by way of a PNP control algorithm and related algorithms such as meal detection,2 meal estimation,3 and hypoglycemia prediction algorithms (HPAs).4 In principle, this Lego®-like structure allows both easy expansion of the system and flexibility in conducting clinical trials with different hardware components, because there is no need to change the main HMI used by and familiar to the clinical team.
Figure 3.
Engineering overview of the software layout highlighting data transfer packages between modules and presenting the frequency of communication as well as the content of the package. APS denotes Artificial Pancreas Software; HPA is Hypoglycemia Prediction Algorithm; and RT is Real Time.
Startup
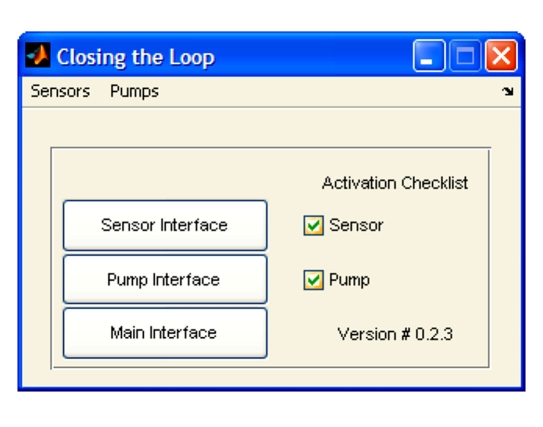
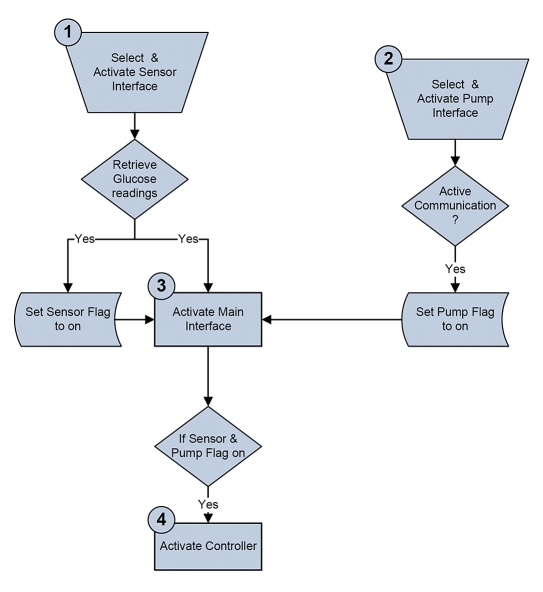
A detailed startup procedure was created, wherein the user has to select the sensor and pump and approve each step by marking a checkbox as detailed here and shown in Figure 4. This validation procedure provides protection from accidental activation of the closed-loop system or from the omission of a critical initialization step. The startup sequence involves the following steps (illustrated in Figure 5):
Select a sensor from the sensor submenu and invocation of the sensor interface to establish communication with the sensor. This initiates the RT retrieval of the CGM readings. To proceed, the user must confirm that the sensor is active by checking the checkbox.
Select a pump, activate the pump interface, establishing communication with the pump, and then verify that the pump is active.
Finally, the main HMI can be activated with the option to run a closed-loop session.
Figure 4.
Activation interface realized in a simple and safe design.
Figure 5.
Activation sequence that guarantees that the controller will only be enabled once all of the elements are running correctly.
Sensor and Pump Communication and Control
A fully closed-loop system requires RT communication with the sensor in order to retrieve glucose values and additional parameters as well as communication with the insulin pump. Hence a vital component of the system is the bridge between the main program and the hardware. Each sensor and pump has its own bridge code due to different communication protocols set by individual vendors. The following subsections describe the communication and control setups for the components used in this study.
Abbott FreeStyle Navigator® Human–Machine Interface
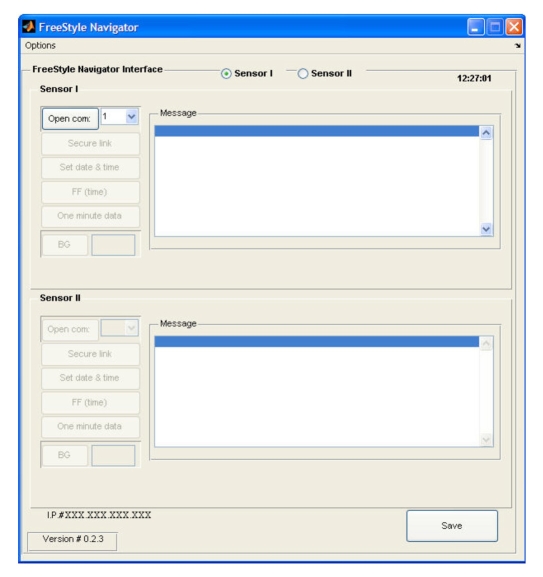
The FreeStyle Navigator® HMI (shown in Figure 6) enables communication with one or two FreeStyle Navigator® receivers and transmits the readings to the main interface. In the default configuration, only one sensor is activated, but a second sensor can be accommodated using the sensor II radio button. Each sensor has a corresponding set of setup and control buttons on the HMI. The description and functionality of these buttons is as follows:
“open serial port” opens the serial port that the user selects from the pull-down list of available ports;
“secure link” keeps the sensor's communication port active;
“set date & time” sets the sensor time and date to be the same as those of the computer;
“FF (time)” is the engineering command to skip the calibration time, which is to be used only if the insertion time is lost (e.g., when placing the sensor receiver in the cradle) or if the sensor is calibrated to a different receiver while the subject is at home prior to admission;
“one minute data” activates the option to receive 1 min data from the sensor, which is then presented in the message box and as a graphic display in a MATLAB® figure or in the main interface if the main interface is active;
“BG” sends a capillary BG reading (entered into the edit box to the right of the BG button) to the sensor unit if calibration is needed; and
“save button” saves the data from both sensors in both MATLAB® mat and Microsoft Excel® file formats.
Figure 6.
FreeStyle Navigator® HMI.
Additional functionalities (e.g., a hypoglycemia detection alarm) can be activated using the options tag. To facilitate engineering support, the Internet protocol (or IP) number of the computer is displayed in the lower left corner of the interface. Proper and safe use of the communication HMI is enforced at each step, wherein the next activation step within the series is not enabled until the preceding step is validated as successful by the internal checking of an acknowledgment statement.
DexCom STS7® Human–Machine Interface
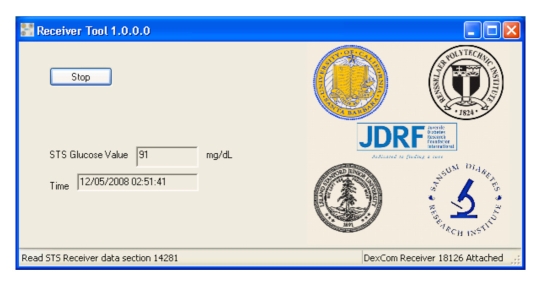
A different HMI was created for the STS7® sensor, as shown in Figure 7. The receiver tool HMI enables communication with the receiver and transmits the readings to the main interface. It also allows the user to save data to both MATLAB® mat files and Microsoft Access® files.
Figure 7.
DexCom STS7® receiver tool HMI presenting the last sensor reading with the appropriate data time stamp.
The following steps and communication paths are implemented when the receiver tool HMI is launched:
the startup procedure automatically detects the STS7® receiver connected via a USB cable and presents the receiver's serial number in the lower right corner of the interface;
the tool reads the sensor memory;
when a user clicks on the Start/Stop toggle button, the tool communicates with the receiver and checks for new glucose values;
if new values are available, they are presented in the interface with their respective date and time stamps and sent to a Microsoft Access® database; and
the main HMI queries the receiver tool database for the latest record every 30 s.
Insulet OmniPod® Human–Machine Interface
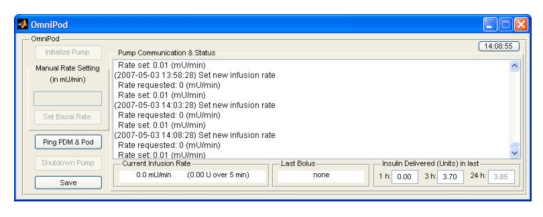
The OmniPod® HMI implements all the functionality related to the infusion of insulin. On the user interface side, it allows manual control and testing of the pump communications link. This module also implements the functionality that translates a continuous infusion rate setting into the proper sequence and timing of microboluses, mimicking the way CSII pumps deliver basal infusions. Other functions include the ability to administer a discrete bolus (for cases in which the controller uses such a strategy for prandial insulin dosing). The HMI for the OmniPod® pump (Figure 8) allows the user to interact with the insulin infusion pump in several capacities. The actions the user can initiate are
initialize the pump (i.e., start the sequence to put the pump under computer control);
set a manual basal infusion rate when the system is not under closed-loop control;
ping the pump to confirm that the RF communication link is working properly;
shut down the pump; and
request the pump data log be saved at any point during the test.
Figure 8.
OmniPod® HMI displaying insulin infusion data 3.85 h into a trial.
The HMI also presents detailed information regarding the operation of the pump. This information includes the full log of communication from the computer to the pump and the corresponding responses as well as other actions related to the pump. The HMI shows the current infusion rate at which insulin is being delivered, information of the last insulin bolus delivered (if any), and the total amount of insulin delivered over the previous 1, 3, and 24 h. If the corresponding time period has not completely elapsed, the amount is displayed in gray to indicate the total at the moment. The current state of the pump determines which actions are allowed to be executed at any given point in time.
Artificial Pancreas Software Human–Machine Interface—Physician Human–Machine Interface
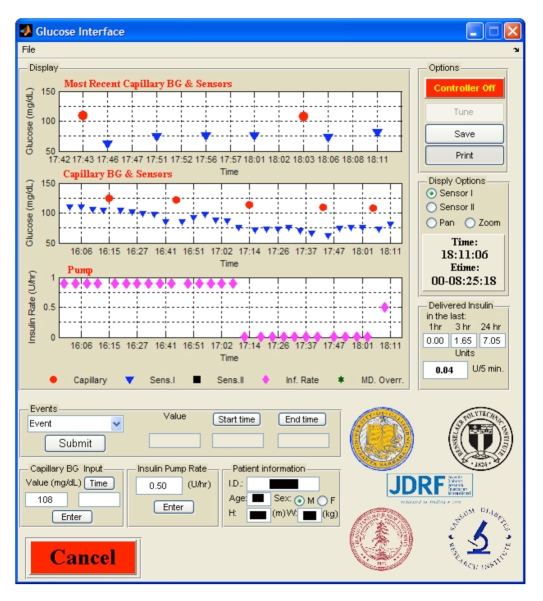
The APS, or main interface, acts as the main screen that the physician uses to oversee a clinical trial (Figure 9). It is connected to the sensor interface, the pump interface, and in a closed-loop mode, the controller. The APS HMI
includes the clinical information collected during a closed-loop clinical trial,
allows the physician to interact with the insulin pump and to override the automated infusion rate,
presents all the information needed to conduct the test
allows a way to terminate the test,
incorporates audio and visual alarms, and
contains a watchdog alarm that asks for periodic acknowledgment of the trial.
Figure 9.
Sample view of the APS HMI. The current and past data are represented including capillary BG measurements, glucose sensor readings (5 min interval), pump infusion rate, the current infusion rate, and the accumulated delivery.
The main HMI functions can be described as follows:
A graphic display of both the insulin infusion rate and the glucose readings is presented to the user with different symbols and colors. The data are presented in three plots: the upper plot presents glucose readings from the last 15 min and the middle plot presents glucose readings from the last hour. Each sensor plot can present up to two sensors as well as reference glucose readings. The lower plot provides information on the pump infusion rate for the last hour. The 1 h sensor and the 1 h insulin infusion rate are time synched. The interface provides the user the capability to pan and zoom and to select which sensor to present.
The advanced electronic logging of various events that can take place during the trial. This option allows the medical staff to enter and log events with their time stamps, and the events are saved in MATLAB® format as well as in a Microsoft Excel® table. This provides an easy way to keep track of events without the need of paper records. The predefined events are meals (breakfast, lunch, dinner, and snack) that require the meal carbohydrate amount, start time, and end time; activity, including a comment on intensity, such as mild or moderate, and the activity start and stop times; manual sensor entry; and bathroom breaks. Any other event or annotation that the medical staff would like to log may be entered into a text entry field, which is date and time stamped.
Reference BG values are easily entered and are date and time stamped by filling the appropriate fields. This logs the information, plots the value, and asks the user whether to send the value to the sensors for calibration.
The latest insulin infusion rate is presented in an edit box that allows the physician to override by specifying a different rate and clicking on the enter button. This sets the new infusion rate, logs the entry in the database with a specific annotation indicating it was a manual entry, and makes the information available to the controller. Furthermore, the amount of insulin delivered in the last 1, 3, and 24 h as well as how many units were delivered in the last 5 min are presented. This allows the physician to remain informed of the amount of insulin the subject has received so far during the trial without having to calculate quantities from the infusion rate profile to ease the tracking of insulin delivery.
The storage of subject information such as patient identification number, age, sex, height, and weight.
Other options include saving the data as a MATLAB® file and as a Microsoft Excel® file using the save button, producing full-size figures of the three plots using the print button, and activating the control algorithm using the controller toggle button.
Control Algorithm
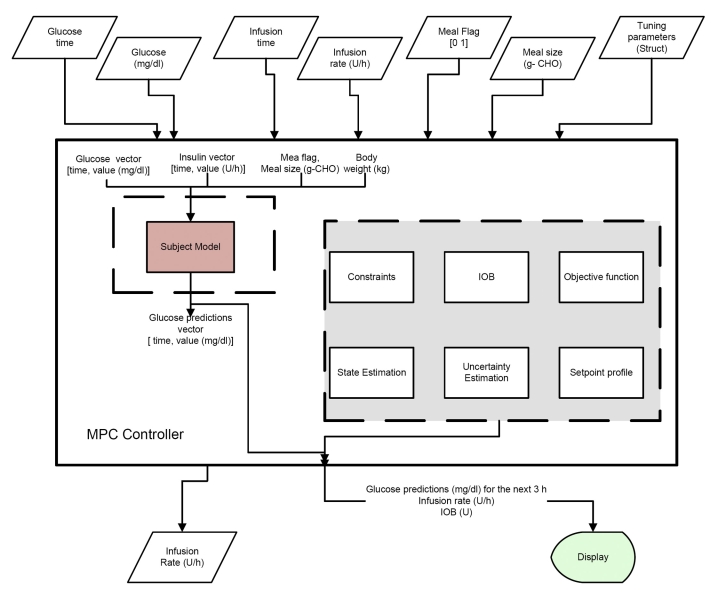
The final link in a closed-loop system is the control algorithm that computes the insulin infusion rate based on the system inputs. As part of the PNP concept, the controller block is set up as a separate entity named CONTROLLER. Every 5 min, the APS queries the controller for a new infusion rate. This structure allows flexibility in the design of the control algorithm, accommodating PID control,5 model predictive control (MPC)6, nonlinear MPC,7 or any other algorithm, such as fuzzy logic.8 As can be seen from an overview of a suggested implementation of a MPC (Figure 10), the controller block accepts several inputs from the APS and calculates the new infusion rate. This allows for validation and verification of multiple controller implementations in a clinical setting with different structures and constraints without the need to deal with the hardware communication separately for each configuration. The different input and output arguments are as follows:
-
Input
Glucose time: vector of times of the glucose sensor in MATLAB® datenum format
Glucose values: vector with history of glucose values (mg/dl)
Insulin time: vector of times of the infusion rate in MATLAB® datenum format
Insulin rate: vector with infusion rate history (U)
Meal flag: a flag that returns a value of 1 if a meal has been detected within the last 5 min, otherwise it returns 0 for no meal detected
Meal size: an optional input for meal size estimation or user input (grams carbohydrate)
Tuning parameters: optional handle that allows the tuning parameters to be sent to the controller
-
Outputs
rate: new infusion rate (U/h)
bolus: optional discrete bolus (U)
Figure 10.
Schematic showing implementation of MPC in the framework of the APS, where IOB is an insulin-on-board calculation.
Safety
An artificial β-cell implementation, even in a clinical research center (CRC) environment, should include inherent safety protocols and several interlocks that can prevent mistakes by the operator. This concept has been one of the main design concepts of the system and has been implemented throughout the different modules by checking acknowledgment commands and enabling different functions in a predefined order. As a secondary layer of protection, a set of audio and visual alarms alerts the user to any sensor or pump error. A warning message appears both on the main HMI and on a popup window with a description of the error and with a different sound for the sensor and the pump. On top of that, a safety interlock has been implemented in the form of a watchdog alarm that asks for a periodic (20–30 min) acknowledgment of the closed-loop trial. Any interaction with the APS during this time window, such as a manual override of the insulin infusion rate or entry of BG value, resets the watchdog timer. However, an absence of interaction invokes a warning dialog that asks the user to acknowledge the closed-loop test. If acknowledged, the watchdog timer resets the countdown; otherwise, within 5 min of an unacknowledged warning, the system terminates the closed-loop, sets a default basal rate, and issues an annoying sound alarm.
Conclusions
The APS software serves as a flexible tool, allowing clinicians and engineers to conduct clinical trials in a CRC setting without the need to deal directly with the communication protocols of sensors, pumps, and controllers or the need for creating their own data log and display. This novel implementation provides an easy and safe way to work with different controllers and related algorithms for better glycemic control of people with diabetes. The PNP concept allows easy expansion of the software, enabling it to communicate with other vendors' sensors and pumps without the need to redesign the main HMI. Moreover, any outcome from the CRC trials and this implementation may be easily transferred to an outpatient setting, which will be the next phase of artificial β-cell development.
Acknowledgments
The authors acknowledge the industry collaborators from DexCom, Abbott Diabetes Care, and Insulet for their technical help in interfacing with their respective devices.
Abbreviations
- APS
artificial pancreas software
- BG
blood glucose
- CGM
continuous glucose monitor
- CRC
clinical research center
- CSII
continuous subcutaneous insulin infusion
- GUI
graphical user interface
- HMI
human–machine interface
- HPA
hypoglycemia prediction algorithm
- IrDA
infrared data association
- MPC
model predictive control
- PDM
personal diabetes manager
- PID
proportional-integrative-derivative
- PNP
plug-and-play
- RF
radio frequency
- RT
real time
- USB
universal serial bus
Funding
The authors acknowledge the Juvenile Diabetes Research Foundation (Grant #22-2006-1115 and #22-2006-1108) and the Otis Williams Fund at the Santa Barbara Foundation for their financial support.
References
- 1.Dudde R, Vering T, Piechotta G, Hintsche R. Computer-aided continuous drug infusion: setup and test of a mobile closed-loop system for the continuous automated infusion of insulin. IEEE Trans Inf Technol BioMed. 2006;10(2):395–402. doi: 10.1109/titb.2006.864477. [DOI] [PubMed] [Google Scholar]
- 2.Dassau E, Bequette BW, Buckingham BA, Doyle III FJ. Detection of a meal using continuous glucose monitoring: implications for an artificial β-cell. Diabetes Care. 2008;31(2):295–300. doi: 10.2337/dc07-1293. [DOI] [PubMed] [Google Scholar]
- 3.Lee H, Dassau E, Doyle III FJ, Buckingham BA, Bequette BW. Meal detection and magnitude estimation based on glucose monitoring. J Diabetes Sci Technol. 2008;2(2):A96. [Google Scholar]
- 4.Dassau E, Cameron FM, Lee H, Bequette BW, Doyle III FJ, Niemeyer G, Chase P, Buckingham B. Real-time hypoglycemia prediction using continuous glucose monitoring (CGM). Proceedings of the 68th American Diabetes Association Meeting; San Francisco CA, USA. A safety net to the artificial pancreas. Diabetes 57(Supl 1): A13. [Google Scholar]
- 5.Steil GM, Saad MF. Automated insulin delivery for type 1 diabetes. Curr Opin Endocrinol and Diabetes. 2006;13(2):205–211. [Google Scholar]
- 6.Parker RS, Doyle III JF, Harting JE, Peppas NA. Model predictive control for infusion pump insulin delivery. Proceedings of the 18th Annual International Conference of the IEEE Engineering in Medicine and Biology Society; 1996. pp. 1822–1823. [Google Scholar]
- 7.Hovorka R, Canonico V, Chassin LJ, Haueter U, Massi-Benedetti M, Federici MO, Pieber TR, Schaller HC, Schaupp L, Vering T, Wilinska ME. Nonlinear model predictive control of glucose concentration in subjects with type 1 diabetes. Physiol Meas. 2004;25(4):905–920. doi: 10.1088/0967-3334/25/4/010. [DOI] [PubMed] [Google Scholar]
- 8.Grant P. A new approach to diabetic control: fuzzy logic and insulin pump technology. Med Eng Phys. 2007;29(7):824–827. doi: 10.1016/j.medengphy.2006.08.014. [DOI] [PubMed] [Google Scholar]


