Abstract
Background
A major difficulty in the management of diabetes is the optimization of insulin therapies to avoid occurrences of hypoglycemia and hyperglycemia. Many factors impact glucose fluctuations in diabetes patients, such as insulin dosage, nutritional intake, daily activities and lifestyle (e.g., sleep-wake cycles and exercise), and emotional states (e.g., stress). The overall effect of these factors has not been fully quantified to determine the impact on subsequent glycemic trends. Recent advances in diabetes technology such as continuous glucose monitoring (CGM) provides significant sources of data, such that quantification may be possible. Depending on the CGM technology utilized, the sampling frequency ranges from 1–5 min. In this study, an intensive electronic diary documenting the factors previously described was created. This diary was utilized by 18 patients with insulin-dependent diabetes mellitus in conjunction with CGM. Utilizing this dataset, various neural network models were constructed to predict glucose in these diabetes patients while varying the predictive window from 50-180 min. The predictive capability of each neural network within the fully trained dataset was analyzed as well as the predictive capabilities of the neural networks on unseen data.
Methods
Neural network models were created using NeuroSolutions® software with variable predictive windows of 50, 75, 100, 120, 150, and 180 min. Neural network models were trained using patient datasets ranging from 11–17 patients and evaluated on patient data not included in the neural network formulation. Performance analysis was completed for the neural network models using MATLAB®. Performance measures include the calculation of the mean absolute difference percent overall and at hypoglycemic and hyperglycemic extremes, and the percentage of hypoglycemic and hyperglycemic occurrences were predicted.
Results
Overall, the neural network models perform adequately at predicting at normal (>70 and <180 mg/dl) and hyperglycemic ranges (≥180 mg/dl); however, glucose concentrations in areas of hypoglycemia were commonly overestimated. One potential reason for the “high” predictions in areas of hypoglycemia is due to the minimal occurrences of hypoglycemic events within the training data. The entire 18-patient dataset (consisting of 18,400 glucose values) had a relatively low incidence of hypoglycemia (1460 CGM values ≤70 mg/dl), which corresponds to approximately 7.9% of the dataset. On the contrary, hyperglycemia comprised approximately 35.7% of the dataset (6560 CGM values ≥180 mg/dl), and euglycemic values allotted for 56.4% of the dataset (10,380 CGM values >70 and <180 mg/dl). Results further indicate that an increase in predictive window leads to a decrease in predictive accuracy of the neural network model. It is hypothesized that the underestimation of hyperglycemic extremes is due to the extension of the predictive window and the associated inability of the neural network to determine oscillations and trends in glycemia as well as the occurrence of other relevant input events such as lifestyle, emotional states, insulin dosages, and meals, which may occur within the predicted time window and may impact or change neural network weights.
Conclusions
In this investigation, the feasibility of utilizing neural network models for the prediction of glucose using predictive windows ranging from 50–180 min is demonstrated. The predictive windows were chosen arbitrarily to cover a wide range; however, longer predictive windows were implemented to gain a predictive view of 120–180 min, which is very important for diabetes patients, specifically after meals and insulin dosages. Neural networks, such as those generated in this investigation, could be utilized in a semiclosed-loop device for guiding therapy in diabetes patients. Use of such a device may lead to better glycemic control and subsequent avoidance of complications.
Keywords: neural network, diabetes, glycemic predictions, CGM
Introduction
Type 1 diabetes is an autoimmune disease in which the beta-cells of the body are destroyed, thus resulting in a lack of insulin production. This leads to an inability to control blood glucose concentration as insulin facilitates the cellular uptake of glucose. If levels of blood glucose concentration remain high for extended periods of time, long-term complications such as neuropathy, nephropathy, and vision loss can arise.1–3 Due to the lack of insulin production, type 1 diabetes patients are required to take insulin subcutaneously as their primary method of therapy.
The major difficulty involving the successful treatment of diabetes is the appropriate dosing of insulin, such that a normal physiologic glucose concentration is maintained. There are a multitude of factors that influence subsequent glucose concentrations in diabetes patients, including, but not limited to, insulin dosage, carbohydrate and nutritional intake, lifestyle (e.g., sleep-wake cycles and sleep quality, and exercise), and emotional states (e.g., stress, depression, and contentment).4–14 The effect of these various factors on subsequent glucose levels is not fully understood and may be patient specific or similar across all diabetes patients. In order to optimize control in diabetes patients, there needs to be some method for quantifying or predicting future occurrences of dysglycemia (i.e., high and low blood glucose concentration, also referred to as hyperglycemia and hypoglycemia, respectively).
Scientific Background
Fluctuations in glucose concentration experienced on an everyday basis appear to be chaotic; however, prior research does elude to possible patterns that may exist.14–20 Circadian rhythms in sleep and subsequent glucose regulation have been identified in previous research.14 Other patterns in insulin activity, insulin sensitivity, and their subsequent effect on glucose concentration have been identified in previous research.15–20 The existence of rhythms in insulin activity, and subsequent quantifiable patterns in glucose fluctuations, provide a foundation and hypothetical construct for the development of the neural network models developed in this investigation. The advent of continuous glucose monitoring (CGM) in the field of diabetes technology provides even more insight for the determination of patterns existent in daily glucose fluctuations of diabetes patients. The use of CGM technology is also advantageous, as it leads to a better understanding of gluco-regulatory dynamics.
Physiological systems and diseases, such as diabetes mellitus, that affect such systems are extremely complex in nature. Attempts to analyze and better understand these types of “systems” have utilized methods such as control engineering. Based on these methods, there have been many attempts aimed at prediction, simulation, and fault detection. Although these methods, in part, provide insight into biological systems, they are still limited due to the inherent complexity of the systems they are attempting to model. An artificial neural network (ANN) is one approach that is gaining considerable interest. In part, this is due to its inherent nature, which would seem to be well suited to model complex physiological systems. An ANN functions as a brain within a nervous system in that it has the ability to distinguish and recognize a particular object from a large set of objects. Neural networks can be utilized to construct a mathematical model of a specific system that is to be controlled. Attempts to model blood glucose and insulin interactions in individuals with diabetes have been an ongoing topic in current research. The complexity of the neural networks developed in such studies range from simplistic feed-forward neural networks to more complex recurrent networks. In most of these studies, in an attempt to achieve tight glucose control in the normal physiological range, a controller is used to determine the required insulin dosage (based on glucose prediction).21–28 The determination of optimal insulin dosages is likely to have considerable error associated with each model, as each patient possesses different insulin sensitivities.
In many of the previous endeavors aimed at predicting glucose or optimal insulin dosages to maintain normal glucose concentration, models were generated using inputs, including glucose meter readings, insulin dosages, exercise and activity status, and nutritional intake. While these factors undoubtedly contribute to changes in blood glucose concentration and are quantifiable, there are many factors left unrecognized in previous models, particularly other lifestyle and emotional factors. In terms of the development of neural network models and neural network-based algorithms, the incorporation of more inputs that could affect such a system may result in enhanced predictive abilities. The neural network models explained in this paper incorporate inputs that have been deemed as effectors of glucose concentration but have not been incorporated into many models to date. The prediction of glucose concentration via such an approach may allow patients to change their insulin dosages in response to predicted occurrences of hypoglycemia or hyperglycemia. Given predictive success, this will likely enhance each patient's abilities to optimize insulin therapy and maintain a normal glucose concentration.
Methods
Construction of Initial Neural Network Models
Generation of Electronic Diary for Initial Data Collection
The initial step in the development of the neural network algorithm was data acquisition. A Pocket PC-based electronic diary documenting the patient's meter blood glucose readings, insulin dosages, carbohydrate intake, hyperglycemic and hypoglycemic symptoms, lifestyle (activities and events), and emotional states was created using Visual C#.NET. Emotional and lifestyle states were quantified in the electronic diary using Boolean indicators. The graphical user interface (GUI) of the developed software is illustrated in Figure 1. The Pocket PC-based electronic diary was configured to output a file containing all data logged from the intensive electronic diary, which is used for subsequent integration with CGM data and neural network training and formulation. CGM data and electronic diary data were integrated manually. The electronic diary was programmed to automatically update the date and time of each entry to facilitate real-time data acquisition and mitigate erroneous input.
Figure 1.
Graphical user interface of electronic diary for initial data acquisition.
Patient Training and Data Collection Process
The patient population used for the initial neural network algorithm and model development was obtained from a private endocrine practice in Warren, OH. The only necessary attribute for incorporation into the study was that the patients must have insulin-dependent diabetes mellitus. Using the developed electronic diary, 18 patients were subjected to use of the diary in combination with a Medtronic CGM System (CGMS). Patients used CGM for a duration between 3 and 9 days. The electrochemical sensor for the device was changed every 3 days in accordance with manufacturer and FDA recommendations for sensor life and stability period. Patients were instructed on the calibration of the CGM unit as well as trained in the use of the electronic diary before their involvement in the study. It is also important to note that data logged via the use of the electronic diary may have been entered incorrectly by patients involved in the study; however, it was difficult to identify such instances if they occurred. To mitigate errors of this type, patients were instructed and trained on the methods to record data using the electronic diary prior to their involvement in the study.
Neural Network Model Development and Design
Neural network models were generated using NeuroSolution® software (Neurodimension, Gainesville, FL). These neural networks were configured to forecast future glycemic levels within a certain predefined time frame or predictive window. Models were developed with predictive windows ranging from 50–180 min. The predictive windows were chosen arbitrarily to cover a wide range; however, longer predictive windows were implemented to gain a predictive view of 120–180 min, which is very important for diabetes patients, specifically after meals and insulin dosages. Each glucose value obtained from the Medtronic CGMS was collected every 5 min; therefore, for a 50 min predictive window, the neural network was configured to predict 10 CGM values.
The neural networks developed in this investigation were time-lagged feed-forward neural networks. These neural networks are classified as multilayer perceptrons that have memory components to store previous values of data within the network. The existence of such memory components provides the system the ability to learn relationships and patterns existent in the data over time. These neural networks consist of multiple layers of processing elements that are connected together in a feed-forward manner. Various connections (synapses) were constructed to facilitate connections between the processing elements of the neural network (axons).
The neural networks generated were trained using a method known as the back propagation of errors. Elements in the neural network known as back propagation axons (BackAxons) facilitate the training process. BackAxons derive a relative error at their input, which is to be back propagated to any processing elements preceding them in the neural network design. The back propagation of errors is completed as an error is presented at the output of each BackAxon in the neural network, and the BackAxon is charged with calculating the gradient information associated with calculating weights for the minimization of total error in the neural network. Optimal weights for the minimization of error in the predictive model are obtained via a gradient descent algorithm performed within the BackAxon elements. This gradient descent algorithm calculates the optimal weight for the minimization of the total error in the neural network model. The optimization value of the step size in such an algorithm is integral in the amount of time it takes to train the neural network. A small step size could lead to a large training time, and conversely, a large step size could lead to overestimation of the desired local minimum. Neural networks were trained via batch training, i.e., network weights were updated after each epoch (single cycle or pass through the dataset). The neural networks were configured to stop training after 1000 epochs or if the mean squared error was less than 0.1.
Models such as the neural network models developed in this investigation included optimization via use of genetic algorithms, which are useful computer-aided design techniques.29–31 Optimization via a genetic algorithm was used to minimize the number of processing elements (neurons) and inputs into the neural network. The genetic algorithm effectively determines which inputs have an impact on predictions and minimizes the various interconnections between neurons in the neural network. The genetic algorithm also determines the best value for the step size and momentum for the neural network.
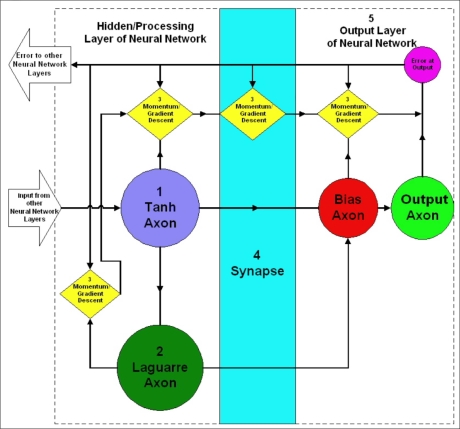
Figure 2 includes the neural network design and architecture of one of the processing and output layers of the neural network models designed using the NeuroSolutions software. The various components in the neural network design are labeled 1–5. Component 1 is a hyperbolic tangent axon (tanh axon). The tanh axon has the processing elements for the hidden layer of the neural network. Each processing element sums the weighted connections from the inputs into the axon. Component 2 is a Laguarre axon that functions to store delayed versions of the processing elements output and pass it onto the next layer of the neural network. The Laguarre axon therefore serves to provide the neural network with memory, thus enabling the processing of information in time. Component 3 is the momentum/gradient descent component of the network. This component serves to adjust the weights with information about the error within the network. Optimal step sizes and momentum values in these elements for the minimization of error are determined via the implementation of a genetic algorithm, as previously discussed. Component 4 is an example of the synapses of the neural network, which serve to connect the various axons and processing elements of the neural network. Component 5 is the output layer of the neural network, which consists of a bias axon (leftmost element in Component 5) and an output axon (rightmost element in Component 5). The bias axon has the processing elements for the output layer, each of which sums the weighted connections from the second hidden layer. The output axon yields the predicted values in the original format (i.e., the desired response) as originally presented to the neural network.
Figure 2.
Design and architecture of the processing (hidden) and output layer of the neural network model.
Validation of Generated Neural Network Models
Three methods were implemented to analyze the accuracy of the developed neural network's predictive abilities. The first method involved the validation of neural network models generated with variable length training sets. In this analysis, training sets using 11–17 patients were used to generate neural network models with a constant predictive window of 100 min. The performance of each neural network model was evaluated using the CGM and electronic diary data from a patient who was not included in the training data of any of the neural network models. MATLAB® was used for performance analysis of the neural network model. The mean absolute difference percent (MAD%) of the model's predictive abilities on the entire test dataset (overall MAD%), hypoglycemic extremes (≤70 mg/dl) and hyperglycemic extremes (≥180 mg/dl), was calculated using
| (1) |
| (2) |
where AD% (t) is the calculated AD% at time t, NNetpredict(t) is the predicted neural network glucose value at time t, and CGMactual(t) is the actual CGM data point at time t. N is the number of data points in the dataset, used for calculating the MAD%. Equation (1) is utilized for calculating the absolute difference percent (AD%) between each neural network-predicted value and the corresponding actual CGM value. Equation (2) is used to calculate the MAD%, which is defined as the mean of all obtained AD% values in the dataset. The percentage of hyperglycemia and hypoglycemia predicted by the system was also calculated.
A second method of performance analysis involved the validation of the multiple neural network models generated using 12–17-patient datasets. The final patient included in each dataset (i.e., the last 3–3.5 days of each dataset) was omitted from the training data and utilized to validate the accuracy and predictive abilities of the neural network on unseen patient data. This analysis mimics the real-time functionality of such models on multiple unseen patients, as the data used to test model performance is from a different patient each time. MATLAB was utilized for performance analysis and used to calculate the previously described performance measures.
The final method of performance analysis was the validation of the various neural network models with variable predictive windows ranging from 50–180 min, trained with a 17-patient dataset. Each neural network model was tested using data acquired from an 18th patient who was not included in the initial training data. The respective model's predictive abilities were analyzed using MATLAB.
Results and Discussion
Prediction of a Single Unseen Patient Data Record Using 11–17-Patient Artificial Neural Network Models
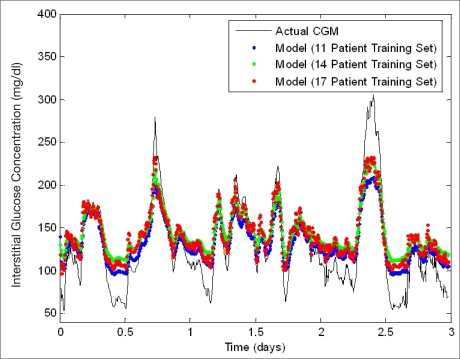
Figure 3 is a plot containing neural network predictions using a 100 min predictive window on a single patient whose data was not included in the training data during initial model development. This plot illustrates the effect of varying the number of patients (11, 14, and 17) utilized for training the initial neural network model. Figure 3 demonstrates that as the number of patients used in training is increased, the sensitivity of the neural network predictions at hyperglycemic extremes generally increased. Training sets of fewer patients (i.e., less data) appear to underestimate hyperglycemia to a greater extent, which leads to some hyperglycemic reactions not being predicted. Table 1 includes the performance analysis results while varying the number of patients included in the initial training set in neural network development from 11–17 patients. There was a total of 128 hyperglycemic reactions and 94 hypoglycemic reactions in the unseen patient data that was used to validate model performance. The overall MAD% appears to be relatively consistent throughout, regardless of training set size ranging from 18.7 to 25.8% with an average of 22.7%. Generally, as the quantity of training data is increased, neural network performance increases; however, this was not observed. A possible reason for the slight variability in overall MAD% is that the patients added to training set had different electronic diary data documenting similar lifestyle and emotional factors, which did not lead to the same glycemic trends as the patient chosen for analysis. Furthermore, the patient data used to validate these neural network models had a significant number of hypoglycemic reactions (as demonstrated in Figure 3). The neural networks generated with lower quantities of training data underestimate hyperglycemic extremes and are thus more accurate at the estimation of lower glucose extremes, thus leading to a smaller MAD% overall. This is realized as the MAD% at hypoglycemic extremes is greater when the neural network model overall MAD% does not follow the expected trend. As the amount of training data is increased, the percentage of hyperglycemic reactions predicted successfully by the neural network model increases from 49.2 to 69.5% for 11 and 17 patients, respectively. In addition, there is a corresponding decrease in MAD% at hyperglycemic extremes from 17.4 to 11.7% for 11 and 17 patients, respectively. Overall, the models commonly overestimate hypoglycemic values. The model generated using the 16-patient training set predicted only 1.1% of hypoglycemic values, whereas the other models did not predict any hypoglycemic values.
Figure 3.
Neural network prediction of unseen data: variation of training set length. An error of 11–21% exists in the Medtronic CGMS relative to serum glucose levels.32
Table 1.
Performance Analysis on Unseen Data: Variation of Training Set Length (100 min Predictive Window)
| Number of patients | Overall MAD(%) | MAD(%) hyper | MAD(%) hypo | Hyper predicted (%) | Hypo predicted (%) |
|---|---|---|---|---|---|
| 11 | 18.7 | 17.4 | 44.0 | 49.2 | 0 |
| 12 | 21.5 | 14.0 | 55.4 | 56.3 | 0 |
| 13 | 23.1 | 13.7 | 57.4 | 58.6 | 0 |
| 14 | 25.8 | 12.4 | 61.6 | 67.2 | 0 |
| 15 | 25.1 | 11.5 | 58.7 | 68.0 | 0 |
| 16 | 22.1 | 11.2 | 54.1 | 70.3 | 1.1 |
| 17 | 22.5 | 11.7 | 51.9 | 69.5 | 0 |
Prediction of Multiple Unseen Patient Data Records Using 11–17-Patient Artificial Neural Network Models
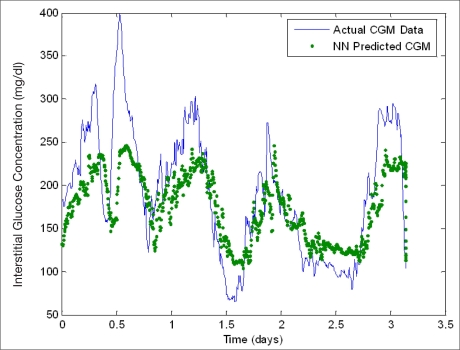
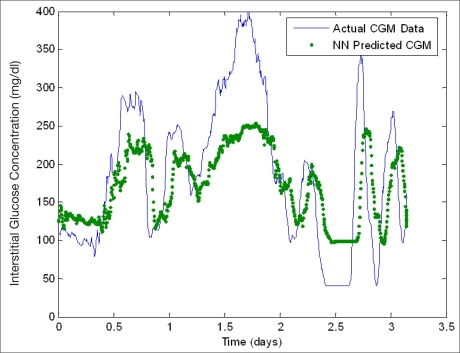
Figures 4 and 5 show neural network model predictions made on two different patient datasets, while the number of patients, 15 and 16, respectively, were used for training the developed neural network model. Both neural network models perform well at following trends in data as well as predicting a fairly significant percentage of hyperglycemic reactions. In Figure 5, the patient utilized for validation experiences extended hyperglycemic and hypoglycemic reactions, which occur at the maximum recorded value for the glucose sensor at 400 and 40 mg/dl, respectively. In each respective case, the neural network predictions underestimated and overestimated the glycemic extremes, which leads to a significant impact on overall MAD% as well as the MAD% at hyperglycemic and hypoglycemic extremes (i.e., 39.9, 24.1, and 30%, respectively, compared with 22.6, 19, and 3% for the 15-patient model—see Table 2). Error calculations are therefore very subjective to trends in the dataset used for validation. Table 2 summarizes the performance analysis and an assessment of neural network predictive abilities in predicting glucose values in multiple unseen patients while varying the length of the training data utilized during the initial model formulation. Because each patient is different, the number of hyperglycemic and hypoglycemic reactions in each dataset varies. In each case, the quantity of training data is increased, and the model is validated on a single patient dataset that was not used in the initial model formulation. As the quantity of training data is increased, the performance of the neural network model increases, and overall MAD% decreases with the exception of the final neural network model developed using the 16-patient training set for the reasons previously described. In addition to these reasons, it is also important to note that this patient exhibited the second highest number of hypoglycemic reactions of the unseen patient data that was tested. The respective models predict a significant percentage of hyperglycemic reactions ranging from 52.8–92.6%; however, they commonly overestimate hypoglycemic values. This correlates to the poor performance in the successful prediction of hypoglycemic extremes, and likely correlates to the decreased model accuracy in the model with the 16-patient training set.
Figure 4.
Neural network predictive abilities (generated using a 15-patient training set) (unseen data). An error of 11–21% exists in the Medtronic CGMS relative to serum glucose levels.32
Figure 5.
Neural network predictive abilities (generated using a 16-patient training set) (unseen data). An error of 11-21% exists in the Medtronic CGMS relative to serum glucose levels.32
Table 2.
Performance Analysis: Multiple Unseen Patients with Increasing Training Set (100 min Predictive Window)
| Patients in training set | Overall MAD(%) | MAD(%) hyper | MAD(%) hypo | # of hyper reactions in dataset | # of hypo reactions in dataset | Hyper predicted (%) | Hypo predicted (%) |
|---|---|---|---|---|---|---|---|
| 11 | 43.0 | 30.6 | 15.8 | 431 | 55 | 57.1 | 0 |
| 12 | 46.3 | 29.4 | 46.2 | 303 | 157 | 52.8 | 0 |
| 13 | 28.4 | 22.3 | 6.7 | 784 | 61 | 92.6 | 0 |
| 14 | 20.0 | 19.6 | 0 | 750 | 0 | 86.5 | N/A |
| 15 | 22.6 | 19.0 | 3.0 | 504 | 20 | 72.4 | 0 |
| 16 | 39.9 | 24.1 | 30.0 | 475 | 94 | 67.8 | 0 |
Prediction of a Single Unseen Patient Data Record Using a 17-Patient Artificial Neural Network Model with Different Predictive Windows
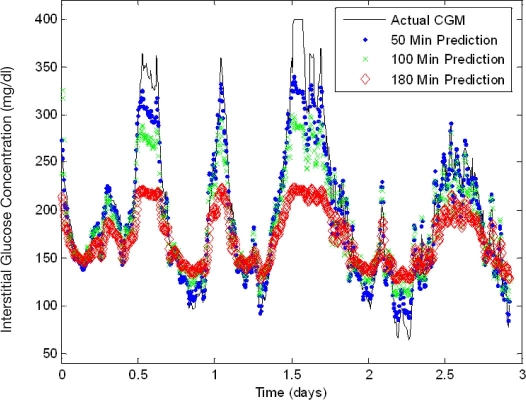
Figure 6 shows neural network models developed using a 17-patient training set and their predictions on a single unseen patient data record with variable predictive windows of 50, 100, and 180 min. As the predictive window is increased, the accuracy in each model decreases, respectively. It is hypothesized that the underestimation of hyperglycemic extremes is due to the extension of the predictive window and the associated inability of the neural network to determine oscillations and trends in glycemia as well as the occurrence of other relevant input events such as lifestyle, emotional states, insulin dosages, and meals that may occur within the predicted time window and may impact or change neural network weights. Table 3 includes the performance analysis for the models generated with the 17-patient training set and variable predictive windows. This dataset included 429 hyperglycemic reactions and 8 hypoglycemic reactions. A consistent increase in overall MAD% (6.7–18.9%) is observed with an increase in the predictive window. Similarly, the MAD% at hyperglycemic and hypoglycemic extremes increases from 6.6–22.1% and 0.6–1.7%, respectively. A majority of the hyperglycemic reactions in this dataset are predicted with 71.6–97.2% of hyperglycemic reactions being predicted by the models. Conversely, for reasons previously mentioned, hypoglycemic reactions are overestimated, resulting in no hypoglycemic extremes being predicted successfully.
Figure 6.
Neural network performance: predictive window variation (unseen data). An error of 11–21% exists in the Medtronic CGMS relative to serum glucose levels.32
Table 3.
Performance Analysis: Unseen Data with Predictive Window Variation
| Predictive window (min) | Overall MAD(%) | MAD(%) hyper | MAD(%) hypo | Hyper predicted (%) | Hypo predicted (%) |
|---|---|---|---|---|---|
| 50 | 6.7 | 6.6 | 0.6 | 95.3 | 0.00 |
| 75 | 8.9 | 8.0 | 0.9 | 94.9 | 0.00 |
| 100 | 11.7 | 11.0 | 1.3 | 90.4 | 0.00 |
| 120 | 14.5 | 12.0 | 1.5 | 97.2 | 0.00 |
| 150 | 16.6 | 19.6 | 1.5 | 79.0 | 0.00 |
| 180 | 18.9 | 22.1 | 1.7 | 71.6 | 0.00 |
General Discussion
The results derived from this investigation indicate that the prediction of glycemic fluctuations in type 1 diabetes patients is possible. As anticipated, the neural network performance degrades as the predictive window increases. In all model formulations, the neural network appears to follow trends in the data accurately; however, the model has the tendency to underestimate extreme hyperglycemic values and overestimate hypoglycemic values. This limitation is more apparent at hypoglycemic values, as the model rarely predicts hypoglycemia. One plausible reason for this limitation is that the training dataset did not have a significant number of hypoglycemic data relative to the number of euglycemic (normal) and hyperglycemic data points. The CGM dataset used for the training of the neural network models had a relatively low incidence of hypoglycemia (1460 CGM values ≤70 mg/dl), which corresponds to approximately 7.9% of the dataset. On the contrary, hyperglycemia comprised approximately 35.7% of the dataset (6560 CGM values ≥180 mg/dl), and euglycemic (normal) values allotted for 56.4% of the dataset (10,380 CGM values >70 and <180 mg/dl). This inadequacy in the training data could lead to a degradation in neural network performance for predictions at hypoglycemic extremes. Further development of a neural network with a larger quantity of hypoglycemic reactions is warranted. In addition, a rate-of-change-based analysis of CGM data may also prove advantageous. Such an analysis could lead to a determination of a glycemic-threshold-based method for the determination of correction factors to apply to predicted CGM data leading to hypoglycemia or hyperglycemia.
The neural network models created in this investigation could be improved by various subsequent studies. Neural network models can be generated on a patient-specific basis, using large training sets from a single patient. Such an analysis could identify whether factors documented in this investigation using the intensive electronic diary would affect glycemia on a universal or patient-specific basis. Additionally, other neural network predictive models should be investigated such as predictive classification neural networks for the prediction of low, high, and normal glucose states.
Conclusion
The use of CGM and an intensive electronic diary documenting meter blood glucose readings, insulin dosages, carbohydrate intake, hypoglycemic and hypo-glycemic symptoms, lifestyle (activities and events), and emotional states to generate a neural network model for the prediction of glucose was demonstrated in this investigation. Further research into generating a more elaborate neural network model is, however, warranted to improve predictions at both hyper- and hypoglycemic extremes. Additional studies on the documentation and use of other factors, such as lifestyle and medication logging, may also be warranted, including a detailed study on how such factors can impact glycemic predictions and overall model performance. If the prediction of glucose via such a methodology with considerable accuracy is indeed possible, the generation of a real-time “intelligent-therapy” semiclosed-loop system may be possible. Such a system, capable of predicting future glycemic states, would likely be advantageous and allow for the real-time optimization of insulin therapy based on expected occurrences of hypoglycemia and hyperglycemia.
Abbreviations
- AD%
absolute difference percent
- ANN
artificial neural network
- CGM
continuous glucose monitoring
- CGMS
continuous clucose monitoring system
- GUI
graphical user interface
- MAD%
mean absolute difference percent
Funding
This work was supported by the Ohio Department of Development.
References
- 1.DCCT Group. Retinopathy and nephropathy in patients with type 1 diabetes four years after a trial of intensive therapy. N Engl J Med. 2000;342(6):381–389. doi: 10.1056/NEJM200002103420603. [DOI] [PMC free article] [PubMed] [Google Scholar]
- 2.DCCT Group. Sustained effect on intensive treatment of type 1 diabetes mellitus on development and progression of diabetic nephropathy. JAMA. 2003;290(16):2159–2167. doi: 10.1001/jama.290.16.2159. [DOI] [PMC free article] [PubMed] [Google Scholar]
- 3.DCCT Group. Intensive diabetes treatment and cardiovascular disease in patients with type 1 diabetes. N Engl J Med. 2005;353(25):2643–2653. doi: 10.1056/NEJMoa052187. [DOI] [PMC free article] [PubMed] [Google Scholar]
- 4.Chipkin SR, Klugh S, Chasan-Tabere L. Exercise and diabetes. Cardiol Clin. 2000;19(3):489–505. doi: 10.1016/s0733-8651(05)70231-9. [DOI] [PubMed] [Google Scholar]
- 5.Cox DJ, Gonder-Frederick L, Kovatchev BP, Clarke WL. The metabolic demands of driving for drivers with type 1 diabetes mellitus. Diabetes Metab Res Rev. 2002;18(5):381–385. doi: 10.1002/dmrr.306. [DOI] [PubMed] [Google Scholar]
- 6.Dutour A, Boiteau V, Dadoun F, Feissel A, Atlan C, Oliver C. Hormonal response to stress in brittle diabetes. Psychoneuroendocrinology. 1996;21(6):525–543. doi: 10.1016/s0306-4530(96)00014-5. [DOI] [PubMed] [Google Scholar]
- 7.Ficker J, Dertinger S, Siegfried W, Konig H, Pentz M, Sailer D, Katalinic A, Hahn EG. Obstructive sleep apnea and diabetes mellitus: the role of cardiovascular autonomic neuropathy. Eur Respir J. 1998;11(1):14–19. doi: 10.1183/09031936.98.11010014. [DOI] [PubMed] [Google Scholar]
- 8.Hargreaves M, Angus D, Howlett K, Conus NM, Febbraio M. Effect of heat stress on glucose kinetics during exercise. J Appl Physiol. 1996;81(4):1594–1597. doi: 10.1152/jappl.1996.81.4.1594. [DOI] [PubMed] [Google Scholar]
- 9.Jones TW, Porter P, Sherwin RS, Davis EA, O'Leary P, Frazer F, Byrne G, Stick S, Tamborlane WV. Decreased epinephrine responses to hypoglycemia during sleep. N Engl J Med. 1998;338(23):1657–1662. doi: 10.1056/NEJM199806043382303. [DOI] [PubMed] [Google Scholar]
- 10.Nomura M, Fujimoto K, Higashino A, Denzumi M, Miyagawa M, Miyajima H, Nada T, Kondo Y, Tada Y, Kawaguchi R, Morishita T, Saito K, Ito S, Nakaya Y. Stress and coping behavior in patients with diabetes mellitus. Acta Diabetologica. 2000;37(2):61–64. doi: 10.1007/s005920070020. [DOI] [PubMed] [Google Scholar]
- 11.Pappada SM, Rosman PM. Life event detection and their impact on glycemic oscillations in DM1 patients using CGMS data with computer assisted pattern recognition (CAPR) and mathematical modeling to enhance glycemic predictability. Diabetes. 2004;53(2):A488. [Google Scholar]
- 12.Resnick HE, Redline S, Shahar E, Gilpin A, Newman A, Walter R, Ewy GA, Howard BV, Punjabi NM. Diabetes and sleep disturbances: findings from the sleep heart health study. Diabetes Care. 2003;26(3):702–709. doi: 10.2337/diacare.26.3.702. [DOI] [PubMed] [Google Scholar]
- 13.Trief PM, Aquilino C, Paradies K, Weinstock RS. Impact of the work environment on glycemic control and adaptation to diabetes. Diabetes Care. 1999;22(4):569–574. doi: 10.2337/diacare.22.4.569. [DOI] [PubMed] [Google Scholar]
- 14.Van Cauter E, Polonsky K, Scheen A. Roles of circadian rhythmicity and sleep in human glucose regulation. Endocr Rev. 1997;18(5):716–738. doi: 10.1210/edrv.18.5.0317. [DOI] [PubMed] [Google Scholar]
- 15.Jarrett R. Rhythms in insulin and glucose. In: Krieger D, editor. Endocrine Rhythms. Vol. 1. New York: Raven Press; 1979. pp. 247–258. [Google Scholar]
- 16.Simon C, Brandenberger G, Follenius M. Ultradian oscillations of plasma glucose, insulin, and C-peptide in man during continuous enteral nutrition. J Clin Endocrinol Metab. 1987;64(4):669–674. doi: 10.1210/jcem-64-4-669. [DOI] [PubMed] [Google Scholar]
- 17.Simon C, Brandenberger G, Saini J, Ehrhart J, Follenius M. Slow oscillations of plasma glucose and insulin secretion rate are amplified during sleep in humans under continuous enteral nutrition. Sleep. 1994;17(4):333–338. doi: 10.1093/sleep/17.4.333. [DOI] [PubMed] [Google Scholar]
- 18.Tato F, Tato S, Beyer J, Schrezenmeir J. Circadian variation of basal and postprandial insulin sensitivity in healthy individuals and patients with type-1 diabetes. Diabetes Res Clin Pract. 1991;17(1):13–24. [PubMed] [Google Scholar]
- 19.Trumper B, Reschke K, Molling J. Circadian variation of insulin requirement in insulin dependent diabetes mellitus: the relationship between circadian change in insulin demand and diurnal patterns of growth hormone, cortisol, and glucagon during euglycemia. Horm Metab Res. 1995;27(3):141–147. doi: 10.1055/s-2007-979926. [DOI] [PubMed] [Google Scholar]
- 20.Van Cauter E, Shapiro E, Tillil H, Polonsky K. Circadian modulation of glucose and insulin responses to meals: relationship to cortisol rhythm. Am J Phys. 1992;262:E467–E475. doi: 10.1152/ajpendo.1992.262.4.E467. [DOI] [PubMed] [Google Scholar]
- 21.Gogou G, Maglaveras N, Ambrosiadou BV, Goulis D, Pappas C. A neural network approach in diabetes management by insulin administration. J Med Syst. 2001;25(2):119–131. doi: 10.1023/a:1005672631019. [DOI] [PubMed] [Google Scholar]
- 22.Karim EJ. Neural network control of type I diabetes mellitus. Bioprocess Biosyst Eng. 2005;27(2):71–76. doi: 10.1007/s00449-004-0363-3. [DOI] [PubMed] [Google Scholar]
- 23.Pender JE. Modelling of blood glucose levels using artificial neural networks. Dissertation. Glasgow, Scotland: University of Strathclyde; 1997. [Google Scholar]
- 24.Prank K, Clemens J, Muhlen A, Brabant G. Predictive neural networks for learning the time course of blood glucose levels. Neural Comput. 1998;10(4):941–953. doi: 10.1162/089976698300017566. [DOI] [PubMed] [Google Scholar]
- 25.Sandham WA, Hamilton DJ, Japp A, Patterson K. Neural network and neuro-fuzzy systems for improving diabetes therapy. Conf Proc IEEE Eng Med Biol Soc. 1998;20(3/6):1438–1441. [Google Scholar]
- 26.Sandham WA, Nikoletou D, Hamilton DJ, Patterson K, Japp A, Macgregor C. Blood glucose prediction for diabetes therapy using a recurrent artificial neural network. Conf Proc EUSIPCO. 1998;(11):673–676. [Google Scholar]
- 27.Schlotthauer G, Gamero LG, Torres M, Nicolini G. Modeling, identification and nonlinear model predictive control of type I diabetic patient. Medical Engineering and Physics. 2006;28(3):240–250. doi: 10.1016/j.medengphy.2005.04.009. [DOI] [PubMed] [Google Scholar]
- 28.Briegel T, Tresp V. A nonlinear state space model for the blood glucose metabolism of a diabetic. AT. 2002;50(5):228–236. doi: 10.1109/72.788659. [DOI] [PubMed] [Google Scholar]
- 29.Renner G, Ainko E. Genetic algorithms in computer aided design. Comput Aided Des. 2003;35(8):709–726. [Google Scholar]
- 30.McShane MJ, Cameron BD, Cote GL, Spiegelman CH. Improving complex near-IR calibrations using a new wavelength selection algorithm. Appl Spectrosc. 1999;53(12):1575–1581. [Google Scholar]
- 31.McShane MJ, Cameron BD, Cote GL, Motamedi M, Spiegelman CH. A novel peak-hopping stepwise feature selection method with application to Raman spectroscopy. Anal Chem Acta. 1999;388(3):251–264. [Google Scholar]
- 32.Klonoff D. Continuous glucose monitoring: roadmap for the 21st century. Diabetes Care. 2005;28(5):1231–1239. doi: 10.2337/diacare.28.5.1231. [DOI] [PubMed] [Google Scholar]


