Abstract
Background
Implementing tight glycemic control (TGC) in intensive care unit (ICU) patients requires accurate blood glucose (BG) monitoring. We evaluated the performance of two commercially available bedside glucometers, Accu-Chek® and HemoCue®, in patients admitted to the ICU and in whom TGC was applied.
Methods
Thirty-seven adult ICU patients were prospectively included. During 48 hours, BG was determined simultaneously on the same arterial blood sample using the two point-of-care testing (POCT) glucometers as compared with the standard technique. Data of 452 paired measurements were analyzed using linear regression, Clark error grid analysis (EGA), the method of Bland–Altman, and the GLYCENSIT procedure.
Results
Both tested glucometers showed satisfactory results when evaluated with linear regression and EGA. Correlation coefficients were above 0.9, and 100% of all the glucose readings were within the safe zones A and B using EGA. However, when applying more appropriate tests, both sensors failed to provide sufficient accuracy in the setting of TGC in ICU patients. The Hemocue revealed a bias of >10 mg/dl with a trend to systematically overestimate the actual BG value. The bias for the Accu-Chek was 6 mg/dl with wide limits of agreement and a variable over- and underestimation of the actual BG value depending on the level of BG (hypo-, normo-, or hyperglycemia).
Conclusions
When TGC is implemented in ICU practice, caution is warranted when adjusting insulin rates based only on BG readings obtained by the tested glucometers. ICU practitioners should weigh the advantages and disadvantages of such devices: a greater bias but with a more predictable error and measurement behavior versus a somewhat lower bias but with an unpredictable direction of the difference.
Keywords: glucometer, ICU, POCT, tight glycemic control
Introduction
Tight glycemic control (TGC) with intensive insulin therapy has been shown to save lives and to reduce morbidity in intensive care patients.1–3 To implement TGC (target range: 80 and 110 mg/dl) and to avoid hypoglycemia, frequent sampling to control blood glucose (BG) is mandatory. Glucose determination in plasma in remote central laboratory facilities of the hospital, often referred to as the gold standard, is impractical, inefficient, and unsafe to implement TGC due to the inevitable time delay between sampling and availability of the blood glucose result to the clinical staff. Therefore, most intensive care units (ICU) rely on point of care testing (POCT) for several laboratory values in the ICU to closely monitor their patients. For example, arterial blood gasses, hemoglobin, lactate, glucose, and potassium are frequently determined on locally available blood gas analyzers and other POCT devices. For blood glucose determination in our setting, this method has been validated against the gold standard and daily quality checks are performed by the central laboratory services. Coefficients of variation are 2.6% at a blood glucose of 41.6 mg/dl and 241 mg/dl and 2.8% for a glucose of 99.3 mg/dl.
We performed a prospective clinical trial in patients admitted to the ICU and in whom TGC was applied to evaluate the performance of two commercially available POCT glucometers against our standard BG measurements using the ABL 700® series blood gas analyzer (Radiometer, Denmark).
Research Design and Methods
Study Protocol
The study was approved by the institutional ethical review board. Thirty-seven adult patients admitted to the ICU of a university hospital were prospectively enrolled after informed consent was obtained from the next of kin. Nurses were instructed to maintain BG between 80 and 110 mg/dl using our hospital guidelines for tight glycemic control in the ICU.1 Initially, an arterial blood sample was withdrawn hourly via an indwelling arterial line and BG was determined simultaneously on this sample using three different POCT devices. When the BG was stable and in the desired range, the sampling interval was increased to 4 hours or earlier if clinically indicated. In total we analyzed 452 paired samples of 37 patients.
Each sample was analyzed immediately and simultaneously with the three different methods. The ABL 700 series blood gas analyzer analyzes BG in whole blood using the glucose dehydrogenase method with a sensor based on amperometry. The result is calibrated automatically to plasma glucose. This POCT is used as the reference technique in our ICU and for this study. Maintenance, calibration, and quality control are performed on a daily basis by the central hospital laboratory. The Accu-Chek Inform® (Roche Diagnostics, Switzerland) measures BG in whole blood using the glucose dehydrogenase method with sensor technology based on amperometry. Finally, the HemoCue® Glucose 201 (HemoCue, UK) measures BG in whole blood after hemolysis of erythrocytes using a glucose dehydrogenase method with sensor technology based on spectrophotometry. Both Accu-Chek and HemoCue analyze BG in whole blood and report values recalibrated to plasma glucose (formula: plasma glucose = whole blood glucose × 1.11). The three devices use the glucose dehydrogenase enzymatic chemical reaction, preventing dependency of PaO2 and thus making it attractive in the ICU setting. To account for possible interference of pH, PaO2, or hematocrit, each sample was analyzed immediately and simultaneously with the three methods; thereby preventing variations in these critical care variables from causing erroneous measurements.4 Furthermore, using the same arterial sample for the triple simultaneous analysis of BG prevents well-known discrepancies between arterial and capillary BG values.5
Statistical Analyses
Data were described as means ± standard deviation (SD) or medians and interquartile ranges (P25– P75) when appropriate. Data were compared using a two-tailed paired Student's t test. A p value <0.05 was considered statistically significant.
Correlation was described by calculating the Pearson's coefficient of correlation. To assess the agreement between the different methods, we used Bland–Altman analysis.6 Clarke error grid analysis (EGA) was performed to assess the clinical relevance of the differences.7,8 Finally, the GLYCENSIT procedure,9 a recently described statistically method for validating glucose sensors, was applied. In brief, for this analysis, the lower (“hypoglycemic” range) and upper (“hyperglycemic” range) out of range cutoff values were set at 80 and 110 mg/dl.1–3 The GLYCENSIT analysis consists of three complementary phases. The first phase tests the persistency in measurement behavior among “hypoglycemic,” normoglycemic, and “hyperglycemic” ranges. The entire set of paired glucose measurements was divided into these three subgroups for the ABL values. The second phase of the GLYCENSIT procedure tests the number of measurement errors with respect to the International Organization for Standardization (ISO) criteria10 using the bootstrap technique.11 This analysis is performed for different tolerance levels (2, 4, 6, 8, and 10%), indicating the relative number of errors against the aforementioned criteria that is allowed. This ISO criterion can be summarized as follows: for reference values that are smaller than or equal to 75 mg/dl, the value resulting from the test sensor is required to fall within ±15 mg/dl limits.
For reference values above 75 mg/dl, the target variability is defined as ±20%. The ISO norm requires that at least 95% of the observations should meet this criterion. In the third and final phase of the GLYCENSIT analysis, some tolerance intervals that indicate possible test sensor deviations for new observations are computed. These tolerance intervals show the range in which the value that would have been obtained with the reference device lies when a new test measurement is presented. Further, the probability level that the reference measurements effectively lie in the aforementioned tolerance interval is computed. This probability level directly reflects the number of paired glucose measurements.
Results
Thirty-seven adult ICU patients were included. Mean age was 63 ± 17 years, body weight was 69 ± 17 kg, and body mass index was 25 ± 4 kg/m2. Eighty six percent of the patients were postoperative cardiac surgery. The mean APACHE II score was 15 ± 5. In total, we obtained 452 paired samples of BG readings analyzed by the three different POCT glucometers. Median BG as measured by the reference technique (ABL blood gas analyzer) was 108 (89–130) mg/dl. Median BG as measured by Accu-Chek and HemoCue was significantly higher [113 (90–140) mg/dl and 123 (99–140) mg/dl, respectively] (p < 0.0001).
Linear Regression
The overall correlation between the different techniques was good for the total range of BG in the studied population (r2 ≥ 0.94) (Table 1). The correlation between ABL and Accu-Chek and HemoCue, respectively, for BG values in the TGC range and below 80 mg/dl was poor (r2 = 0.66 and 0.56; r2 = 0.73 and 0.78, respectively). For BG values above 110 mg/dl, the correlation between ABL and Accu-Chek and HemoCue, respectively, was better (r2 = 0.96 and 0.92, respectively).
Table 1.
Correlation Coefficients (r2)
| Accu-Chek | Hemocue | |
|---|---|---|
| ABL all ranges | 0.97 | 0.94 |
| ABL TGC ranges | 0.66 | 0.56 |
| ABL low ranges | 0.73 | 0.78 |
| ABL high ranges | 0.96 | 0.92 |
ABL, blood gas analyzer; TGC range, tight glycemic control range (80–110 mg/dl); low range, BG <80 mg/dl; high range, BG >110 mg/dl.
Error Grid Analysis
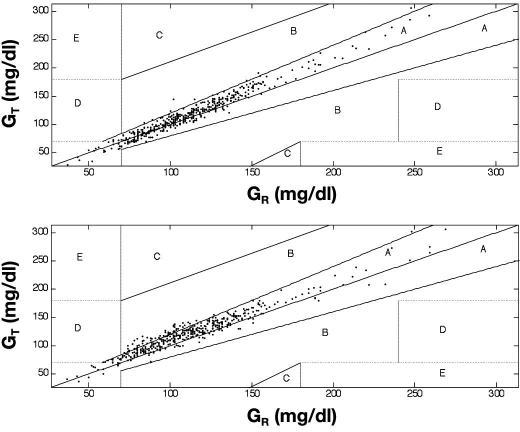
Applying EGA, 97.6 and 2.4% of the measurements were situated in zone A and B, respectively, for Accu-Chek (Figure 1a). When comparing ABL with Hemocue, 86.9 and 13.1% of the measurements were situated in zone A and B, respectively (Figure 1b).
Figure 1.
Error grid analysis. The EGA describes the clinical accuracy of self-monitoring BG devices. The obtained BG readings are classified into five zones (A, B, C, D, and E). Whereas zones A and B are clinically acceptable, zones C, D, and E are clinically inaccurate and unacceptable. (Top) Measurements of the Accu-Chek® test sensor (GT) as a function of the ABL® reference sensor (GR): 97.6 and 2.4% lie in zone A and B, respectively. (Bottom) Observations of the HemoCue® test sensor (GT) as a function of the ABL reference sensor (GR) are depicted: 86.9 and 13.1% lie in zone A and B, respectively.
Bland–Altman Analysis
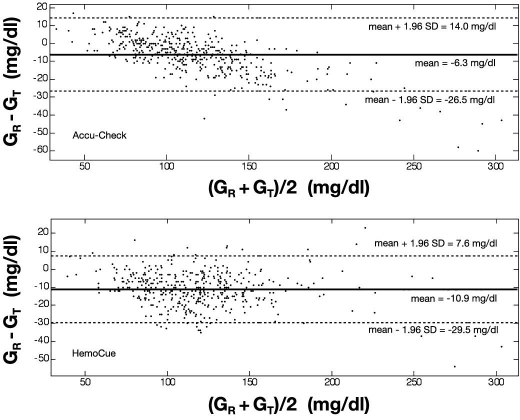
Bland–Altman analysis was performed for BG measurements in the total range (Figure 2) and separately for BG in the TGC range for BG below 80 mg/dl and above 110 mg/dl. The bias and corresponding limits of agreement for the different cohorts of BG are listed in Table 2.
Figure 2.
Bland–Altman analysis. The bias (or mean difference) and the limits of agreement (±1.96 standard deviation) are shown for both glucometers in the entire range of measured BG. The bias for the Accu-Chek® is –6.3 mg/dl; the limits of agreement are +14.0 and –26.5 mg/dl (top). The bias for the HemoCue® is –10.9 mg/dl; the limits of agreement are +7.6 and –29.5 mg/dl (bottom). Again, the reference (ABL) and the test sensor devices (Accu-Check/HemoCue) are symbolized by GR and GT, respectively.
Table 2.
Bland–Altman: Bias and Limits of Agreement between Tests
| Mean difference (mg/dl) | Limits of agreement (mg/dl) | |
|---|---|---|
| ABL vs AC | −6.3 | +14.0 and −26.5 |
| ABL vs HC | −10.9 | +7.6 and −29.5 |
| ABL vs AC (TGC range) | −3.1 | +11.6 and −17.7 |
| ABL vs HC (TGC range) | −12.8 | +5.5 and −31.1 |
| ABL vs AC (low range) | +1.2 | +13.2 and −10.9 |
| ABL vs HC (low range) | −7.9 | +7.6 and −23.3 |
| ABL vs AC (high range) | −11 | +10.7 and −32.7 |
| ABL vs HC (high range) | −10.5 | +8.5 and −29.5 |
ABL, blood gas analyzer; AC, Accu-Chek; HC, HemoCue; TGC range, tight glycemic control range (80–110 mg/dl); low range, BG <80 mg/dl; high range, BG >110 mg/dl; mean difference, bias; limits of agreement, mean difference ±1.96 SD.
GLYCENSIT Analysis
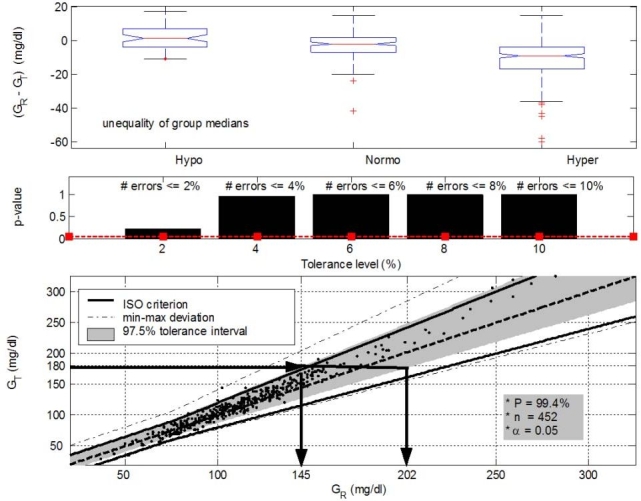
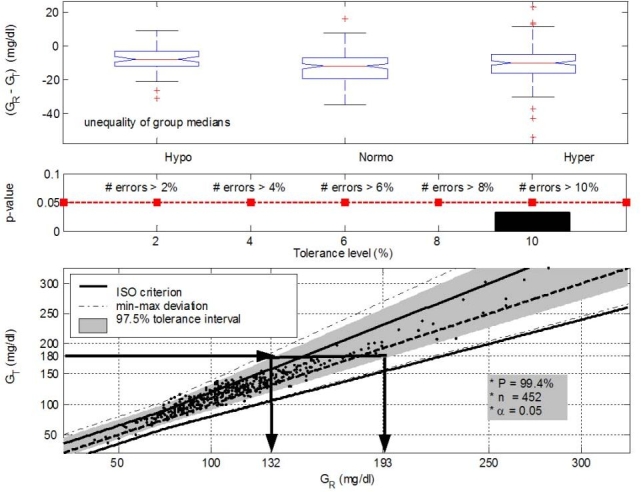
In the first step of the GLYCENSIT analysis, the null hypothesis was tested by the nonparametric one-way analysis of variance test (Kruskal–Wallis). This turned 0 and 0.002 as the p values for ABL versus Accu-Chek and ABL versus HemoCue, respectively. The null hypothesis states that medians of the errors per glycemic group are equal (p < 0.05). As a result, the null hypothesis was rejected with a probability of at least 95%. Indeed, no persistent measurement behavior was obtained for the sensors in this study, although it must be noted that persistently overestimated behavior was approached for the HemoCue (Figures 3 and 4, top).
Figure 3.

GLYCENSIT analysis for the Accu-Chek® sensor. (Top, phase 1) Nonpersistent measurement behavior (p = 0 < 0.05) shown by the presence of both overestimated and underestimated measurement deviations. Median measurement errors for the hypo-, normo-, and hyperglycemic range are 1.5, –2, and –9 mg/dl, respectively. (Middle, phase 2) Few errors against the ISO criterion are observed (p ≥ 0.05 for all selected tolerance levels). The significance level (5%) is represented by the dashed line. (Bottom, phase 3) The 97.5% tolerance intervals (shaded area) mean that 95 new measurements obtained from the test sensor out of 100 (significance level is 5%) lie in this area with a probability of 99.4%. The size of these intervals determines possible future sensor deviations. Let us take an example (illustrated with the arrows). When 180 mg/dl is measured with the test sensor (GT) (i.e., a new observation), the real (reference) glycemia value (GR) will lie between 145 and 202 mg/dl in 95% of the cases. The probability level (P) that the reference observation effectively lies in this area is equal to 99.4%. The solid and dashed line illustrate the ISO criterion limits and the GT = GR axis, respectively. Dashed–dotted lines denote the minimum and maximum deviation present in data (given by points).
Figure 4.

GLYCENSIT analysis for the HemoCue® sensor. Although the used Kruskal–Wallis test indicates nonpersistent measurement behavior (p = 0.0021 < 0.05), the top panel (phase 1) shows that this sensor device approaches a persistent (overestimated) measurement behavior. Median measurement errors for the hypo-, normo-, and hyperglycemic range are –8, –12, and –10 mg/dl, respectively. Many errors against the ISO criterion are observed, as presented in the middle panel (phase 2), as p < 0.05 for all selected tolerance levels. The size of the 97.5% tolerance intervals (P = 99.4%) is comparable to that from the Accu-Chek sensor (phase 3, bottom). When 180 mg/dl is measured with the test sensor (GT), the real (reference) glycemia value (GR) will lie between 132 and 193 mg/dl in 95% of the cases. The (persistent) overestimated measurement behavior is visualized as well. Use of a general conversion factor to approach “real” blood glucose may be feasible such that expected measurement errors can be taken into account in the TGC treatment.
Figures 3 and 4 (middle) illustrate the second phase of the GLYCENSIT analysis. Here, the computed p values as a function of the tolerance level are depicted for both test sensors. In the case of Accu-Chek, the null hypothesis, meaning that both signals are equal with respect to the ISO criterion, cannot be rejected for the selected tolerance levels (2, 4, 6, 8, and 10%) (p ≥ 0.05) (Figure 3, middle). Use of the HemoCue sensor, however, resulted in p values <0.05 for all the selected tolerance levels (Figure 4, middle), indicating that the null hypothesis was rejected with a probability of at least 95%. The Accu-Chek sensor clearly outperformed the HemoCue device for this second phase.
Finally, in the third phase of the GLYCENSIT analysis, some tolerance intervals that indicate possible test sensor deviations for new observations were computed. The shaded area (Figures 3 and 4, bottom) contains 97.5% of data and gives information concerning sensor errors for new measurements with the respective device under study. The probability (P) that 95 new measurements out of 100 (significance level 5%) effectively lie in this shaded area is 99.4%. This probability is related to the number of measurements (n) and is sufficiently high to rely on the computed tolerance intervals.
Conclusions
Reliable point of care testing is mandatory for implementing tight glycemic control with intensive insulin therapy in daily intensive care practice. In addition to avoidance of an important time delay between the blood sampling and the blood glucose result, which is required for timely adjustment of the insulin infusion, there is a high need for accuracy, particularly in the lower blood glucose ranges, to avoid potentially harmful hypoglycemia. Overall, in the entire cohort of BG readings in our study population, the correlation obtained by linear regression between the tested POCT devices (Accu-Chek and HemoCue) and the reference method (ABL) was good (r2 ≥ 0.94). According to the EGA, all BG measurements could be labeled “clinically acceptable” as they all were situated in zone A or B. Zone A means clinical accurate measurements without any clinical implication, whereas zone B results in appropriate clinical decisions. When considering EGA, both sensors appeared reliable. This is in accordance with previous reports on point-of-care glucose testing in critical care patients.4,12 However, linear regression is not the appropriate statistical test for assessing agreement between two quantitative assays of a chemical blood compound in clinical practice. Instead, EGA analysis is a commonly used method in diabetes technology research, but to our knowledge this methodology has not been validated in the ICU setting.
Therefore, we applied Bland–Altman analysis, a standard statistical procedure for assessing agreement between two methods for a clinical measurement.6 The bias and limits of agreement as determined by Bland–Altman analysis for the full range of BG for both glucometers were fairly wide and therefore questionable for safe clinical use in our study population. For example, a blood glucose level of 80 mg/dl obtained by either of these POCT techniques could, in reality, be “low” or “high” out of target range for TGC (80–110 mg/dl). Thus, caution is warranted when implementing TGC with these types of POCT glucometers. The overall HemoCue performance was poor (bias >–10.9 mg/dl) and showed a trend to systematically overestimate BG, which was confirmed by the first and third phases of the GLYCENSIT analysis. Although the bias with Accu-Chek was lower, the limits of agreement were wide with deviations depending on the range of BG: underestimation in the low glycemic range and overestimation in the high glycemic range [Figures 2 (top) and Figure 3].
When considering the GLYCENSIT analysis, both sensors have no persistently deviating measurement behavior as shown in the first phase (Figures 3 and 4, top). This nonpersistent consistent behavior was more pronounced with the Accu-Chek sensor. The measurement behavior of the HemoCue sensor approached a persistent overestimation. Persistent measurement behavior is preferred over nonpersistent deviations, as it allows the interchange between sensors with only one conversion factor. However, it must be stressed that persistent underestimation is safer and more preferable than persistent overestimation. The second phase of GLYCENSIT analysis revealed an acceptable performance of the Accu-Chek sensor with respect to the number of measurement errors for the range of the selected tolerance levels. This was in contrast with the HemoCue sensor, which failed at all tested tolerance levels (Figures 3 and 4, middle). The relative number of errors made in comparison to the ISO criterion was higher than the predefined tolerance levels. Thus, the measurement behavior of the HemoCue device was more persistent but was typically an overestimation of the reference sensor (phases 1 and 3), and many errors in comparison to the ISO criterion were observed.
The size of the tolerance intervals (third phase of the GLYCENSIT analysis) for the Accu-Chek and the HemoCue sensor was comparable. An important difference, however, was their relation to the ISO limits as could be expected from the second phase. On the one hand, the Accu-Chek tolerance intervals mostly lie within the ISO limits. The range in which the value lies that would have been obtained with the reference device when a new test measurement is presented is illustrated both under and above the dashed line in the bottom panel in Figure 3. This indicates that both under- and overestimations can be expected. On the other hand, the HemoCue tolerance intervals crossed the upper ISO limits (with only a slight deviation from the dashed line in the other direction). Thus measurement deviations for the HemoCue device were more persistent as also shown in the first phase (Figure 4, top) and were predominantly overestimations with regard to the reference sensor, whereas deviations for Accu-Chek were substantially more nonpersistent, being both over- and underestimations depending on the glycemic range (Figure 3, top).
There were some limitations to this study. Because we used arterial blood to test our hypothesis, our conclusions cannot be extended to other samples such as capillary blood. Furthermore, the accuracy of the reference method should be tested in the individual ICU setting and cannot automatically be introduced in another ICU environment.
In conclusion, for implementation of TGC in the clinical ICU setting, which holds an inherent risk of hypoglycemia, the performance and accuracy of bedside glucometers are of extreme importance. Based on our results, none of the tested glucometers showed complete clinical reliability. At first sight, the Accu-Chek sensor seems more accurate but is unpredictable regarding the direction of the measurement error. The HemoCue sensor is somewhat less accurate but the measurement error is more persistent, in particular overestimating the real BG. While awaiting more performant POCT methods, clinicians should decide what is preferable when choosing such a device: a less accurate sensor but with a more predictable and persistent measurement behavior or a slightly more accurate sensor with an unpredictable and nonpersistent measurement behavior.
Abbreviations
- BG
blood glucose
- EGA
error grid analysis
- ICU
intensive care unit
- ISO
International Organization for Standardization
- POCT
point of care testing
- SD
standard deviation
- TGC
tight glycemic control
References
- 1.Van den Berghe G, Wouters P, Weekers F, Verwaest C, Bruyninckx F, Schetz M, Vlasselaers D, Ferdinande P, Lauwers P, Bouillon R. Intensive insulin therapy in the critically ill patients. N Engl J Med. 2001;345(19):1359–1367. doi: 10.1056/NEJMoa011300. [DOI] [PubMed] [Google Scholar]
- 2.Van den Berghe G, Wilmer A, Hermans G, Meersseman W, Wouters P, Milants I, Van Wijngaerden E, Bobbaers H, Bouillon R. Intensive insulin therapy in the medical ICU. N Engl J Med. 2006;354(5):449–461. doi: 10.1056/NEJMoa052521. [DOI] [PubMed] [Google Scholar]
- 3.Krinsley J. Effect of an intensive glucose management protocol on the mortality of critically ill adult patients. Mayo Clin Proc. 2004;79(8):992–1000. doi: 10.4065/79.8.992. [DOI] [PubMed] [Google Scholar]
- 4.Louie R, Tang Z, Sutton D, Lee J, Kost G. Point of care glucose testing: effects of critical care variables, influence of reference instruments, and a modular glucose meter design. Arch Pathol Lab Med. 2000;124(2):257–266. doi: 10.5858/2000-124-0257-POCGT. [DOI] [PubMed] [Google Scholar]
- 5.Kulkarni A, Saxena M, Price G, O'Leary M, Jacques T, Myburgh J. Analysis of blood glucose measurements using capillary and arterial blood samples in intensive care patients. Intensive Care Med. 2005;31(1):142–145. doi: 10.1007/s00134-004-2500-5. [DOI] [PubMed] [Google Scholar]
- 6.Bland J, Altman D. Statistical methods for assessing agreement between two methods of clinical measurement. Lancet. 1986;1(8476):307–310. [PubMed] [Google Scholar]
- 7.Clarke W, Cox D, Gonder-Frederick L, Carter W, Pohl S. Evaluating clinical accuracy of systems for self-monitoring of blood glucose. Diabetes Care. 1987;10(5):622–628. doi: 10.2337/diacare.10.5.622. [DOI] [PubMed] [Google Scholar]
- 8.Cox D, Gonder-Frederick L, Kovatchev B, Julian D, Clarke W. Understanding error grid analysis. Diabetes Care. 1997;20(6):911–912. doi: 10.2337/diacare.20.6.911. [DOI] [PubMed] [Google Scholar]
- 9.Van Herpe T, Pelckmans K, De Brabanter J, Janssens F, De Moor B, Van den Berghe G. Statistical approach of assessing the reliability of glucose sensors: the GLYCENSIT procedure. J Diab Technol. 2008;2(6):939–947. doi: 10.1177/193229680800200604. [DOI] [PMC free article] [PubMed] [Google Scholar]
- 10.International Organization for Standardization: ISO 15197. In vitro diagnostic test systems–requirements for blood-glucose monitoring systems for self-testing in managing diabetes mellitus. Geneva: International Organisation for Standardization; 2003. [Google Scholar]
- 11.Efron B, Tibshirani RJ. An introduction to the bootstrap. New York: Chapman and Hall; 1993. [Google Scholar]
- 12.Finkielman J, Oyen L, Afessa B. Agreement between bedside blood and plasma glucose measurement in the ICU setting. Chest. 2005;127(5):1749–1751. doi: 10.1378/chest.127.5.1749. [DOI] [PubMed] [Google Scholar]


