Abstract
Background
Continuous glucose monitoring is presently used worldwide. Accuracy, precision, durability, invasiveness, and lack of drift of sensors and lag time are key parameters essential to these systems. This article describes a new online minimally invasive biodegradable microsensor for optical, transcutaneous interrogation, which has at least 14 days of functionality.
Method
Studies were performed in vitro and in vivo on pigs, as well as on type 1 diabetic humans. Functionality has been ensured in laboratory settings, and precision and durability have been tested in vivo. During in vivo studies, venous blood samples were used as reference.
Results were based on one single point calibration per experiment.
Results
Excellent stability was found in 14-day in vitro trials as well as in vivo in up to 70-hour trials. The overall median relative absolute difference of type 1 diabetic patients was 11.4%. Error grid analysis showed 97.7% of all values in the A+B zone. Comparable results were found in animal studies. No sensor drift was observed in any trial.
Conclusion
Results point toward the possibility of developing a stable and precise minimally invasive glucose reader for at least 2 weeks of continuous use.
Keywords: accuracy, continuous glucose monitoring, fluorescence, lifetime, variability
Introduction
In the last three decades several attempts have been made to develop continuous glucose sensors or methods of monitoring the blood or interstitial fluid (ISF) glucose directly that would be beneficial to the growing number of patients affected by type 1 and 2 diabetes worldwide. Throughout the world research groups and companies have invested time and money in developing a variety of solutions that would work as reliable glucose monitoring systems, ranging from infrared/near-infrared spectroscopy,1,2 impedance measurements,3 reverse ionotophoresis,4 viscometric,5,6 and fluorescence7–9 to electrochemical10–12 methods. The quest for such a reliable system often stands on the fact that the system lacks a “true” dose response between the measured signal and the glucose concentration. Other systems lack stability arising either from fouling of the membrane or from degradation of the signaling protein in the chosen setup. The last mentioned systems would call for frequent calibration, hence leaving the patient with a need to trust an unreliable system in drift.
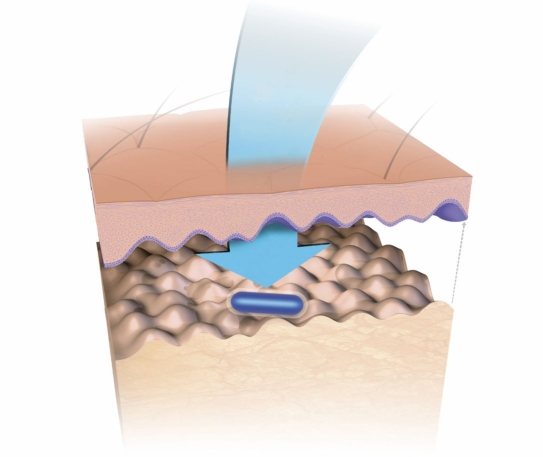
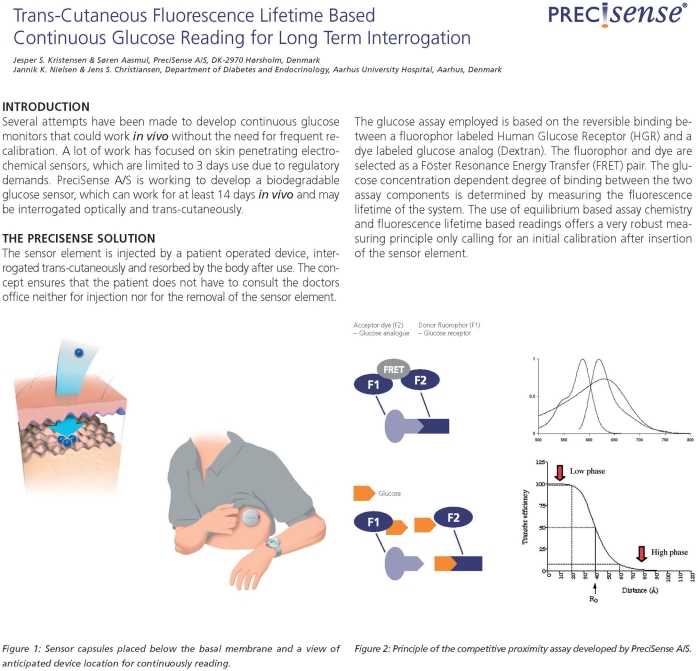
The market currently has three continuous glucose monitoring (CGM) systems available (electrochemical based) approved for 3- to 7-day use. PreciSense A/S is developing a biodegradable glucose microsensor that can work for at least 14 days in vivo while being interrogated optically and transcutaneously. The solution provided by PreciSense is a microsensor element that can be injected by a patient-operated device into the upper layer of the skin (in the dermis just below the basal membrane, see Figure 1), interrogated transcutaneously, and resorbed by the body after use. The concept ensures that the person with diabetes does not have to consult a clinic neither for injection nor for removal of the microsensor element after use. The main benefit for the diabetic patients using the PreciSense CGM microsensor system is the need for less finger pricking and hence less pain associated with glucose measurements. Only one injection every 14 days is needed. In return, patients have to accept the insertion of a microsensor that is resorbed in the dermis, as well as carrying a device on the body, which could lead to increased stigmatization of the patients.
Figure 1.
Microsensor capsule placed in the dermis just below the basal membrane. The microsensor is interrogated by the reader unit (not shown) aligned with the microsensor on top of the skin.
The implanted microsensor will be resorbed by the surrounding tissue, which negates the need of a potentially traumatizing explantation procedure. However, the fact remains that the patient needs to accept the resorbtion. For this, the microsensor needs to be safe in any thinkable manner. Therefore, we have used materials that we (and experts) consider safe. The ingredients are either approved by the Food and Drug Administration (FDA) for in vivo use already (the polymer for encapsulation), of human origin, and passed phase 1 clinical studies (the receptor protein) or already used for in vivo purposes (the ligand is used as a plasma expander).
Any manufacturer will have to address what happens if their sensor is destroyed, releasing highly immunogenic substances regardless of the indwelling sensor being removable (via a wire) or not. Using safe ingredients, as is the case with the PreciSense microsensor, will help diminish any such problem.
In order to evaluate all aspects of the PreciSense microsensor system, it was tested in vitro (long-term interrogation) for up to 14 days and in vivo for up to 3 days. The in vitro test was carried out in order to study the stability of the sensing system when pertubated with illumination and heat and in vivo tests to study the functionality under true physiological conditions. In vivo tests were done both preclinically and clinically. The preclinical study was performed on nondiabetic pigs in a clamp type of experiment, and clinical experiments were performed on type 1 diabetic patients in a hospital setup.
Material and Methods
System Description
The glucose assay employed in the microsensor element is based on reversible binding between a fluorophore-labeled human glucose receptor and a dye-labeled glucose analog (dextran). The fluorophore and dye are selected as a Förster resonance energy transfer pair. The glucose concentration-dependent degree of binding between the two assay components is determined by measuring the fluorescence lifetime of the system. The system is, in principle, equal to the systems suggested by Schultz and colleagues7 and Meadows and Schultz13 in the early 1980s and later by Lakowicz and Maliwal,8 Russell and colleagues,14 Chinnayelka and McShane,15 and a few companies.16–18 The use of equilibrium-based assay chemistry and fluorescence lifetime-based readings provides a sensing system that should be independent of the environment wherein it is embedded and hence give a very robust measuring principle, only calling for an initial calibration after insertion of the microsensor element. The equilibrium-based assay ensures that the chemistry response is independent of the gradient of glucose into the microsensor and only responds to the actual glucose concentration inside the microsensor. The use of time-resolved fluorescence as the interrogation principle ensures that minor changes of the assay composition do not influence the reading. Hence it yields a more robust sensing principle than that of fluorescence intensity. The robustness of the microsensor will demand fewer calibrations during use, which will be of benefit to the patients.
The use of a human glucose receptor (as a substitute for concanavalin A or apoenzymes from plants or fungi) ensures that no foreign body reactions will occur during resorbtion of the assay chemistry after degradation of the microsensor element.19 Also, the polymer employed to encapsulate the assay chemistry is made from an FDA-approved biodegradable polymer that is used as an implantable medical device20 and as a vehicle for biodegradable drug delivery systems.21
PreciSense Microsensor Element
The glucose responding assay chemistry consists of Alexa Fluor™ 594 (AF594), conjugated human mannan-binding lectin (AF594-MBL), and a 110-kDa hexamethoxy crystal violet-conjugated dextran (HMCV1-Dex). AF594 succimidyl ester was obtained from Invitrogen (Molecular Probes, Eugene, OR), and the dye HMCV1 succimidyl ester was synthesized as described.22 MBL was obtained from Statens Serum Institute (Copenhagen, Denmark). The dextran was obtained from PharmaCosmos A/S (Holbaek, Denmark) and aminated according to the procedure described by Lihme and Boenisch.23 Stained conjugates were made as suggested by Molecular Probes.24
The assay was embedded in a cylinder-like container made from the biodegradable polymer PolyActive™ (IsoTis, part of Integra Orthobiologics Inc., Irvine, CA). The polymer acts as a dialysis membrane, allowing the glucose (and other small molecules and ions) to diffuse almost unrestricted through the polymer. The glucose permeability was found to be approximately 10−7 cm2/s, i.e., approximately one-fifth the glucose permeability in a cellulose dialysis membrane.25 Also, the PolyActive membranes were able to withhold dextrans with a size of 10,000 Da for more than 3 weeks at 37°C but not dextrans with a size of 3000 Da (immediately leaked). The degradation of the polymer is caused by passive hydrolysis,26 and in a first trial in rabbits it was found that sensors had a degradation time of between 4 and 8 weeks.
The assay chemistry was sterile filtered before the aseptic assembly. The assay chemistry was dispensed into e-beam-sterilized polymer straw, and the polymer ends of the straw were closed by heat. The microsensor has a cylindrical shape with production dimensions Ø 0.5 × 5 mm. Further swelling of the sensor only increased the diameter by a maximum of 5%. This swelling of the polymer had no effect on the dose response from the sensors, which indicates that the assay chemistry is robust toward small changes in concentrations.
PreciSense Reader Unit
The reader unit used to interrogate the microsensor element was a home-built light-emitting diode (LED)/Avalanche photodiode-equipped, time-resolved fluorometer (measuring lifetime in the frequency domain) fitted with custom-made optics suited for reading the fluorescence from the AF594 fluorophore used in the assay. No conversions from obtained raw data (phase measurements) to lifetimes were made for any set of data. All measurements were performed with a modulation frequency of 61 MHz and a cross-correlation frequency of 968 Hz. The LED output was 1 mW measured at the skin surface, and calculations showed that approximately 2% of the incident light reached the microsensor. The reader unit was capable of collecting approximately 20% of the emitted fluorescence leaving the skin. The reader unit came in two versions. The first version used weighed approximately 75 g and the dimensions were 16 × 65 × 145 mm, and the second version weighed approximately 40 g with dimensions of 16 × 65 × 75 mm. Both versions were battery operated, and data logging was done both by a radio link and by a storage device (data logger) mounted in the reader unit itself. The reader unit was mounted on top of adhesive tape fixed to the skin in such a manner that the optics of the reader unit was aligned with the microsensor embedded in the skin. The reader unit read the microsensor element every 5 minutes, collecting 10 sample points for the calculation of the phase. The illumination period was 13 seconds every 5 minutes. Phase readings were done with a precision of ±0.02°.
Experimental
In Vitro Experiments
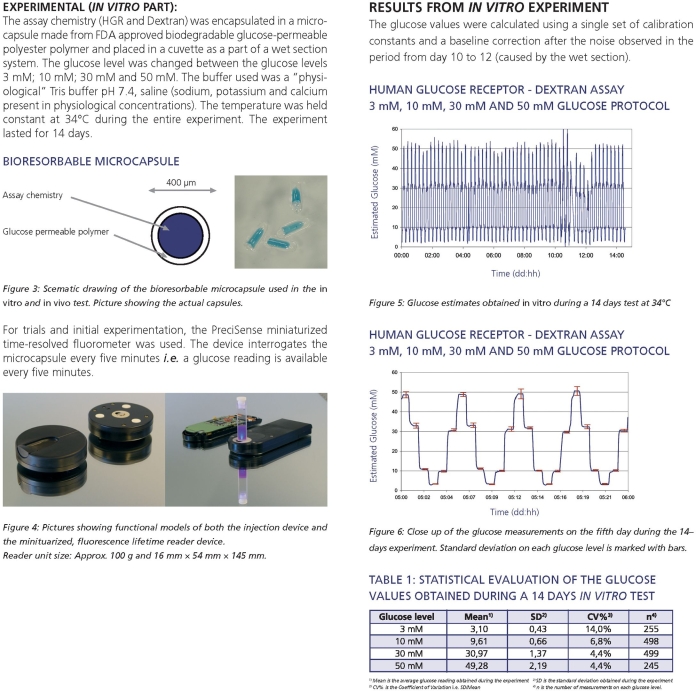
The microsensors were placed in a home-built cuvette that was part of a wet section system ensuring the continuous flow of three different glucose buffer solutions. The aqueous buffers used were all based on 10 mmol/liter Tris, with isotonic salt concentrations (cNa+ 135 mmol/liter, cK+ 4 mmol/liter, cCa2+ 1.25 mmol/liter), pH 7.4, containing 2.5 mmol/liter (45 mg/dl), 5 mmol/liter (90 mg/dl), or 15 mmol/liter (270 mg/dl) glucose. All glucose solutions were kept at 37°C at all times and the measurements were performed at 37°C with an interrogation interval of 5 minutes. Because of the nature of the wet section system, stable glucose levels were only obtainable for 16 hours of operation every 24 hours. During transient periods, the microsensors were still illuminated; hence the total time of photoperturbation of the assay was 63 minutes per 24 hours, yielding an illumination total for the 14 days of 14 hours and 34 minutes. During this 14-day period, the microsensor was exposed to approximately 1 joule of incident light.
Preclinical Experiments
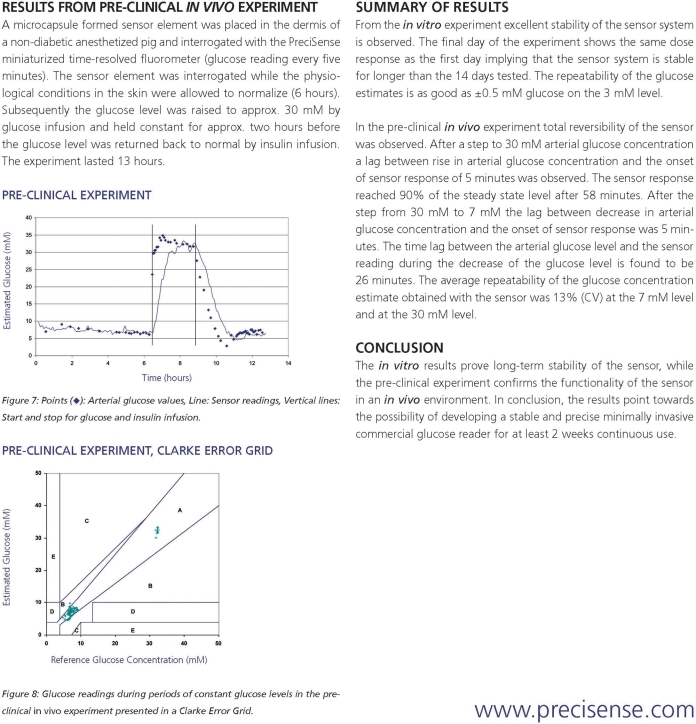
The 10 animals used were female pigs (Landrace, Yorkshire, Duroc). The study was approved by the local ethical committee. The day prior to measure-ments, the microsensor was inserted manually by use of a 19-gauge hypodermal needle parallel to the skin at a depth of approximately 0.3 to 0.5 mm. The pigs were anesthetized shortly with 0.5 mg/kg midazolam for the insertion and were subsequently allowed to move freely in their habitat. No action was taken to protect the microsensor overnight until the interrogation day. On the day of measurements, the pigs were anesthetized and the PreciSense reader units were mounted above the micro-sensors in order to interrogate them. The protocol used during the trials inscribed the blood glucose levels to be ensured as follows: euglycemic [5 mmol/liter (90 mg/dl)] level kept for 4 hours after mounting the reader unit, blood glucose level raised by glucose intravenous infusion at a rate of +10 mmol/liter/h (+3 mg/dl/min) to either 15 mmol/liter (270 mg/dl) or 30 mmol/liter (540 mg/dl) and kept constant at the high level for 2 hours before the blood glucose level was allowed to return to euglycemia at a rate of –10 mmol/liter/h (–3 mg/dl/min). The final euglycemic level was maintained for 2 hours. The reference used in the preclinical experiments was venous whole blood glucose (analyzed on a Radiometer ABL™ 615 system) and as control a CGMS Gold™ system was used (Medtronic MiniMed, Northridge, CA). Early preclinical experiments showed that the pigs had difficulties in tolerating longer periods of hypoglycemic events. The purpose of the experiments was to obtain longer lasting stable levels of glucose. Hence, the hypoglycemic events were omitted in order to secure results.
Prior to preclinical experiments, the study was approved by the authorities of animal welfare, Ministry of Justice. The pigs were sedated with 0.5 mg/kg midazolam and transported to the surgical research center. After arrival at the experimental research unit, anesthesia was commenced (5 μg/kg/min midazolam, 0.2 μg/kg/min fentanyl, and 0.25 mg/kg/min ketamine) and maintained throughout the experimentation period. Ventilation was maintained by a Servo 900 respirator (Siemens-Elema, Solna, Sweden). At the end of the experiment, the pigs were killed with potassium chloride injected into the heart.
Clinical Experiments
A study to show the performance of the PreciSense system in humans was performed. The study was approved by the local ethical committee and all participating subjects completed the consent information process according to the Declaration of Helsinki II. The 12 subjects were male and female diabetic type 1 patients aged 40 to 60 years. Patients were admitted to the hospital during the trial. The microsensor was inserted manually parallel to the skin surface by means of a 19-gauge needle. Only the microsensor was left in the skin. The insertion procedure was done by a trained person using a manually operated device. The PreciSense reader unit was placed on the skin above the microsensor, and measurements commenced within 1 hour from the time of insertion. Whether this 1-hour warm-up is needed cannot be tested before the insertion device is ready. At present the manual procedures and logistics in mounting the reader units are simply too long to go below 1 hour of warm-up time. In the future, this device will allow the patient to do the insertion him/herself and, at the same time, leave the adhesive tape on the skin for easy positioning of the reader unit.
Insertion of the sensor into human skin is easier than inserting it into pig skin. Human skin is much softer and the needles slide nicely into the skin, whereas more force is needed in pigs and hence the risk of going deeper with a loss of signal (fluorescence intensity) as a consequence.
The interrogation frequency of the microsensor was 5 minutes. The experiment lasted approximately 10 or 70 hours (1- or 3-day trial). Reference venous blood glucose samples were drawn every hour during the day and evening of the trial days, and the samples were analyzed by a Beckmann glucose analyzer. During trial days the patients were free to move around, eat, and behave as they were used to doing. Insulin was administered according to their own schedule. Readings from the PreciSense reader were not available to the patients during or after the trial. Glucose values from their own capillary testing devices were the only values available to the patients during the trial. Results from the venous blood samples were made available to the patients after the trial ended. As a full biological evaluation of the entire microsensor had not been performed prior to the trials, the microsensor was removed after completion of the experiment.
Results
In Vitro Results
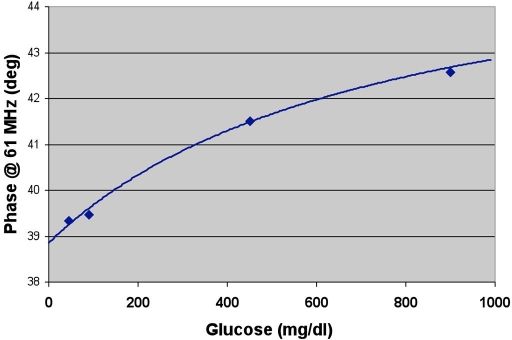
The dose response from the PreciSense assay chemistry inside the microsensor can be described by a three-parameter curve. The curve is the usual Michaelis–Menten-like curve description when ϕ0 = 0 and the relationship between the glucose estimate and the
where [Glu] is the glucose concentration, ϕ0 is the phase angle at [Glu] = 0, Δϕmax is the difference between the phase measurements for [Glu] = ∞ and [Glu] = 0, and KD is the apparent dissociation constant for the system. A typical dose–response curve is shown in Figure 2.
Figure 2.
Dose–response characteristics of an AF594-MBL/HMCV1-Dex assay in a microsensor container. Phase readings are performed in vitro and have a precision of ±0.02°. The curve parameters for this particular set of data are ϕ0 = 37.86 °; Δϕmax = 7.0°, and KD = 41.5 mmol/liter.
In order to be able to use such an assay in a clinical setting the glucose concentration-phase measurement relationship needs a three-point calibration, which is not practical in a person with diabetes. In order to avoid the three-point calibration, a stable assay chemistry system is needed, i.e., it is crucial that use of the microsensor only calls for a single-point calibration or no calibration at all.
During the 14 days of in vitro testing the microsensors exhibited excellent stability.27 Table 1 shows the statistics of the 1st and 14th days of the experiment. Two of the three calibration parameters (Δϕmax and KD) were constant during the entire test, only the baseline parameter (ϕ0) changed during the test; hence only a single-point calibration was needed during use. Results showed that the microsensor was stable, i.e., it did not change properties due to thermal degradation or photobleaching during the test period. It is obvious that the performance of the microsensor is convincingly good when compared to the International Organization for Standardization standard28 and that the microsensor system can be employed for clinical use for as long as 14 days.
Table 1.
Statistical Evaluation of Glucose Values Obtained during a 14-day In Vitro Testa
| Glucose level | Day 1 | Day 14 | DS/EN ISO 15197e | |||||
|---|---|---|---|---|---|---|---|---|
| Meanb | SDc | CV%d | Mean | SD | CV% | SD | CV% | |
| 45 mg/dl | 43.8 | ±2.9 | 6.7% | 47.4 | ±1.9 | 4.1% | ±7.6 | |
| 90 mg/dl | 90.3 | ±2.1 | 2.3% | 90.3 | ±3.9 | 4.3% | 10% | |
| 270 mg/dl | 272.5 | ±3.5 | 1.3% | 262.8 | ±5.8 | 2.2% | 10% | |
The two columns at the right show the International Organization for Standardization (ISO) standard test requirements for blood–glucose test systems. All values are shown in milligrams per deciliter. On every day each glucose level was measured 40 times (45 and 270 and 80 times (90 mg/dl) in a nonrandom protocol.
Mean is the average glucose reading obtained during day 1 or 14.
SD is the standard deviation obtained during day 1 or 14.
CV% is the coefficient of variation, i.e., SD/mean.
The ISO standard describing test requirements for blood–glucose monitoring.
The excellent thermal stability of the protein used in the assay could be due to it being at its natural conditions when kept at 37°C and pH 7.4. Human proteins are expected to be more stable at body temperature than proteins derived from (most) plants. The stability toward photobleaching in the interrogated signal is ascribed predominantly to the time-resolved interrogation principle. The investigation on how the process of photobleaching influences the tested assay has not yielded any clear answers; hence this issue has not been clarified in a satisfactory way.
Results from Preclinical Experiments
Glucose estimates obtained during the preclinical experiments were evaluated by median relative absolute difference (RAD) analysis and continuous glucose (Clarke) error grid analysis11 (CG-EGA). Results showed an overall median RAD (all levels) of 11.9%. This result indicated very good performance of the microsensor in pig skin. It should be noted that no algorithms were used to smooth the readings nor was it necessary to correct for any drift during the experiment (the system did not exhibit drift during the experiments) as often needed when electrochemical needle-based sensors are employed. The CG-EGA (Table 2) showed that 99% of the estimates were in the point EGA regions A+B, whereas the rate of glucose change yielded 84.5% of the points in the region A+B of the rate EGA. The time lag between ISF and venous blood in pigs varied from 8 to 25 minutes (time to 95% of steady state) among the different pigs in preclinical experiments. The variation between sensors in the same pig was much smaller, typically only up to ±2 minutes. This indicates that the observed time lag between glucose values in the two compartments is of physiological origin.
Table 2.
Relative Distribution of PreciSense Glucose Estimates Obtained during Preclinical Experiments Presented in the CG-EGA (Venous Whole Blood Samples Used as a Reference)a
| CG-EGA zone | Rate-EGA | Point EGA | ||
|---|---|---|---|---|
| Individual zones | Sum zones A+B | Individual zones | Sum zones A+B | |
| A | 61.2% | 84.5% | 82.9% | 99.6% |
| B | 23.3% | 16.7% | ||
| C | 9.5% | 0.0% | ||
| D | 3.1% | 0.4% | ||
| E | 2.9% | 0.0% | ||
The table summarizes 455 data preclinical trials. (A data set is a PreciSense reading vs a venous blood glucose reading with no correction for physiological time delay between the two different compartments.)
The CGM system control used during the preclinical experiments seemed to exhibit excessive drift, most probably due to the sensor not being placed in fat tissue but merely in muscular tissue; hence no results are shown.
Results from Clinical Trials
The single-day clinical experiments showed convincing results when data were evaluated according to the CG-EGA. During the trial no recalibrations were made; only one set of calibration parameters was applied to patient data. Results of the CG-EGA analysis showed 98% of points to lay in the A+B zones. The overall median RAD value found during the single-day trials was 11.4%.
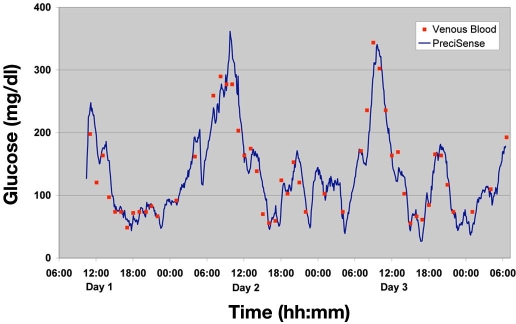
An example of an obtained glucose profile for one of the patients participating in the 3-day trial is shown in Figure 3. The glucose estimates were calculated retrospectively by applying the three-parameter curve shown earlier. The KD and Δϕmax were kept constant (values were obtained through an in vitro batch calibration of the sensor batches prior to the trial) during the whole series of measurements, and the ϕ0 was obtained by retrospective calibration. This method of “calibration” was chosen due to lack of knowledge of when would be the optimal time for calibration of the sensor after insertion. No correction for the physiological time lag was used.
Figure 3.
Data for male patient type 1, diabetes duration 11 years. The line shows the glucose estimate obtained by the every 5-minute interrogation of the PreciSense microsensor, and the points show the venous blood glucose from the patient.
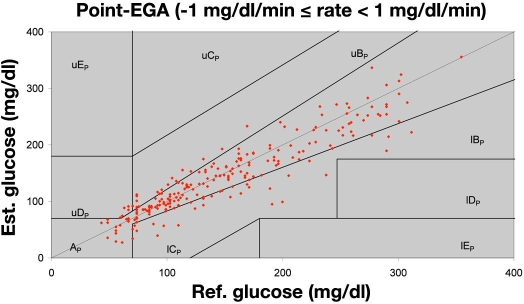
The fact that the PreciSense glucose estimates shown are based on one calibration set only during the entire 70 h of testing proves the ruggedness of the microsensor. The calibration sets for each individual patient used to convert raw data (phase measurements) to glucose estimates are shown in Table 3. No drift was observed on any sensors during any of the trials. Nothing indicated that any wear had occurred during the trial, e.g., caused by illumination from the reader unit or elevated temperatures during the trial. This confirms that the microsensor system is a very robust glucose sensing system suitable for clinical use. Figure 4 shows CG-EGA results for the lowest gradient for all 3-day trial patients. We only show the lowest gradient for matter of convenience and because this figure covers 85% of all collected data points. CG-EGA results showed that during the 3-day trial the A+B zones of the rate EGA were the only rate zones visited and that the A+B zones of the point EGA were visited 97.7% of the time (Table 4). The overall median RAD value obtained during the 3-day trial was 11.4%. These findings included all data, i.e., not restricted to |gradients| <±1 mg/dl/min. These findings are comparable to the findings by Kovatchev et al.,11 Wilson et al.,29 and Weinstein et al.30 in testing the Abbott's FreeStyle Navigator™ electrochemical indwelling sensor. This electrochemical sensor also exhibited a physiological time lag in the range of 8 to 21 minutes29 just like the PreciSense microsensor. We believe that this time lag is dominated by physiology (glucose determination in two different compartments) and not by the sensor itself. This is supported by the large inter pig variation and the low intra pig variation of the observed time lag. For humans this has not been tested, as we were only allowed to insert one sensor per patient during the trials. Because we believe that the origin is physiologic, the means to change it are difficult to identify.
Table 3.
Calibration Parameters Used for Calculating Glucose Estimates Shown for the 3-day Triala
| Calibration constants used | Results | |||
|---|---|---|---|---|
| ϕ0 (degree) | Δϕmax (degree)b | KD (mmol/liter) | Mean RAD | Median RAD |
| 48.14 | 10.00 | 41.5 | 11.7% | 8.8% |
| 47.92 | 10.00 | 41.5 | 14.0% | 11.1% |
| 45.18 | 10.00 | 41.5 | 17.7% | 13.5% |
| 47.52 | 8.00 | 41.5 | 16.5% | 9.9% |
| 47.86 | 8.00 | 41.5 | 19.2% | 15.2% |
| 47.57 | 10.00 | 41.5 | 19.9% | 16.9% |
The table presents calibration parameters for the last six patients during the trials, one set for each. The use of these calibration constants yields the statistical results shown.
A Δϕmax of 10 or 8 comes from two different sensor batches.
Figure 4.
Point EGA plot for the lowest gradient interval during the trial, i.e., 85% of the data sets acquired is shown here. Data points are from the last six patients participating in the 3-day trials.
Table 4.
Frequency of Points in Different Error Zones Visited during 3-Day Human Trials
| Error zone | Rate EGA | Rate A+B | Point EGA | Point A+B |
|---|---|---|---|---|
| A | 95.1% | 100.0% | 74.0% | 97.7% |
| B | 4.9% | 23.8% | ||
| C | 0.0% | 0.0% | ||
| D | 0.0% | 2.3% | ||
| E | 0.0% | 0.0% |
The table includes 288 correlated data sets obtained during the trials covering all gradients (not limited to ±1 mg/dl/min) (A data set is a PreciSense reading and a venous blood glucose reading with no correction for physiological time delay between the two different compartments.)
Knowing the nature of the dose–response curve of the assay, the error seen at the hypoglycemic levels in Table 5 would not be expected to be larger than the errors at both euglycemic and hyperglycemic situations. This is, however, the case and we believe that this is due to the physiological time lag between the microsensor reading and the reference method (venous blood glucose). The combination of a gradient and a time lag will lead to a difference between the two values measured at the same point in time. A gradient of 0.11 mmol/liter/min (2 mg/dl/min) and a time lag of 15 minutes yield an error of 1.67 mmol/liter (30 mg/dl) regardless of the absolute concentration of glucose. Because this difference is not dependent on the glucose level but is a constant value (for a given gradient and time difference) it will lead to a much larger relative error in the hypoglycemic region than for euglycemic and hyperglycemic levels.
Table 5.
Mean (Average) RAD and Median RAD from 3-Day Human Trialsa
| Glycemic region | Mean RAD | Median RAD |
|---|---|---|
| Hypoglycemic <70 mg/dl | 23.7% | 22.1% |
| Euglycemia | 15.9% | 10.5% |
| Hyperglycemic >180 mg/dl | 15.0% | 11.5% |
| PreciSense All | 16.3% | 11.4% |
Results are based on glucose estimates where the calibrations included fixed Δϕmax and KD. Only ϕ0 values was individual for each patient. The table includes 288 correlated data sets obtained during the trials covering all gradients (not limited to ±1 mg/dl/min). (A data set is a PreciSense reading and a venous blood glucose reading with no correction for physiological time delay between the two different compartments).
If an idealized glucose reading system were obtainable, the relative error at a (mean) euglycemic level of 5 mmol/liter (90 mg/dl), a (mean) absolute gradient of 0.0278 mmol/liter/min (0.5 mg/dl/min), and a physiological time lag between the ISF reading and the venous blood glucose value of 15 minutes would yield a relative error of 8.3% just due to the physiological time lag. The same calculation in a hypoglycemic situation at 2.5 mmol/liter (45 mg/dl) would yield an error of 16.7%.
We believe that it is important to look further into whether the lower limit of precision in these systems could be governed by the physiological time lag and the gradient.
The major concern for the person with diabetes using the PreciSense microsensor is the degrading nature of the microsensor. A full biological evaluation, including degradation of the microsensor, has not yet been done but will be needed prior to final clinical testing. An allergic reaction originating from a sensor burst (most likely the protein) would be the most worrying situation to happen. We believe that the human nature of the MBL will reduce the risk of anaphylactic reactions to a minimum. Further, the accumulated “intake” of MBL after 40 years of use (one inserted microsensor every 2 weeks) will be approximately one-tenth the single dose of MBL injected in the phase 1 trial. No adverse reactions were observed in that trial after the injection of MBL.19
Conclusions
The PreciSense microsensor system has, during the in vitro results, proven long-term stability of the microsensor, whereas the preclinical experiment confirmed the functionality of the microsensor in an in vivo environment. Clinical data confirm in the best possible way that the microsensor system is suitable for long-term continuous glucose measurements in type 1 diabetic patients without the need for frequent recalibration or smoothing algorithms. Furthermore, the fact that the microsensor functions equally well in pigs and humans confirms the postulate that the PreciSense microsensor system is, in fact, not dependent of the environment in which it has been placed. This is due to the nature of the microsensor (equilibrium chemistry with a fluorescence lifetime reporter system); it has been designed to exactly circumvent the problems that can give environmental dependence. In conclusion, results point toward the possibility of developing a stable and precise minimally invasive commercial glucose reader for at least 2 weeks of continuous use.
Abbreviations
- AF594
Alexa Fluor™ 594
- AF594-MBL
conjugated human mannan-binding lectin
- CG-EGA
continuous glucose (Clarke) error grid analysis
- CGM
continuous glucose monitoring
- FDA
Food and Drug Administration
- HMCV1-Dex
hexamethoxy crystal violet-conjugated dextran
- ISF
interstitial fluid
- LED
light-emitting diode
- RAD
relative absolute difference
Appendix
Previously published results from in vitro and preclinical experiments. Results were published as a poster at the 65th annual American Diabetes Association meeting in San Diego in 2005.
References
- 1.Robinson MR, Eaton RP, Haaland DM, Koepp GW, Thomas EV, Stallard BR, Robinson PL. Noninvasive glucose monitoring in diabetic patients: a preliminary evaluation. Clin Chem. 1992;38(9):1618–1622. [PubMed] [Google Scholar]
- 2.Small GW, Arnold MA, Marquardt LA. Strategies for coupling digital filtering with partial least-squares regression: application to the determination of glucose in plasma by Fourier transform near-infrared spectroscopy. Anal Chem. 1993;65(22):3279–3289. doi: 10.1021/ac00070a019. [DOI] [PubMed] [Google Scholar]
- 3.Pfutzner A, Caduff A, Larbig M, Schrepfer T, Forst T. Impact of posture and fixation technique on impedance spectroscopy used for continuous and noninvasive glucose monitoring. Diabetes Technol Ther. 2004;6(4):435–441. doi: 10.1089/1520915041705839. [DOI] [PubMed] [Google Scholar]
- 4.Potts RO, Tamada JA, Tierney MJ. Glucose monitoring by reverse iontophoresis. Diabetes Metab Res Rev. 2002;18(Suppl 1):S49–S53. doi: 10.1002/dmrr.210. [DOI] [PubMed] [Google Scholar]
- 5.Ehwald R, Ballerstadt R, Dautzenberg H. Viscosimetric affinity assay. Anal Biochem. 1996;234(1):1–8. doi: 10.1006/abio.1996.0040. [DOI] [PubMed] [Google Scholar]
- 6.Diem P, Kalt L, Haueter U, Krinelke L, Fajfr R, Reihl B, Beyer U. Clinical performance of a continuous viscometric affinity sensor for glucose. Diabetes Technol Ther. 2004;6(6):790–799. doi: 10.1089/dia.2004.6.790. [DOI] [PubMed] [Google Scholar]
- 7.Schultz JS, Mansouri S, Goldstein IJ. Affinity sensor: a new technique for developing implantable sensors for glucose and other metabolites. Diabetes Care. 1982;5(3):245–253. doi: 10.2337/diacare.5.3.245. [DOI] [PubMed] [Google Scholar]
- 8.Lakowicz JR, Maliwal B. Optical sensing of glucose using phase-modulation fluorimetry. Anal Chim Acta. 1993;271(1):155–164. [Google Scholar]
- 9.Rolinski OJ, Birch DJS, McCartney LJ, Pickup JC. Fluorescence resonance energy transfer from allophycocyanin to malachite green. Chem Phys Lett. 1999;309(5):395–401. [Google Scholar]
- 10.Wilkins E, Atanasov P. Glucose monitoring: state of the art and future possibilities. Med Eng Phys. 1996;18(4):273–288. doi: 10.1016/1350-4533(95)00046-1. [DOI] [PubMed] [Google Scholar]
- 11.Kovatchev BP, Gonder-Frederick LA, Cox DJ, Clarke WL. Evaluating the accuracy of continuous glucose-monitoring sensors: continuous glucose-error grid analysis illustrated by TheraSense Freestyle Navigator data. Diabetes Care. 2004;27(8):1922–1928. doi: 10.2337/diacare.27.8.1922. [DOI] [PubMed] [Google Scholar]
- 12.Kvist PH, Bielecki M, Gerstenberg M, Rossmeisl C, Jensen HE, Rolin B, Hasselager E. Evaluation of subcutaneously-implanted glucose sensors for continuous glucose measurements in hyperglycemic pigs. In vivo. 2006;20(2):195–203. [PubMed] [Google Scholar]
- 13.Meadows DL, Schultz JS. Design, manufacture and characterization of an optical fiber glucose affinity sensor based on a homogeneous fluorescence energy transfer assay system. Anal Chim Acta. 1993;280(1):21–30. [Google Scholar]
- 14.Russell RJ, Pishko MV, Gefrides CC, McShane MJ, Coté GL. A fluorescence-based glucose biosensor using concanavalin A and dextran encapsulated in a poly(ethylene glycol) hydrogel. Anal Chem. 1999;71(15):3126–3132. doi: 10.1021/ac990060r. [DOI] [PubMed] [Google Scholar]
- 15.Chinnayelka S, McShane MJ. Glucose sensors based on microcapsules containing an orange/red competitive binding resonance energy transfer assay. Diabetes Technol Ther. 2006;8(3):269–278. doi: 10.1089/dia.2006.8.269. [DOI] [PMC free article] [PubMed] [Google Scholar]
- 16.Ballerstadt R, Evans C, Gowda A, McNichols R. In vivo performance evaluation of a transdermal near-infrared fluorescence resonance energy transfer affinity sensor for continuous glucose monitoring. Diabetes Technol Ther. 2006;8(3):296–311. doi: 10.1089/dia.2006.8.296. [DOI] [PubMed] [Google Scholar]
- 17.Ballerstadt R, Polak A, Beuhler A, Frye J. In vitro long-term performance study of a near-infrared fluorescence affinity sensor for glucose monitoring. Biosens Bioelectron. 2004;19(8):905–914. doi: 10.1016/j.bios.2003.08.019. [DOI] [PubMed] [Google Scholar]
- 18.Chick WL, Wolf DE, Cardullo RA. United States US patent 5; Method and device for detecting and quantifying glucose in body fluids; pp. 342–789. [Google Scholar]
- 19.Valdimarsson H, Vikingsdottir T, Bang P, Saevarsdottir S, Gudjonsson JE, Oskarsson O, Christiansen M, Blou L, Laursen I, Koch C. Human plasma-derived mannose-binding lecta phase I safety and pharmacokinetic study. Scand J Immunol. 2004;59(1):97–102. doi: 10.1111/j.0300-9475.2004.01357.x. [DOI] [PubMed] [Google Scholar]
- 20.Kuijer R, Bouwmeester SJ, Drees MM, Surtel DA, Terwindt-Rouwenhorst EA, Van Der Linden AJ, Van Blitterswijk CA, Bulstra SK. The polymer Polyactive as a bone-filling substance: an experimental study in rabbits. J Mater Sci Mater Med. 1998;9(8):449–455. doi: 10.1023/a:1008867300634. [DOI] [PubMed] [Google Scholar]
- 21.Bezemer JM, Radersma R, Grijpma DW, Dijkstra PJ, Feijen J, van Blitterswijk CA. Zero-order release of lysozyme from poly(ethylene glycol)/poly(buthylene terephthalate) matrices. J Control Release. 2000;64(1-3):179–192. doi: 10.1016/s0168-3659(99)00127-3. [DOI] [PubMed] [Google Scholar]
- 22.Laursen BW, Norrild JC. Reagent for detecting an analyte. WO2005/059037A1 patent application. [Google Scholar]
- 23.Lihme AO, Boenisch T. United States patent US 5,543,332; Water-soluble, polymer-based reagents and conjugates comprising moieties derived from divinyl sulfone. [Google Scholar]
- 24.Amine-reactive probes. Molecular Probes ™, Invitrogen Detection Technologies; 2005. Oct 13, Molecular Probes publication MP00143. [Google Scholar]
- 25.Yu Y, Kristensen JS. Optical sensor for in vivo detection of an analyte. World patent application WO05110207. [Google Scholar]
- 26.Reed AM, Gilding DK. Biodegradable polymers for use in surgery–poly(ethylene oxide)/poly(ethylene terephthalate) (PEO/PET) copolymers. 2. In vitro degradation. Polymer. 1981;22(4):499–504. [Google Scholar]
- 27. Handout from poster presented at the ADA 2005 is available from www.precisense.com.
- 28.In vitro diagnostics test systems–requirements for blood-glucose monitoring systems for self-testing in managing diabetes mellitus. DS/EN ISO 15197. [Google Scholar]
- 29.Wilson DM, Beck RW, Tamborlane WV, Dontchev MJ, Kollman C, Chase P, Fox LA, Ruedy KJ, Tsalikian E, Weinzimer SA. The accuracy of the FreeStyle Navigator continuous glucose monitoring system in children with type 1 diabetes. Diabetes Care. 2007;30(1):59–64. doi: 10.2337/dc06-1407. [DOI] [PMC free article] [PubMed] [Google Scholar]
- 30.Weinstein RL, Schwartz SL, Brazg RL, Bugler JR, Peyser TA, McGarraugh GV. Accuracy of the 5-day FreeStyle Navigator Continuous Glucose Monitoring System: comparison with frequent laboratory reference measurements. Diabetes Care. 2007;30(5):1125–1130. doi: 10.2337/dc06-1602. [DOI] [PubMed] [Google Scholar]


