

Abstract
Background
Type 1 diabetes mellitus (T1DM) is characterized by the destruction of pancreatic β cells, resulting in the inability to produce sufficient insulin to maintain normoglycemia. As a result, people with T1DM depend on exogenous insulin that is given either by multiple daily injections or by an insulin pump to control their blood glucose. A challenging task is to design the next step in T1DM therapy: a fully automated insulin delivery system consisting of an artificial pancreatic β cell that shall provide both safe and effective therapy. The core of such a system is a control algorithm that calculates the insulin dose based on automated glucose measurements.
Methods
A model predictive control (MPC) algorithm was designed to control glycemia by controlling exogenous insulin delivery. The MPC algorithm contained a dynamic safety constraint, insulin on board (IOB), which incorporated the clinical values of correction factor and insulin-to-carbohydrate ratio along with estimated insulin action decay curves as part of the optimal control solution.
Results
The results emphasized the ability of the IOB constraint to significantly improve the glucose/insulin control trajectories in the presence of aggressive control actions. The simulation results indicated that 50% of the simulations conducted without the IOB constraint resulted in hypoglycemic events, compared to 10% of the simulations that included the IOB constraint.
Conclusions
Achieving both efficacy and safety in an artificial pancreatic β cell calls for an IOB safety constraint that is able to override aggressive control moves (large insulin doses), thereby minimizing the risk of hypoglycemia.
Keywords: artificial pancreas, insulin-on-board, model predictive control, type 1 diabetes mellitus
Introduction
Achieving normoglycemia in type 1 diabetes mellitus (T1DM) is one of the main goals of the diabetes research community. Normoglycemia is defined as blood glucose concentration in the range of 70–100 mg/dl.1 Current therapy is based on exogenous insulin administration by either multiple daily injections (MDI) or by continuous subcutaneous insulin infusion (CSII).
Insulin administration is based on insulin-to-carbohydrate ratio (I:C)2–4 and correction factor (CF)5,6 calculations, using sporadic blood glucose measurements obtained through self-monitoring of blood glucose (SMBG). The I:C describes the amount of carbohydrate (CHO) compensated for by a unit of insulin. The CF represents the reduction in blood glucose concentration caused by one unit of insulin. These values are obtained empirically and are tailored to specific individuals. The CF and I:C values enable calculation of the amount of insulin needed at each given moment as a function of blood glucose levels and CHO intake. However, basing the exogenous insulin administration strictly on these values without considering previous insulin administration may lead to hypoglycemia as a result of overcorrection. In an effort to address this problem, bolus wizards in modern CSII pumps estimate insulin on board (IOB) based on different insulin action curves.7
The amount of insulin administered, whether present in the blood or the subcutaneous space, at a given instant is the IOB. Insulin action varies between individuals and within each individual as a function of many factors, e.g., the time of day, stress, and illness. It is difficult to define a generic insulin action curve. As can be seen in Figure 1 and as reviewed by Zisser and colleagues, different insulin action curves are used by insulin pump software to predict insulin clearance in the body, and the “available” insulin is used as complementary information for the estimation of the correction dose.7
Figure 1.
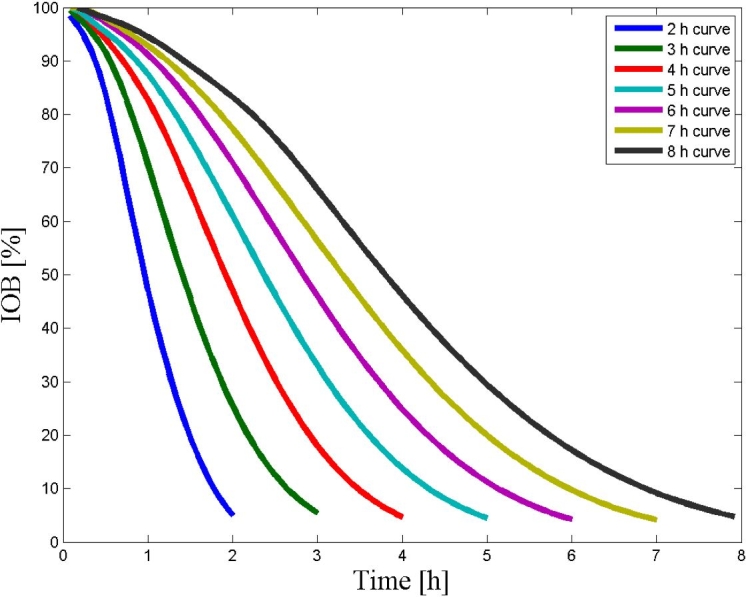
An illustration of nonlinear insulin action curves. The action curves differ from each other by their duration of action and are being used by CSII pump bolus wizards to estimate the available insulin in plasma, modified from Walsh and associates.8 These curves are the result of pharmacodynamic–pharmacokinetic studies and are specific to the insulin type.9
Modern therapeutic technology has improved open-loop insulin therapy significantly; however, people with T1DM still suffer from long-term sequelae, including retinopathy, nephropathy, neuropathy, and vascular complications, as a result of prolonged hyperglycemia. The Diabetes Control and Complication Trial concluded that maintaining near normoglycemia via intensive insulin therapy effectively delays the onset and slows the progression of diabetes complications. The chief adverse effect of intensive insulin therapy was a threefold increase of severe hypoglycemia.10
At the core of an artificial pancreatic β cell is a control algorithm that regulates blood glucose concentration by manipulating exogenous insulin delivery.11–14 In this work, a model predictive control (MPC) algorithm was selected as the control strategy. The MPC is an advanced control algorithm that is extensively used in the chemical industry.15 The MPC algorithm computes at each given sampling time (k) a sequence of control moves that minimize a predefined cost function by predicting the trajectories of the controlled system. The cost function usually consists of terms related to the deviation of state variables from the set point, the magnitude of the control variables, and the rate of change of control variables.
One of the advantages of an MPC algorithm is its ability to integrate constraints into the control move calculations. Future trajectories of the controlled system are estimated by a mathematical model, such as an autoregressive exogenous input (ARX) model.16
An ARX model describes a discrete linear connection between outputs at sample time k to inputs and outputs at prior sampling times:
| (1) |
where y at sampling time k is related to the past output measurements at sampling times k-1 and k-2 and the previous control variable u at time k-1. The constants α, β, and γ are constants that are estimated, usually by a least squares procedure, to fit measured data.16 In the context of diabetes, the output y will represent glucose concentration, and u will represent insulin and meal inputs.
A critical step before any clinical implementation of an artificial pancreatic β cell is extensive in silico studies. These simulation studies are based on mathematical models of T1DM. Several mathematical models of the human glucose/insulin dynamics are available. Models can range from simplified descriptions such as the Bergman “minimal” model,17 which describes insulin/glucose dynamics in the plasma with two differential equations, to a higher-order model that takes into account several subsystems in the human body, including the subcutaneous subsystem along with the exogenous delivery of meals and insulin such as those of Wilinska and associates,18 Hovorka and coworkers,14 and Dalla Man and colleagues.19 The Dalla Man model19 serves as the mathematical core behind the Food and Drug Administration approved simulation environment for closed-loop testing of artificial pancreatic β cell control algorithms.20
In this work, the ability of a MPC with IOB to regulate glycemia safely by controlling the rate of exogenous insulin delivery is demonstrated. A dynamic safety constraint on the maximum rate of insulin delivery was based on empirical clinical knowledge such as CF, I:C, and total daily insulin in order to avoid over-delivery of insulin.
Materials and Methods
The simulation platform of Kovatchev and associates,20 which is based on the T1DM model of Dalla Man and coworkers,19 was used as a test bed for the control approach that was evaluated using MATLAB®'s Model Predictive Control Toolbox and Simulink® (The MathWorks, Inc., Natick, MA) platforms. Ten adult subjects are available to the Juvenile Diabetes Research Foundation Artificial Pancreas Consortium members, and these ten subjects are taken to be representative of both intersubject and intrasubject variations found among people with T1DM.
The MPC cost function in this work is defined as
| (2) |
where are blood glucose concentrations after subtraction of the set point; is a vector of future calculated injected insulin moves after basal rate subtraction; is the vector of future injected insulin increments; ωy, ωu, and ωΔu are optimization weights that correspond to blood glucose concentrations offset, future calculated injected insulin moves, and future injected insulin increments, respectively; p and n are the output prediction and input control horizon, respectively; is the injected insulin value at steady state; and Umax(k) is a dynamic safety constraint based on evaluated IOB. The ARX models were obtained by input and output tests that resembled a clinical experiment. These models were used as the basis of the model predictions in the MPC algorithm.
In order to investigate how well the control algorithm functioned under uncertainties, two tests were implemented. First, ARX models that were specified for each subject were used to control the other 9 subjects, resulting in 100 new simulations for the 10 different subjects. Second, a 50% normal random noise was added to the output, introducing a more in vivo scenario for current continuous glucose monitoring devices.
The IOB constraint was based on IOB estimations using the 6, 7, and 8 h insulin action curves. The different action curves were used as an additional control, tuning parameters to enable a more aggressive control action for high glucose concentrations (6 h curve for glucose greater than 140 mg/dl) as well as conservative control action for lower glucose concentrations (8 h curve for glucose less than 100 mg/dl). Chase and colleagues21,22 introduced insulin saturation to their control model that required an online optimization in order to estimate kinetic parameters. This differs from the present approach that uses predefined insulin action curves to enable a dynamic constraint on the control moves. In effect, the predefined curves are simple, empirical models that can be tuned to an individual and are consistent with the readily available features on “smart” insulin pumps.23
Both clinical ratios (I:C and CF) are used by the controller to calculate the maximum insulin dose at each control calculation. To constrain the controller from administering an excess amount of insulin, IOB is evaluated at each control move, using the insulin delivery history, such that, if the calculated insulin dose is greater than the IOB constraint, the controller action is adjusted to be the limiting value of this constraint.
The IOB at sampling time k is calculated using the past residuals of administered insulin over 8 h (time of the slowest action curve):
| (3) |
where IOB(k) is a scalar representing the total IOB at sampling time k, IOBmemory is a vector that contains 8 h of insulin administration history based on a sampling time of 5 min, IOBcurve is a vector representing a sampled insulin action curve of 6, 7, or 8 h (Figure 1) depending on the measured blood glucose concentration, and T is the transpose operator.
The upper constraint on the MPC is calculated by the following condition:
| (4) |
where Umax(k) is the maximum insulin delivery rate above the basal rate and ICHO(k) is the amount of insulin needed to compensate for a given meal at sampling time k and is calculated by
| (5) |
where M is the mass of CHO in grams consumed in a given meal at sampling time k, and I:C is given in insulin units to grams CHO. IG(k) is the amount of insulin needed to correct for a positive deviation from the set point at sampling time k and is calculated by the following condition:
| (6) |
where G(k) and Gss(k) are the measured and desired blood glucose concentrations at sampling time k, respectively . The “else” clause in Equation (6) ensures that insulin can be delivered after meal consumption if necessary.
Results
Two types of control strategies (MPC with and without the IOB constraint) were evaluated and compared following a 24 h clinical protocol consisting of three meals (8:00 AM, noon, and 6:00 PM) with 20, 40, and 70 g of CHO, respectively. Each simulation started with steady state conditions at 7:00 AM.
The MPC tuning parameters were kept constant during the simulations. The sampling time was set to 5 min, the prediction horizon was set to 400 time steps (in accordance with the simulated system's settling time), and the control horizon was set to 5 time steps. The weights on the change in insulin infusion rate and on glucose set point tracking were both set to one.
Fifty percent of the simulations without the IOB constraint resulted in hypoglycemia (18.6% of the overall simulation time). On the other hand, only 10% of the simulations that were governed by the IOB constraint resulted in hypoglycemia and only for a very short period (0.75% of the overall simulation time). Ten percent of the simulations without the IOB constraint resulted in a hyperglycemic event (for only 0.2% of the overall simulation time). Fifty percent of the simulations that were governed by the IOB constraint resulted in hyperglycemic events for only 3.5% of the overall simulation time. These results are summarized in Table 1.
Table 1.
Summary of the Simulations Conducted on the 10 In Silico Subjectsa
| Constraint type | Subject | % of time < 60 mg/dl | % of time > 180 mg/dl | % of time < 140 mg/dl | Daily insulin [U] |
|---|---|---|---|---|---|
| Fixed hard | 1 | 0 | 0 | 95 | 53.3 |
| IOB | 1 | 0 | 0 | 80 | 45.8 |
| Fixed hard | 2 | 15 | 0 | 100 | 39.1 |
| IOB | 2 | 0 | 0 | 81 | 30.6 |
| Fixed hard | 3b | 60 | 0 | 98 | 266 |
| IOB | 3b | 7 | 3 | 86 | 134 |
| Fixed hard | 4 | 0 | 0 | 100 | 32.9 |
| IOB | 4 | 0 | 8 | 65 | 29.8 |
| Fixed hard | 5 | 0 | 2 | 88 | 53.9 |
| IOB | 5 | 0 | 6 | 79 | 49.5 |
| Fixed hard | 6 | 90 | 0 | 100 | 98.7 |
| IOB | 6 | 0 | 14 | 59 | 44.4 |
| Fixed hard | 7 | 0 | 0 | 93 | 33.9 |
| IOB | 7 | 0 | 4 | 82 | 31.5 |
| Fixed hard | 8 | 4 | 0 | 100 | 38.1 |
| IOB | 8 | 0 | 0 | 82 | 32.8 |
| Fixed hard | 9 | 17 | 0 | 98 | 94.9 |
| IOB | 9 | 0 | 0 | 91 | 61.8 |
| Fixed hard | 10 | 0 | 0 | 94 | 52.7 |
| IOB | 10 | 0 | 0 | 82 | 47.4 |
It is evident that the IOB constraint provides a safer control solution by almost completely eliminating hypoglycemic events. Mild hyperglycemia events occur only for very short periods.
It should be noted that subject 3 is an outlier due to extremely low insulin sensitivity, a drop of 3 mg/dl for 1 U of insulin.
Figure 2 emphasizes the importance of the IOB safety constraint. It can be seen that, without the IOB safety constraint (Figure 2A), the control actions (Figure 2C) causes hypoglycemia. The presence of the IOB safety constraint (Figure 2B) keeps glycemia within the range of 100–170 mg/dl. The IOB constraint is illustrated in Figure 2D), where the control actions are restricted by the IOB constraint.
Figure 2.
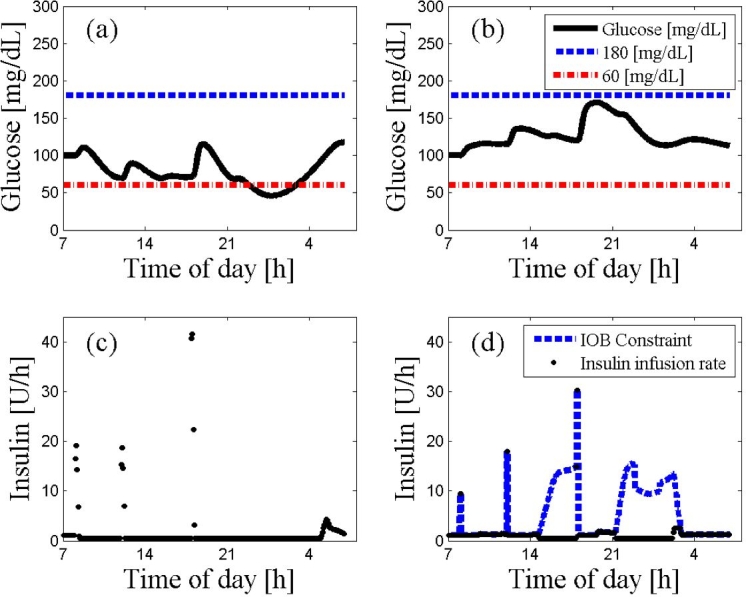
An ARX-based MPC on subject 2 with and without the IOB constraint. The 24 h scenario starts at 7:00 AM at steady state followed by a protocol of three meals (8:00 AM, noon, and 6:00 PM) with 20, 40, 70 g of CHO, respectively. The MPC used a prediction horizon of 400 time steps, a control horizon of 5 time steps, and a weighting of unity for both insulin delivery rates and glucose tracking error. Panel (A) describes glycemic trajectories (continuous line) with a fixed hard constraint that exhibits risky behavior by crossing the hypoglycemic threshold. The precarious results are prevented by the controller incorporating the IOB constraint as presented in panel (B). Moreover, the MPC with the IOB constraint keeps glycemia, marked by a continuous curve, above 100 mg/dl without any risk of hypoglycemia. The IOB constraint on the rate of insulin administration is described by the dashed curve in panel (D), while the implemented insulin rate of the control moves is represented by circles in both panels (C) and (D). Panel (D) shows that the rate of the injected insulin is frequently constrained by the empirical values of the CF and I:C to prevent potential hypoglycemia.
As can be seen from Figure 3, the IOB constraint tends to produce more conservative results. The controller without the IOB constraint marginally outperforms (Figure 3A) the controller with the IOB constraint (Figure 3B), where the response to the meals and especially the dinner excursion could be more aggressive (Figure 3D). However, overall behavior of the two controller trajectories is quite similar.
Figure 3.
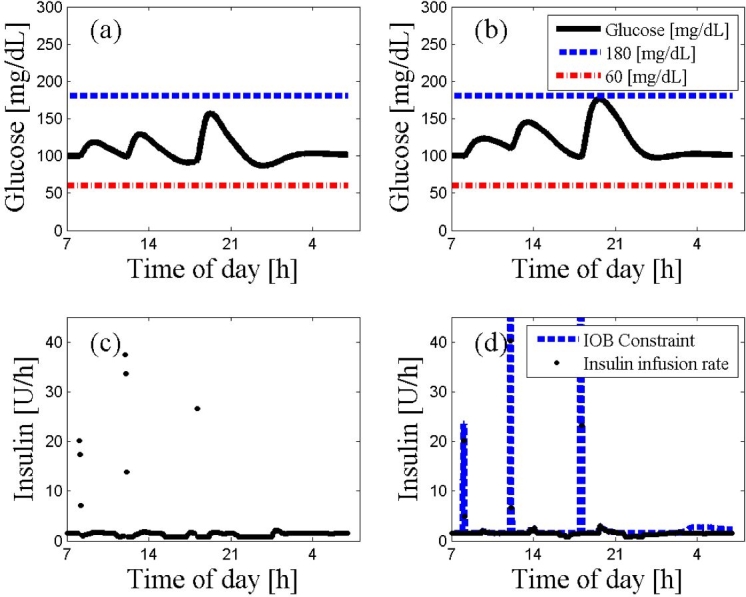
An ARX-based MPC on subject 10 with and without the IOB constraint. The 24 h scenario starts at 7:00 AM at steady state followed by a protocol of three meals (8:00 AM, noon, and 6:00 PM) with 20, 40, 70 g of CHO, respectively. The glucose trajectories with and without the IOB constraint are presented in panels (A) and (B), respectively. The controller moves with or without the IOB constraint are presented in panels (C) and (D), respectively. The dashed lines represent the values of hyperglycemia and hypoglycemia. The controller that incorporated the IOB constraint shows a more conservative behavior in panel (D) than the controller that was missing the IOB constraint in panel (C).
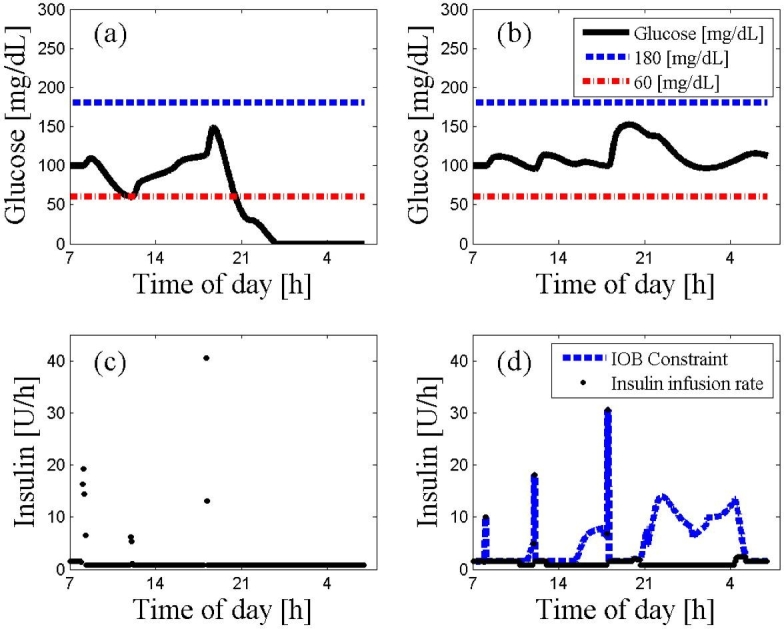
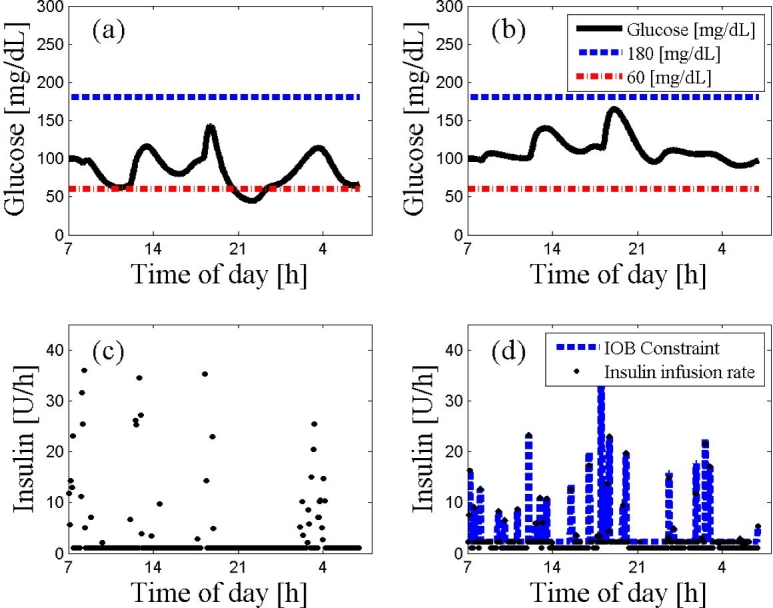
In Figure 4, clinical results from a closed-loop clinical trial are presented as proof of concept to the use of IOB as a dynamic constraint for insulin dosing. Both Institutional Review Board approval and a consent form were obtained for the clinical trial, and the subject was a 47-year-old male, weight 90.9 kg, with CF of 1 U for 25 mg/dl and I:C of 1:6.8 U:g CHO. As can be seen from Figure 4, the insulin delivery rate was constrained by the IOB such that the delivered amount above basal was the residual of the insulin needed for correction minus the IOB, or zero if the IOB was greater than the amount needed for correction.
Figure 4.

Clinical results from a closed-loop trial, presenting the use of IOB constraint to prevent an overdose of insulin. The glucose trajectory, the controller set point of 100 mg/dl, and the insulin delivery rate are presented in the upper panel as constant curve, dotted curve, and dashed curve, respectively. The IOB constraint, insulin for correction, and allowed insulin amount above basal are presented in the lower panel as constant curve, dashed–dotted curve, and dotted curve, respectively. As can be seen from the lower panel, the allowed insulin delivery rate above basal is the amount needed for correction minus the IOB, or zero if the results is negative.23
From 100 simulations with model uncertainty, 15 hypoglycemic events occurred using the IOB compared to 59 hypoglycemia events when the IOB constraint was removed. Moreover, 90% of the closed-loop experiments with noise and without the IOB constraint showed at least one hypoglycemic event comparing to only one event when the IOB constraint was used. Figure 5 shows the controller performance when the model from subject 1 is used to control subject 2. The simulation without the IOB exhibits severe (nonphysiologic) hypoglycemia (Figure 5A), while using the IOB constraint (Figure 5B) improves controller performance. Figure 6 demonstrates controller performance with normally distributed output noise with variance of 50% of the measured value. Again, the IOB constraint (Figure 6B) improves the controller performance. The simulation without the IOB constraint (Figure 6A) shows some unstable behavior with some hypoglycemic events.
Figure 5.
An ARX-based MPC on subject 2 using the ARX model derived from subject 1 data. The 24 h scenario starts at 7:00 AM at steady state followed by a protocol of three meals (8:00 AM, noon, and 6:00 PM) with 20, 40, 70 g of CHO, respectively. The glucose trajectories with and without the IOB constraint are presented in panels (A) and (B), respectively. The controller moves with or without the IOB constraint are presented in panel (C) and (D), respectively. The dashed lines represent the values of hyperglycemia and hypoglycemia. As depicted, the IOB constraint overrides the control moves that produced hypoglycemia otherwise.
Figure 6.
An ARX-based MPC on subject 9 using the ARX model derived from subject 9 data in the presence of measurement noise. The 24 h scenario starts at 7:00 AM at steady state followed a protocol of three meals (8:00 AM, noon, and 6:00 PM) with 20, 40, 70 g of CHO, respectively. The glucose trajectories with and without the IOB constraint are presented in panels (a) and (b), respectively. The controller moves with or without the IOB constraint are presented in panel (c) and (d), respectively. The dashed lines represent the values of hyperglycemia and hypoglycemia. As depicted, the IOB constraint “jumps” between insulin action curves at the presence of the noise but overall maintains good control and prevents hypoglycemia and the unstable behavior introduced otherwise by the hard constraint control.
Conclusions
Aggressive control moves may endanger users of a future artificial pancreatic β cell. The control algorithm is based on an MPC that is dynamically constrained by the estimated IOB as part of the optimal control solution. Controllers that incorporate the IOB constraint result in a relatively safe control scenario, even in the presence of large uncertainty. When the model is accurate, however, the unconstrained controller outperforms the controller with IOB.
This control strategy can achieve both good performance in regulating blood glucose and at the same time provide a safety constraint that can avoid over-delivery of insulin that can result from model mismatch and uncertainty. Constraining the controller aggressiveness and thus preventing insulin overdose, one can minimize the risk of hypoglycemia. It should be noted that this is the omnipresent tradeoff between safety and efficacy, where, in this approach, a balance between these desirable attributes can be achieved.
Abbreviations
- ARX
autoregressive exogenous input
- CF
correction factor
- CHO
carbohydrate
- CSII
continuous subcutaneous insulin infusion
- I:C
insulin-to-carbohydrate ratio
- IOB
insulin on board
- MDI
multiple daily injections
- MPC
model predictive control
- SMBG
self-monitoring of blood glucose
- T1DM
type 1 diabetes mellitus
References
- 1.American Diabetes Association. Standards of medical care in diabetes—2006. Diabetes Care. 2006;29(Suppl 1):S4–S42. [PubMed] [Google Scholar]
- 2.Rabasa-Lhoret R, Garon J, Langelier H, Poisson D, Chiasson JL. Effects of meal carbohydrate content on insulin requirements in type 1 diabetic patients treated intensively with the basal-bolus (ultralente-regular) insulin regimen. Diabetes Care. 1999;22(5):667–673. doi: 10.2337/diacare.22.5.667. [DOI] [PubMed] [Google Scholar]
- 3.Slama G, Klein JC, Delage A, Ardila E, Lemaignen H, Papoz L, Tchobroutsky G. Correlation between the nature and amount of carbohydrate in meal intake and insulin delivery by the artificial pancreas in 24 insulin-dependent diabetics. Diabetes. 1981;30(2):101–105. doi: 10.2337/diab.30.2.101. [DOI] [PubMed] [Google Scholar]
- 4.Vlachokosta FV, Piper CM, Gleason R, Kinzel L, Kahn CR. Dietary carbohydrate, a Big Mac, and insulin requirements in type I diabetes. Diabetes Care. 1988;11(4):330–336. doi: 10.2337/diacare.11.4.330. [DOI] [PubMed] [Google Scholar]
- 5.Perley M, Kipnis DM. Plasma insulin responses to glucose and tolbutamide of normal weight and obese diabetic and nondiabetic subjects. Diabetes. 1966;15(12):867–874. doi: 10.2337/diab.15.12.867. [DOI] [PubMed] [Google Scholar]
- 6.Seltzer HS, Allen EW, Herron AL, Jr., Brennan MT. Insulin secretion in response to glycemic stimulus: relation of delayed initial release to carbohydrate intolerance in mild diabetes mellitus. J Clin Invest. 1967;46(3):323–335. doi: 10.1172/JCI105534. [DOI] [PMC free article] [PubMed] [Google Scholar]
- 7.Zisser H, Robinson L, Bevier W, Dassau E, Ellingsen C, Doyle FJ, III, Jovanovic L. Bolus calculator: a review of four “smart” insulin pumps. Diabetes Technol Ther. 2008;10(6):441–444. doi: 10.1089/dia.2007.0284. [DOI] [PubMed] [Google Scholar]
- 8.Walsh J, Roberts R. 4th ed. San Diego: Torrey Pines Press; 2006. Pumping insulin. [Google Scholar]
- 9.Natali A, Gastaldelli A, Camastra S, Sironi AM, Toschi E, Masoni A, Ferrannini E, Mari A. Dose-response characteristics of insulin action on glucose metabolism: a non-steady-state approach. Am J Physiol Endocrinol Metab. 2000;278(5):E794–E801. doi: 10.1152/ajpendo.2000.278.5.E794. [DOI] [PubMed] [Google Scholar]
- 10.The Diabetes Control and Complication Trial Research Group. The effect of intensive treatment of diabetes on the development and progression of long-term complications in insulin-dependent diabetes mellitus. N Engl J Med. 1993;329(14):977–986. doi: 10.1056/NEJM199309303291401. [DOI] [PubMed] [Google Scholar]
- 11.Bequette BW. A critical assessment of algorithms and challenges in the development of a closed-loop artificial pancreas. Diabetes Technol Ther. 2005;7(1):28–47. doi: 10.1089/dia.2005.7.28. [DOI] [PubMed] [Google Scholar]
- 12.Hovorka R, Wilinska ME, Chassin LJ, Dunger DB. Roadmap to the artificial pancreas. Diabetes Res Clin Pract. 2006;74(Suppl 2):S178–S182. [Google Scholar]
- 13.Parker RS, Doyle FJ, III, Peppas NA. A model-based algorithm for blood glucose control in type 1 diabetic patients. IEEE Trans Biomed Eng. 1999;46(2):148–157. doi: 10.1109/10.740877. [DOI] [PubMed] [Google Scholar]
- 14.Hovorka R, Canonico V, Chassin LJ, Haueter U, Massi-Benedetti M, Federici M, Pieber TR, Schaller HC, Schaupp L, Vering T, Wilinska ME. Nonlinear model predictive control of glucose concentration in subjects with type 1 diabetes. Physiol Meas. 2004;25(4):905–920. doi: 10.1088/0967-3334/25/4/010. [DOI] [PubMed] [Google Scholar]
- 15.García CE, Prett DM, Morari M. Model predictive control: theory and practice—a survey. Automatica. 1989;25(3):335–348. [Google Scholar]
- 16.Lennart L. 2nd ed. Upper Saddle River: Prentice Hall; 1999. System identification: theory for the user. [Google Scholar]
- 17.Bergman RN, Phillips LS, Cobelli C. Physiologic evaluation of factors controlling glucose tolerance in man: measurement of insulin sensitivity and beta-cell glucose sensitivity from the response to intravenous glucose. J Clin Invest. 1981;68(6):1456–1467. doi: 10.1172/JCI110398. [DOI] [PMC free article] [PubMed] [Google Scholar]
- 18.Wilinska ME, Chassin LJ, Schaller HC, Schaupp L, Pieber TR, Hovorka R. Insulin kinetics in type-1 diabetes: continuous and bolus delivery of rapid acting insulin. IEEE Trans Biomed Eng. 2005;52(1):3–12. doi: 10.1109/TBME.2004.839639. [DOI] [PubMed] [Google Scholar]
- 19.Dalla Man C, Rizza RA, Cobelli C. Meal simulation model of the glucose-insulin system. IEEE Trans Biomed Eng. 2007;54(10):1740–1749. doi: 10.1109/TBME.2007.893506. [DOI] [PubMed] [Google Scholar]
- 20.Kovatchev PB, Breton DM, Dalla Man C, Cobelli C. In silico model and computer simulation environment approximating the human glucose/insulin utilization. Food and Drug Administration Master File MAF-1521. 2008 [Google Scholar]
- 21.Chase JG, Shaw GM, Lin J, Doran CV, Hann C, Lotz T, Wake GC, Broughton B. Targeted glycemic reduction in critical care using closed-loop control. Diabetes Technol Ther. 2005;7(2):274–282. doi: 10.1089/dia.2005.7.274. [DOI] [PubMed] [Google Scholar]
- 22.Wong XW, Singh-Levett I, Hollingsworth LJ, Shaw GM, Hann CE, Lotz T, Lin J, Wong OS, Chase JG. A novel, model-based insulin and nutrition delivery controller for glycemic regulation in critically ill patients. Diabetes Technol Ther. 2006;8(2):174–190. doi: 10.1089/dia.2006.8.174. [DOI] [PubMed] [Google Scholar]
- 23.Zisser H, Dassau E, Bevier W, Jovanovič L, Doyle FJ., III Basal insulin-on-board constraint in the implementation of closed-loop control. Diabetes. 2008;57(Suppl 1):A13. [Google Scholar]