

Abstract
Background
The technological advancements in subcutaneous continuous glucose monitoring and insulin pump delivery systems have paved the way to clinical testing of artificial pancreas devices. The experience derived by clinical trials poses technological challenges to the automatic control expert, the most notable being the large interpatient and intrapatient variability and the inherent uncertainty of patient information.
Methods
A new model predictive control (MPC) glucose control system is proposed. The starting point is an MPC algorithm applied in 20 type 1 diabetes mellitus (T1DM) subjects. Three main changes are introduced: individualization of the ARX model used for prediction; synthesis of the MPC law on top of the open-loop basal/bolus therapy; and a run-to-run approach for implementing day-by-day tuning of the algorithm. In order to individualize the ARX model, a sufficiently exciting insulin profile is imposed by splitting the premeal bolus into two smaller boluses (40% and 60%) injected 30 min before and 30 min after the meal.
Results
The proposed algorithm was tested on 100 virtual subjects extracted from an in silico T1DM population. The trial simulates 44 consecutive days, during which the patient receives breakfast, lunch, and dinner each day. For 10 days, meals are multiplied by a random variable uniformly distributed in [0.5, 1.5], while insulin delivery is based on nominal meals. Moreover, for 10 days, either a linear increase or decrease of insulin sensitivity (±25% of nominal value) is introduced.
Conclusions
The ARX model identification procedure offers an automatic tool for patient model individualization. The run-to-run approach is an effective way to auto-tune the aggressiveness of the closed-loop control law, is robust to meal variation, and is also capable of adapting the regulator to slow parameter variations, e.g., on insulin sensitivity.
Keywords: artificial pancreas, diabetes, in silico patients, simulation
Introduction
Recent technological advancements in subcutaneous continuous glucose monitoring (CGM) and subcutaneous insulin delivery systems have paved the way for the development of a minimally invasive closed-loop control system for maintaining normoglycemia in type 1 diabetes mellitus (T1DM).1–3 Thanks to the availability of innovative sensors and actuators, the possibility to successfully maintain normoglycemia has significantly improved, so that automatic control experts are faced with new technological challenges.
The main obstacle to satisfactory closed-loop control is the presence of significant disturbances (e.g., meals and physical activity) and delays in the effect of meals and subcutaneous insulin on glycemia and, furthermore, from glycemia to sensor measurements of subcutaneous glucose. These features explain the difficulties encountered when standard proportional-integral-derivative controllers are employed. Model predictive control (MPC) is likely to be the most suitable approach to design control systems in the presence of delays and constraints.4 Compensation for delays by means of feed-forward action, as well as constraint handling, is naturally incorporated in the design process. For the potential of MPC strategies to glucose control in T1DM, the reader is referred elsewhere.2,5,6
A successful MPC strategy7 has been applied in a clinical study at the University of Virginia, Padova, and Montpellier, covering night and breakfast conducted on 20 patients.8–10 The outcome of this clinical trial was an excellent overnight regulation, while breakfast control showed a margin of improvements. In this article, we propose three significant improvements in the control design in order to improve meal regulation. The first improvement aims to exploit all the knowledge incorporated in conventional open-loop therapy. Accordingly, the goal of the MPC algorithm is to cope with all possible disturbances, including uncertainty of meal and patient parameters. The second change is the use of an individualized ARX model, which should improve the predictive capability of the mean population model used in Reference 7. The third modification is the development of an algorithm capable to tune the aggressiveness of the controller on a day-by-day basis according to a run-to-run approach. The run-to-run strategy is inspired by traditional batch processes. In the glucose control problem, patterns of meal intake, glucose measurement, and insulin delivery repeat themselves in 24 h cycles. Run-to-run control algorithms have been used to optimize the traditional open-loop control therapy via a day-by-day adaptation of basal and premeal boluses of insulin. In particular, in References 11–13, run-to-run control was used to design the insulin bolus, while in Reference 14, the run-to-run framework was successfully applied to adjust basal dosing of insulin. Here, the run-to-run approach is used to tune the MPC controller and is tested on the T1DM simulator accepted by the Food and Drug Administration as a substitute to animal trials.15–18
Methods
Model of Type 1 Diabetes Mellitus
In order to synthesize and test the controller, we used the meal glucose–insulin model.15–18 The nonlinear and time-varying model consists of 13 differential equations. An important feature of the simulator is the incorporation of interindividual variability within the population of T1DM patients by means of 26 individualizable parameters. The parameters were assumed to be log-normally distributed to ensure their nonnegativity. A covariance matrix was calculated using the log-transformed parameters. One hundred subjects were generated using the joint distribution, i.e., 100 realizations of the log-transformed parameter vector were randomly extracted from the multi-variate normal distribution characterizing intersubject variability. Finally, the parameters in the 100 virtual subjects were obtained by antitransformation.
Performance Assessment by Control Variability Grid Analysis: Virtual Protocol
The performance of closed-loop glucose control is tested on a 44-day virtual protocol. The simulation starts at basal value at 00:00 AM, and the first meal is breakfast at 7:30 AM with 50 g of glucose, lunch at 12:30 PM with 75 g of glucose, and dinner at 6:30 PM with 85 g of glucose. The insulin delivery during closed-loop control is piecewise constant and is updated every 15 min. Shorter sampling intervals are technologically possible but are not compatible with medical supervision that is likely to be required in the first clinical trials on real patients.
Several outcome measures have been proposed to judge the effectiveness of closed-loop control in a single patient (see, e.g., Reference 19). However, the only instrument able to asses the overall performance in a population of patients, e.g., to compare the performances of different closed-loop controllers and/or different tuning choices for a given controller, is the control variability grid analysis (CVGA).20 The CVGA is a method for visualization of the extreme glucose excursions caused by a control algorithm in a group of subjects, with each subject represented by a single data point for any given observation period. This differentiates the analysis from other standard statistics, such as mean and standarddeviation, that do not provide population-based visualization of the data. Following the ideas of the classic Clarke error grid analysis used for evaluation of the accuracy of self-monitoring21 or CGM devices,22 nine rectangular zones are introduced in order to classify subjects into categories. The necessity of a population index stems from the availability of a large-scale simulation model (see, e.g., References 15–18) that allows the generation of hundreds of virtual patients. The availability of realistic individual models is the basis for conducting an in silico trial; the control can be individually tuned and then tested on each virtual patient, possibly introducing disturbances and uncertainties in order to assess robustness of closed-loop control. Here, we use the CVGA not only to assess the overall performance, but also to introduce a metric for the automatic tuning of the controller. In the computation of the maximal glycemia, the first 3 h after the meal are not considered.
Open-Loop Control
Open-loop glucose control is based on the combination of basal insulin administration and premeal boluses proportional to glucose intake through carbohydrate ratio (CR) factor. Carbohydrate ratio was optimized for each subject in order to minimize the distance from the diagonal of CVGA, which represents the best compromise between hypo and hyper risks.
ARX Model Identification
Compared to other black-box models, ARX models can be more easily identified because of their linear-in-parameter structure but are still flexible enough to guarantee good predictions. The former property is particularly important in the context of physiological systems where data are not only noisy, but also subject to unmodeled disturbances and possible time-varying dynamics.
For this motivation, the model chosen for the synthesis of the controller is an ARX model, identified from the data, whose inputs are the meal glucose d and the variation of injected insulin with respect to basal rate (δu = u − ub) and whose output is the variation of subcutaneous glucose concentration with respect to basal (δy = y − yb):
| (1) |
where n, nu, nd are the orders of the autoregressive and exogenous parts, respectively, ku is the delay of the insulin input, and e(k) is a white noise error term.
To obtain the identification data, a 1-day open-loop experiment was performed. In order to guarantee good identifiability properties, each premeal bolus was split in two smaller boluses (40% and 60% of the premeal bolus) injected 30 min before and 30 min after the meal (see also Reference 23). To enhance long-range prediction performance, the “Focus” option was set to “Simulation” in the arx.m MATLAB function.24
The validation data were obtained in the same way as the identification data except for bolus amounts, which were 60% and 40% of the original premeal bolus.
All possible ARX models with 2 ≤ n ≤ 5, 2 ≤ nu ≤ 5, 2 ≤ nd ≤ 5, and 1 ≤ ku ≤ 2 were identified. For each patient, model selection was performed via minimization of the cross-validation sum of squared residuals among the models that satisfy the following requirements: (i) stability, (ii) positive gain from d to dy, (iii) negative gain from du to dy, and (iv) positive and negative impulse responses from d and du after 1 h, respectively. If none of the models satisfied these conditions, individualization was dropped and the average population model was used.
Model Predictive Control
Given the identified ARX model, the MPC law is based on the solution of a finite-horizon optimal control problem (FHOCP), where a cost function is minimized with respect to the input δu subject to the dynamics of the system model. Letting δuo be the solution of the FHOCP, according to the receding-horizon paradigm, the feedback control law is obtained by applying to the system only the first element of the optimal solution. In this way, a closed-loop control strategy is obtained solving an open-loop optimization problem.
The main objective of the proposed MPC law is to improve the robustness properties of the conventional open-loop therapy with respect to uncertainties on the actual meal and on physiological parameters like insulin sensitivity. Assuming that, in nominal condition, the open-loop therapy is well tuned, the objective of MPC is to minimize the glycemia error with respect to the nominal open-loop profile. This idea and the use of an individualized ARX model, instead of an average model, are the main differences with respect to the algorithm proposed in Reference 7.
More precisely, the minimization of the following quadratic discrete-time cost function is considered:
| (2) |
subject to the identified ARX model Equation (1), where
q is a positive constant, δuo is the over basal open-loop insulin therapy, and δyo = yo − yb, where yo is the set point.
The MPC law has the following structure:
where ΔYo(k) = [δyo(k+1), δyo(k+2), …, δyo(k+15), δyo(k+16)]′; D (k) = [d(k), d(k+1), …, d(k+14), d(k+15)]′; ΔUo(k) = [δuo(k), δuo(k+1), …, δuo(k+14), δuo(k+15)]′; and Gyo, Gx, GD, and Guo are suitable matrices.
If the calculated insulin rate uo(k) is negative, a zero value is applied. The major advantages of this input–output MPC scheme are that an observer is not required (x is made of past input and output values) and its ease of implementation (real-time optimization is avoided).
Model predictive control, in general, has several independent tuning parameters: control and prediction horizon, output and input weights, and terminal penalty. However, as it will be better illustrated in Results, another advantage of the adopted choice is the possibility to achieve satisfactory regulation by only tuning one parameter (the output weight q) in a quite straightforward and intuitive way.
Run-to-Run Control
The controller performance depends on the tuning parameter, q, which should be individually tuned to cope with the specific dynamics of each single patient. We propose to start with a nominal q, safe (i.e., scarcely aggressive) for all possible patients, which is updated daily on the basis of the regulation performance observed in the previous 24 h. Daily performance is reflected by the position in the CVGA plot of the point associated with the 24 h glycemic profile of the subject. The ideal point in the CVGA is the lower left corner. In practice, we observed that, when changing the controller aggressivity through parameter q (the higher q, the more aggressive the regulation), there is a trade-off between hypoglycemia and hyperglycemia episodes. In other words, reducing the x coordinate in CVGA is at the expense of an increase of the y coordinate. To achieve a balance, a q is sought that places the subject on the diagonal of the CVGA plot, meaning that regulation performs comparably with respect to hypoglycemia and hyperglycemia risks. For this reason, the distance from the diagonal is adopted as a performance measure. Letting the x and y coordinates of a patient in the CVGA be defined according to a linear scale on both axes ranging from 0 in the lower left corner to 60 in the lower right and higher left corner, respectively, by simple geometric arguments, the performance measure is given by . Note that p is positive when y is greater than x and, vice versa, when y is lower than x.
The update rule for q is worked out according to a so-called run-to-run strategy.11–14 Letting q(i) denote the parameter q used during the ith day, and p(i) the associated performance, the next value is computed as
| (3) |
In Equation (3), u(i) is an estimate of the sensitivity of p with respect to q, while λ is a parameter that regulates speed of convergence toward the optimal q. If sensitivity were perfectly known and p were noiseless, λ = 1 would entail instantaneous convergence. Taking into account uncertainty and noise, the run-to-run literature suggests to use smaller values, also to limit noise amplification. In our simulated trial, a reasonable compromise was achieved using λ = 0.6.
For safety reasons, it is also advisable to put limits to the admissible changes of q. This was done by introducing some modifications to the basic algorithm:
Finally, the sensitivity estimate, m, is computed as the slope of the linear regression of the last three values of p(i) against the corresponding values of q(i). A limit on the maximum value of m was fixed to −1000.
Results
Model Identification
The ARX models were successfully identified for all the 100 patients. Model quality was assessed by means of the following fit score, computed on the validation data: FIT = 100). More precisely,
where Y is the vector of observed glucose values, Ŷ is the vector of model predictions, Y is a vector whose entries are the mean of the observed glucose values, and Euclidean norms are used (a perfect fit yields the maximal value: FIT = 100).
It resulted that FIT = 85.1 ± 7 (mean ± standard deviation). A histogram of the FIT scores for the whole population is reported in Figure 1. The variability of the model orders from subject to subject is reported in Table 1.
Figure 1.
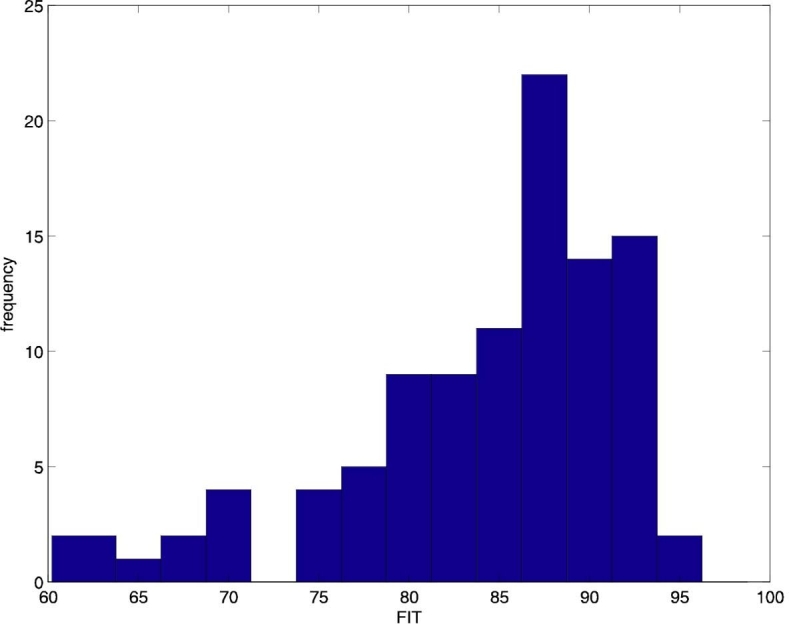
Histogram of the FIT scores of the identified ARX models.
Table 1.
Number of Identified Models for Each Order of ARX Model
| 1 | 2 | 3 | 4 | 5 | |
|---|---|---|---|---|---|
| n | — | 6 | 28 | 41 | 25 |
| nu | — | 8 | 21 | 24 | 47 |
| nd | — | 19 | 21 | 18 | 42 |
| ku | 54 | 46 | — | — | — |
Experiments
Experiment 1
One hundred subjects are simulated for 1 day using the open-loop control strategy with an optimized CR.
Experiment 2 (Day 1)
One hundred subjects are simulated using q = q = 0.00035 for all the subjects. The set point yo is equal to 110 mg/dl from 9:00 PM to 8:00 AM, 180 mg/dl from 8:00 AM to 10:00 AM, 130 mg/dl from 10:00 AM to 1:00 PM, 180 mg/dl from 1:00 PM to 3:00 PM, 130 mg/dl from 3:00 PM to 7:00 PM, and 180 mg/dl from 7:00 PM to 9:00 PM. The above-basal open-loop insulin therapy δuo is obtained through the CR used in experiment 1. Experiments 3–6 are performed sequentially in the sense that initial conditions of experiment 3 are the final ones of experiment 2 and so on.
Experiment 3 (Days 2–14)
The same as experiment 2, but this time, q is updated daily following the run-to-run control strategy. The initial value of q is equal to q, and the sensitivity estimate m is equal to −20/q.
Experiment 4 (Days 15–24)
The same as experiment 3, but with meals multiplied by a random variable uniformly distributed in [0.5, 1.5] while insulin delivery is computed with the vector of future meals D(k) made by nominal meals.
Experiment 5 (Days 25–34)
The same as experiment 2.
Experiment 6 (Days 35–44)
The same as experiment 2, but with either a linear increase or decrease of both insulin sensitivity parameters kp3 and Vmx (see Reference 15 for details). The terminal parameter variation is ±25% of nominal values. The decision between increase or decrease is randomly taken for each patient with equal probability.
Experiment 7
The same as experiment 1, but with the same meals as the day 15 of experiment 4.
Experiment 8
The same as experiment 1, but with the same insulin sensitivity parameters as the day 44 of experiment 6.
Assessment of Performance
With reference to experiments 2–6, in Figure 2 the glucose and insulin time profiles of a representative virtual patient (#26) are plotted.
Figure 2.

Experiments 2–6 for patient #26.
During experiments 2–3 (days 1–14), the run-to-run procedure attains a good glycemic regulation within a few days. The subsequent meal perturbations during experiment 4 (days 15–24) produce some excursions that are, however, kept under control.
In subsequent experiment 5 (days 25–34), strict glycemic regulation is promptly recovered. Finally, during experiment 6 (days 35–44), the insulin sensitivity variation is effectively compensated by the run-to-run adaptation of q.
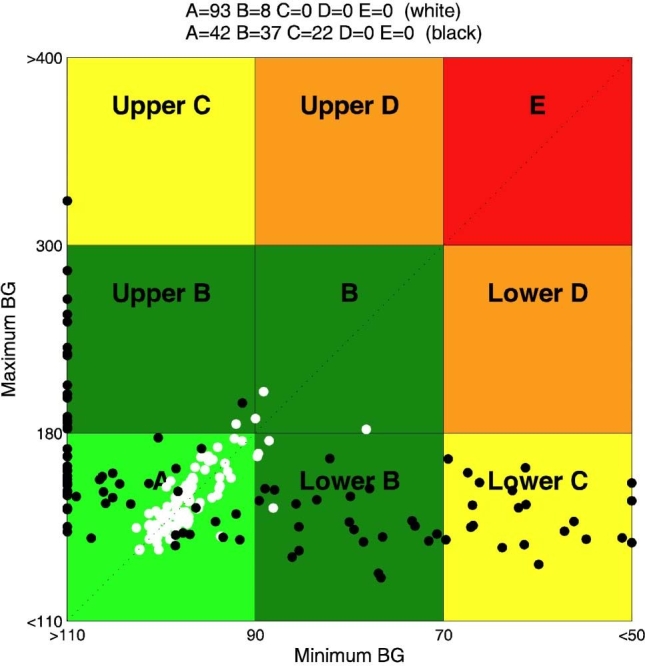
In Figure 3, CVGA of the 100 virtual patients is reported for experiments 1 and 2. It is evident that, in the nominal case (no uncertainty on meals and insulin sensitivity), if the aggressiveness parameter q is not individualized, the open-loop strategy, whose CR was optimized for each subject in order to minimize the distance from the diagonal of the CVGA plot, is better than the closed-loop one. On the contrary, the CVGA for experiment 3 (days 2 and 14), reported in Figure 4, shows that the run-to-run procedure attains a good glycemic regulation and performs better than the open-loop also in the nominal case. However, the advantage of a feedback strategy is even more evident if uncertainties in meal or insulin sensitivity are considered. In particular, in Figure 5, a comparison between experiment 4 (day 15) and experiment 7 is reported. With the same meal uncertainty, closed-loop achieves a better compensation of meal error. Finally, in Figure 6, the robustness of closed-loop MPC with respect to insulin sensitivity change is shown through the comparison between experiment 6 (day 44) and experiment 8.
Figure 3.
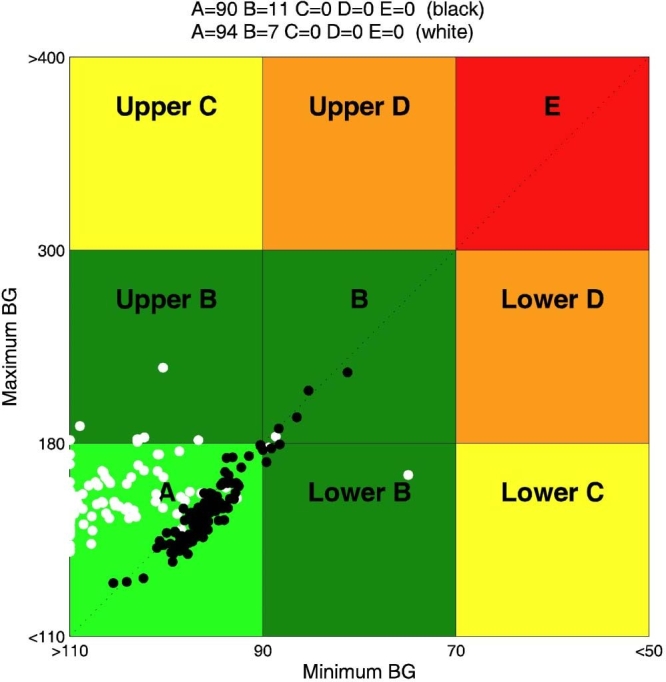
Closed loop versus open loop in nominal condition: CVGA for closed-loop experiment 2 (constant q) (white) and open-loop experiment 1 (black). BG, blood glucose.
Figure 4.
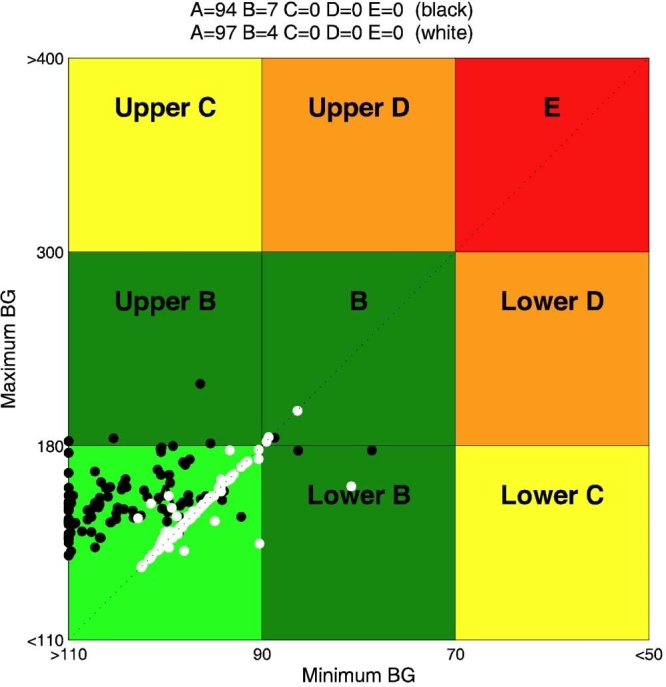
Closed-loop run-to-run tuning: CVGA for experiment 3 (day 2) (black) and experiment 3 (day 14) (white). BG, blood glucose.
Figure 5.
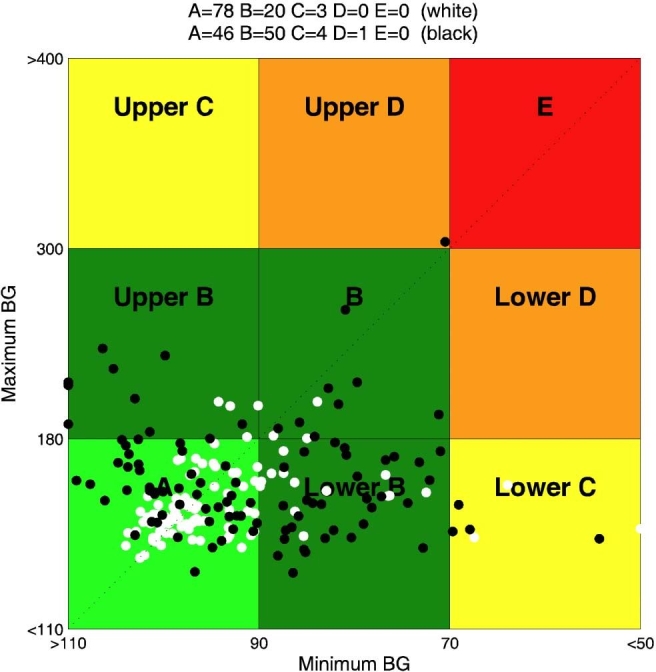
Closed loop versus open loop in the face of meal uncertainty: CVGA for closed-loop experiment 4 (day 15) (white) and open-loop experiment 7 (black). BG, blood glucose.
Figure 6.
Closed loop versus open loop in the face of insulin sensitivity change: CVGA for closed-loop experiment 6 (day 44) (white) and open-loop experiment 8 (black).
Conclusions
In a previous study,7 in silico experiments demonstrated the feasibility of glycemic control by an MPC scheme. On these premises, the MPC controller has been extensively tested on real patients,8 obtaining satisfactory results especially during overnight control. The analysis of these in silico and in vivo trials highlights three major challenges for the future development of the artificial pancreas. First of all, closed-loop control should not compensate meals less promptly than the traditional basal + boluses open-loop therapy. At the same time, a too aggressive regulation may suffer from excessive sensitivity to disturbances and sensor errors, so the correct calibration of controller aggressivity may involve a difficult trade-off. The second challenge has to do with quality of glycemic prediction; in view of interindividual variability, it is difficult to achieve satisfactory predictions using a single model for all patients. Hence the need for individualized models. Finally, another crucial point is the development of automatic tuning strategies that can tailor the regulator parameters to the individual patient and can adapt them in the face of slowly time-varying patient clinical parameters and habits.
In order to face these challenges, in the present article, a new MPC design scheme has been proposed and tested in silico. The closed-loop action is designed on top of traditional open-loop therapy. More precisely, the closed-loop MPC is in charge of correcting an optimized open-loop therapy if glucose levels differ from nominal ones. Individualization of glucose predictions is achieved via ARX models identified in each individual. Finally, a run-to-run procedure is used to tune the controller on a daily basis, showing that not only this approach reaches optimal tuning in nominal conditions, but it is also robust with respect to changes in habits and drift of clinical parameters. Although the ARX modeling approach appears to be very promising, protocols need to be designed so as to collect data that are informative enough for system identification.
Abbreviations
- CGM
continuous glucose monitoring
- CR
carbohydrate ratio
- CVGA
control variability grid analysis
- FHOCP
finite-horizon optimal control problem
- MPC
model predictive control
- T1DM
type 1 diabetes mellitus
References
- 1.Bequette BW. A critical assessment of algorithms and challenges in the development of a closed-loop artificial pancreas. Diabetes Technol Ther. 2005;7(1):28–47. doi: 10.1089/dia.2005.7.28. [DOI] [PubMed] [Google Scholar]
- 2.Hovorka R. Continuous glucose monitoring and closed-loop systems. Diabet Med. 2005;23(1):1–12. doi: 10.1111/j.1464-5491.2005.01672.x. [DOI] [PubMed] [Google Scholar]
- 3.Klonoff DC. The artificial pancreas: how sweet engineering will solve bitter problems. J Diabetes Sci Technol. 2007;1(1):72–81. doi: 10.1177/193229680700100112. [DOI] [PMC free article] [PubMed] [Google Scholar]
- 4.Magni L, Raimondo DM, Allgower F. Vol. 384. Berlin: Springer; 2009. Nonlinear model predictive control: towards new challenging applications. [Google Scholar]
- 5.Dua P, Doyle FJ, III, Pistikopoulos EN. Model-based blood glucose control for type 1 diabetes via parametric programming. IEEE Trans Biomed Eng. 2006;53(8):1478–1491. doi: 10.1109/TBME.2006.878075. [DOI] [PubMed] [Google Scholar]
- 6.Panteleon AE, Loutseiko M, Steil GM, Rebrin K. Evaluation of the effect of gain on the meal response of an automated closed-loop insulin delivery system. Diabetes. 2006;55(7):1995–2000. doi: 10.2337/db05-1346. [DOI] [PubMed] [Google Scholar]
- 7.Magni L, Raimondo DM, Bossi L, Dalla Man C, De Nicolao G, Kovatchev B, Cobelli C. Model predictive control of type 1 diabetes: an in silico trial. J Diabetes Sci Technol. 2007;1(6):804–812. doi: 10.1177/193229680700100603. [DOI] [PMC free article] [PubMed] [Google Scholar]
- 8.Kovatchev B, Anderson S, Breton M, Patek S, Clarke W, Bruttomesso D, Maran A, Costa S, Avogaro A, Dalla Man C, Facchinetti A, Guerra S, Magni L, Raimondo DM, De Nicolao G, Renard E, Cobelli C. Personalized subcutaneous model-predictive closed-loop control of type 1 diabetes: in silico design and human studies in the United States, Italy, and France. American Diabetes Association 68th Scientific Sessions; June 5–9, 2009; New Orleans. [Google Scholar]
- 9.Bruttomesso D, Farret A, Costa S, Marescotti MC, Vettore M, Avogaro A, Tiengo A, Dalla Man C, Place J, Facchinetti A, Guerra S, Magni L, De Nicolao G, Cobelli C, Renard E, Maran A. Closed-loop artificial pancreas using subcutaneous glucose sensing and insulin delivery and a model predictive control algorithm: preliminary studies in Padova and Montpellier. J Diabetes Sci Technol. 2009;3(5):1014–1021. doi: 10.1177/193229680900300504. [DOI] [PMC free article] [PubMed] [Google Scholar]
- 10.Clarke WL, Anderson S, Breton M, Patek S, Kashmer L, Kovatchev B. Closed-loop artificial pancreas using subcutaneous glucose sensing and insulin delivery and a model predictive control algorithm: the Virginia experience. J Diabetes Sci Technol. 2009;3(5):1031–1038. doi: 10.1177/193229680900300506. [DOI] [PMC free article] [PubMed] [Google Scholar]
- 11.Zisser H, Jovanovic L, Doyle F, III, Ospina P, Owens C. Run-to-run control of meal-related insulin dosing. Diabetes Technol Ther. 2005;7(1):48–57. doi: 10.1089/dia.2005.7.48. [DOI] [PubMed] [Google Scholar]
- 12.Owens C, Zisser H, Jovanovic L, Srinivasan B, Bonvin D, Doyle F., III Run-to-run control of blood glucose concentrations for people with type 1 diabetes mellitus. IEEE Trans Biomed Eng. 2006;53(6):996–1005. doi: 10.1109/TBME.2006.872818. [DOI] [PubMed] [Google Scholar]
- 13.Palerm CC, Zisser H, Jovanovic L, Doyle F., III A run-to-run framework for prandial insulin dosing: handling real-life uncertainty. Int J Robust Nonlin. 2007;17(13):1194–1213. [Google Scholar]
- 14.Palerm CC, Zisser H, Jovanovič L, Doyle FJ. A run-to-run control strategy to adjust basal insulin infusion rates in type 1 diabetes. J Process Control. 2008;18(3–4):258–265. doi: 10.1016/j.jprocont.2007.07.010. [DOI] [PMC free article] [PubMed] [Google Scholar]
- 15.Dalla Man C, Rizza RA, Cobelli C. Meal simulation model of the glucose-insulin system. IEEE Trans Biomed Eng. 2007;54(10):1740–1749. doi: 10.1109/TBME.2007.893506. [DOI] [PubMed] [Google Scholar]
- 16.Dalla Man C, Raimondo DM, Rizza RA, Cobelli C. GIM, simulation software of meal glucose-insulin model. J Diabetes Sci Technol. 2007;1(3):323–330. doi: 10.1177/193229680700100303. [DOI] [PMC free article] [PubMed] [Google Scholar]
- 17.Kovatchev BP, Breton M, Man CD, Cobelli C. In silico preclinical trials: a proof of concept in closed-loop control of type 1 diabetes. J Diabetes Sci Technol. 2009;3(1):44–55. doi: 10.1177/193229680900300106. [DOI] [PMC free article] [PubMed] [Google Scholar]
- 18.Dalla Man C, Breton M, Kovatchev B, Cobelli C. In silico pre clinical trials of artificial pancreas: the glucose-insulin model of type 1 diabetes. Proceedings of the Advanced Technologies and Treatments for Diabetes Conference. 2009 [Google Scholar]
- 19.Kovatchev BP, Clarke WL, Breton M, Brayman K, McCall A. Quantifying temporal glucose variability in diabetes via continuous glucose monitoring: mathematical methods and clinical application. Diabetes Technol Ther. 2005;7(6):849–862. doi: 10.1089/dia.2005.7.849. [DOI] [PubMed] [Google Scholar]
- 20.Magni L, Raimondo DM, Dalla Man C, Breton M, Patek S, De Nicolao G, Cobelli C, Kovatchev B. Evaluating the efficacy of closed-loop glucose regulation via control-variability grid analysis (CVGA) J Diabetes Sci Technol. 2008;2(4):630–635. doi: 10.1177/193229680800200414. [DOI] [PMC free article] [PubMed] [Google Scholar]
- 21.Clarke WL, Cox D, Gonder-Frederick LA, Carter W, Pohl SL. Evaluating clinical accuracy of systems for self-monitoring of blood glucose. Diabetes Care. 1987;10(5):622–628. doi: 10.2337/diacare.10.5.622. [DOI] [PubMed] [Google Scholar]
- 22.Kovatchev BP, Gonder-Frederick LA, Cox DJ, Clarke WL. Evaluating the accuracy of continuous glucose-monitoring sensors: continuous glucose-error grid analysis illustrated by TheraSense Freestyle Navigator data. Diabetes Care. 2004;27(8):1922–1928. doi: 10.2337/diacare.27.8.1922. [DOI] [PubMed] [Google Scholar]
- 23.Lee H, Bequette BW. A closed-loop artificial pancreas based on model predictive control: Human friendly identification and automatic meal disturbance rejection. Biomed Signal Process Control. In press 2009. Available in http://www.sciencedirect.com/science?_ob=PublicationURL&_tockey=%23TOC%2329675%239999%23999999999%2399999%23FLA%23&_cdi=29675&_pubType=J&_auth=y&_acct=C000050221&_version=1&_urlVersion=0&_userid=10&md5=5e39df18bf4a272866e682b94727d6ae.
- 24.Ljung L. Natick: The MathWorks, Inc.; 1998–2004. System identification toolbox user's guide. [Google Scholar]