Abstract
Motivation
Most current insulin pumps include an insulin-on-board (IOB) feature to help subjects avoid problems associated with “insulin stacking.” In addition, many control algorithms proposed for a closed-loop artificial pancreas make use of IOB to reduce the probability of hypoglycemic events that often occur due to the integral action of the controller. The IOB curves are generated from the pharmacodynamic (time-activity profiles) actions of subcutaneous insulin, which are obtained from glycemic clamp studies.
Methods
Glycemic clamp algorithms are reviewed and in silico studies are performed to analyze the effect of glucose meter bias and noise on glycemic control and the manipulated glucose infusion rates. The glucose infusion rates are used to obtain insulin time-activity profiles, which are then used to generate IOB curves.
Results
A model-based, three-step-ahead controller is shown to be equivalent to a proportional-integral control algorithm with time-delay compensation. A systematic glucose meter bias of +6 mg/dl results in a decrease in the glucose area under the curve of 3% but no change in the IOB profiles.
Conclusions
Based on these preliminary simulation studies, a substantial amount of glucose meter bias and noise during a glycemic clamp can be tolerated with little net effect on the IOB curves. It is suggested that handheld glucose meters can therefore be used in clamp studies if the measurements are filtered (averaged) before processing by the control algorithm. Clinical studies are needed to confirm these preliminary results.
Keywords: glycemic clamp, in silico model, insulin on board, insulin pharmacodynamics
Motivation and Context
Many control algorithms proposed for a closed-loop artificial pancreas make use of insulin-on-board (IOB) information that accounts for the insulin time-action profile (subcutaneous insulin pharmacodynamics).1,2 Indeed, most insulin pumps also have an IOB feature to prevent the effect of “insulin stacking,” where previously infused insulin still has an effect on future glucose values.3,4 Subcutaneous insulin pharmacodynamic models are usually based on glycemic clamp studies, where intravenous glucose is delivered to maintain constant blood glucose concentration in response to an insulin bolus.
One of the goals of this article is to provide a concise review of glycemic clamp protocols (control algorithms) and to show via simulation studies the effect of glucose measurement delay and uncertainty on glycemic control. Another goal is to analyze the effect of glycemic clamp variability, possibly due to the use of handheld glucose meters, on IOB calculations.
Background
Euglycemic glucose clamps are the standard method for determining insulin pharmacokinetics and pharmaco-dynamic behavior.5 A bolus of insulin is usually given subcutaneously (0.2 U/kg is typical), and glucose is infused intravenously to maintain a constant glucose concentration. The rate of glucose infusion is then used as a measure of insulin action; glucose infusion is usually scaled by the subject's weight and presented with units of mg/kg/min.
The glucose clamp technique was originally developed based on steady-state intravenous insulin infusion and adjustment of the glucose infusion rate to maintain a constant glucose concentration. The components required include a method to take blood glucose samples, a blood glucose analyzer, and a glucose infusion pump. DeFronzo and colleagues6 give a thorough overview of the glucose clamp technique, including a method to correct the glucose infusion rate to compensate for changes in glucose concentration (“space correction”) and urinary loss. They also provide an algorithm for the real-time adjustment of the glucose infusion rate to maintain constant blood glucose concentrations. Insel and associates7 use clamp studies to estimate parameters for a three-compartment model of insulin and glucose dynamics.
Clemens and coworkers8 present the glucose clamping algorithm used by the Biostator, which was originally developed as a bedside or clinical closed-loop artificial pancreas.9–11 The Biostator uses an automated glucose sampling and analysis device to provide glucose concentrations every minute and to adjust the glucose infusion rates every minute. The glucose clamping (control) algorithm appears to be linear, whereas the Biostator artificial pancreas algorithm (where insulin infusion is manipulated) is nonlinear.
Ponchner and colleagues12 compare the performance of the Biostator glucose clamping algorithm with the manual algorithm of Reference 6 and conclude that the manual algorithm is simpler and yields better performance. The Biostator algorithm that they present, however, appears similar to the nonlinear algorithm used to infuse insulin in the artificial pancreas version of the Biostator. It is fairly clear that Ponchner and colleagues12 were not comfortable with the frequent calibration and tuning involved with the Biostator and felt that the manual method was clearer to use. Based on my reading of the Biostator literature, I must agree with them. In my view, a properly designed and implemented closed-loop glucose infusion algorithm should always have better performance than the manual method.
Palazzo and Viti13 simulate the behavior of proportional-integral (PI) controllers applied to the two-state Bergman minimal model;14 they present tuning parameters as a function of Bergman model parameters. Campostano and associates15 implement the proposed Palazzo and Viti tuning parameters based on estimates of the patient's sensitivity. Four clinical subjects were studied using a euglycemic clamp, while hyperglycemic clamps were applied to 14 subjects.
The glucose clamping algorithms and studies by DeFronzo and coworkers,6 Clemens and colleagues,8 and Ponchner and associates12 are based on steady-state insulin sensitivity analysis. That is, intravenous insulin is infused at a constant rate, and intravenous glucose infusion is used to control glucose concentration to a desired setpoint. Certainly, by the end of the experiment, the glucose concentration is held relatively constant. The glucose clamps used in subcutaneous insulin bolus pharmacokinetic–pharmacodynamic (PKPD) studies, however, are inherently dynamic in nature. Manual clamps, in particular, can result in significant perturbations of the glucose concentration from desired values (setpoints), and the glucose infusion rates should be corrected to estimate the actual rate of glucose metabolized. Few PKPD articles provide significant detail on the mathematical algorithms used to correct the glucose infusion rate. Most of the subcutaneous insulin pharmacodynamic studies published by Heinemann and colleagues16–19 are based on the use of the Biostator, where presumably the glucose is controlled tightly enough that no glucose infusion rate compensation (“space correction”) is necessary. Most other authors appear to use a manual clamping technique, where it is expected that glucose concentration will vary significantly.
Furler and coworkers20 present what they call a proportional-derivative controller since the difference between two successive glucose values is used in the algorithm. The resulting controller, however, is a PI controller, as is shown in this article.
Glucose clamp protocols usually use a laboratory-quality glucose measurement device, such as the YSI (Yellow Springs Instrument) glucose oxidase analyzer. Cohen and colleagues21 conclude that the FreeStyle Mini glucose meter is accurate enough for glucose clamp studies, based on clamp procedures conducted on seven volunteers with type 2 diabetes. Hompesch and Rave,22 however, argue that the systematic bias of 6% would result in substantial underestimation or overestimation of glucose requirements; in addition, the bias would hamper the comparison of the absolute amount of glucose infused between different studies.
In this article, a simple model of glucose dynamics is used to develop a model-based glycemic clamp protocol (control algorithm). Then I examine the effect of glucose measurement uncertainty (bias and noise) on glucose control during euglycemic clamps and on the resulting time-action profiles and IOB curves; these studies are based on the use of a simulation model, which is of much higher complexity than the model used for controller design, in keeping with the consensus of a meeting summarized by Steil and Reifman.23
Simplified Model Development
A simple model relating glucose infusion to glucose concentration is
| (1) |
where VG represents the volume of the glucose compartment per unit weight of the subject (liters/kg), G represents the glucose concentration (mg/dl), and GIR is the glucose infusion rate (mg/kg/min). Gup represents the rate of glucose uptake from the glucose compartment (mg/kg/min) due to the action of insulin delivered. It should be noted that this simplified model neglects any endogenous appearance of glucose from the liver and/or kidneys. This simplified model will be used to design a glucose clamp algorithm in the next section and is not meant to provide the level of insulin–glucose dynamics that would be needed to design an artificial pancreas.
When discretized, Equation (1) is
| (2) |
where subscript k represents the beginning of the kth sample interval. This can also be written as
| (3) |
which represents an exact integration of Equation (1) under the assumption that the glucose infusion and uptake rates are constant over the sample time. Now consider a desire to reach the glucose setpoint in N sample times. The discretization of Equation (1) for N sample times in the future is
| (4) |
which, again, is exact under the limiting assumption that the glucose infusion and uptake rates are constant over the N sample times into the future.
Model-Based Controller Development
Here we use the simple model of glucose dynamics as a basis for controller design. While there are many different possible model-based controller design techniques, we develop one with a goal of reaching the setpoint at step k + N (that is, N sample times in the future) by making a change in the glucose infusion rate and holding it constant over the N sample times. Substituting Gsp for Gk+N, we can solve for the required uptake rate at step k as
| (5) |
where ∧ is the estimate of the uptake rate since it is not known. The uptake rate at the previous step can be estimated from the most recent glucose measurements (at steps k and k − 1),
| (6) |
if it is assumed that the uptake rate remains constant over the next N time steps. Substituting Equation (6) into Equation (5), we find
| (7) |
Recognizing that the difference between the desired setpoint and the glucose measurement is the error,
| (8) |
we can rewrite Equation (7) as
| (9) |
It should be noted that the discrete velocity form of a PI controller24 is
| (10) |
where uk is the insulin infusion rate at time k; kc and τI are two adjustable (tuning) parameters, the controller gain and integral time, respectively; and Δt is the sample time. Notice then that Equation (9) represents a PI controller, with
| (11) |
The glucose compartment volume is typically in the range of VG = 1 to 2 dl/kg. If VG is not known exactly, then tuning kc is roughly equivalent to estimating VG.
Glucose Measurement Delay
There is typically a delay of 2–4 min between the glucose sample and the availability of the glucose measurement. When the glucose sample time is 5 min, it is important to compensate for this delay. The glucose infusion rates used in Equations (7) and (9) are the average over the sample interval, thus, to be more precise, we write Equation (7) as
| (12) |
and we recognize that the average infusion rate over the interval from k − 1 to k is
| (13) |
where td is the sample delay (the amount of time it takes before the glucose measurement at sample k is provided to the controller). Also, once is calculated, then the infusion rate starting at kΔt + td is
| (14) |
so the new infusion rate, written in terms of the previous infusion rates, is
| (15) |
which is virtually the algorithm proposed by Furler and colleagues20 written as
| (16) |
where clearly the kp term is the N-step-ahead term that we have used. Furler and colleagues20 suggest kp = 3, which results in a controller that exactly achieves the setpoint in three steps. Also, they suggest using kd = 1 at the beginning of the clamp, then switching to kd = 2 after 30 min to reduce the effect of noise and uncertainty. It should be noted that Furler and colleagues refer to their algorithm as proportional-derivative since a difference in two successive values of glucose is used; while this is a common misconception, the algorithm is actually the “velocity form” of a PI controller.
Measurement Noise Filtering
When there is substantial glucose measurement noise, it is important to include a “filter” to reduce the effect of the noise on the control computation. A simple averaging filter has the form
| (17) |
where the superscript f indicates the filtered glucose value. This filtered value can be substituted into the previous equations to reduce the effect of sensor noise. If a continuous-time filter time constant, τf, is used, it can be implemented in discrete form as
| (18) |
Note that a smaller value of a (smaller value of τf) results in less filtering.
Time-Activity Profiles and Insulin-on-Board Computations
The rate that glucose is metabolized is a function of the glucose infusion rate, the rate of glucose lost through the urine, and the amount that enters/leaves and raises/lowers the glucose concentration in the glucose compartment.6 In the studies that follow, we neglect the amount lost to the urine since a typical rate is less than 0.2 mg/kg/min, as reported by DeFronzo and associates.6
The average glucose uptake during the kth time interval is computed by
| (19) |
where the rightmost term represents the “space correction”6 to account for the portion of glucose infused that increases the glucose concentration. For a retrospective analysis of the glucose infusion rates to calculate IOB (duration of action) plots, the glucose infusion rates are averaged over 10 min intervals.
The fractional insulin activity remaining (IOB) is calculated by
| (20) |
and is typically plotted over a 6–8 h time period.
Simulation Model and Protocol
The simulation model for insulin glucose dynamics used in our in silico studies is based on the compartmental model by Hovorka coworkers,25 with a revised subcutaneous insulin kinetic model by Wilinska and associates;26 there are a total of nine differential equations in this model. We have reduced the published insulin sensitivities by 50% to better reflect match the basal insulin and carbohydrate-to-insulin ratios of typical adults.27 In this simulation protocol, we start with the subject at a constant steady-state glucose concentration of 100 mg/dl, based on a constant basal infusion of insulin. The subject is then given a subcutaneous insulin bolus of 0.2 U/kg, and glucose is manipulated to maintain glucose concentration at the desired setpoint value of 100 mg/dl.
Feedback Control of Glucose Concentration
Continuous versus Discrete Control Performance
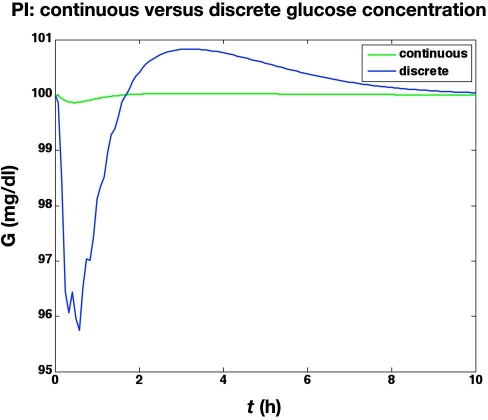
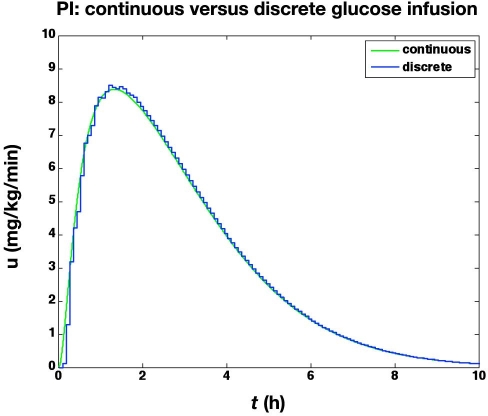
We first compare the results of two different clamps. The first is based on a continuous adjustment of glucose infusion rates using continuous, noise-free glucose sensor values. The second is based on sampling glucose at 5 min intervals, with a 2 min time delay to report the glucose values to the controller; glucose measurement uncertainty and resolution are neglected. Although the discrete controller does not maintain as tight regulation of glucose as the continuous controller, as shown in Figure 1, the resulting glucose infusion rates are nearly identical, except for the first 10 min, as shown in Figure 2.
Figure 1.
Blood glucose values from the simulated glycemic clamp procedure. Comparison of (i) continuous and (ii) discrete controllers with no measurement noise (the discrete controller has a sample delay of 2 min).
Figure 2.
The glucose infusion rates (mg/kg/min) from the glucose clamp shown in Figure 1.
Effect of Measurement and Pump Resolution and Measurement Noise on Glucose Control
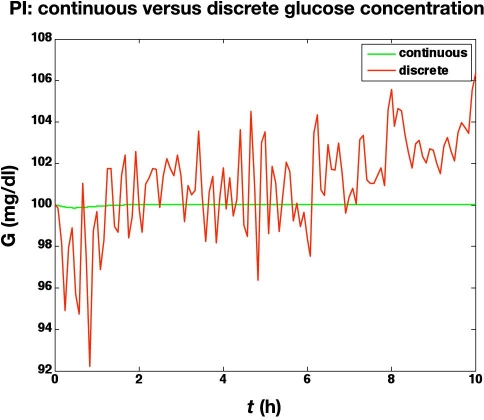
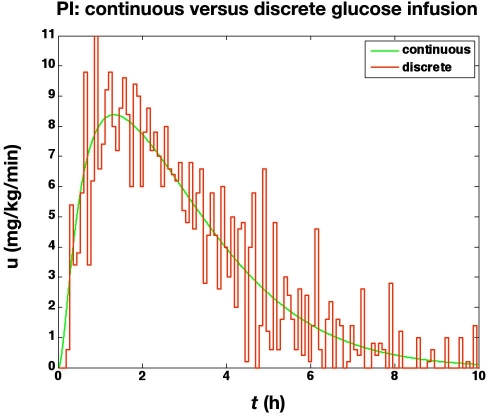
In the second study, we assume measurement noise with a mean of 0 and a standard deviation of 1 mg/dl, with integer reporting of glucose values. Further, a glucose infusion pump threshold resolution of 0.1 mg/kg/min is used. The actual glucose values (uncorrupted by noise and delay) are shown in Figure 3. The noise and finite resolution of the sensor and pump lead to much more active glucose infusion rates, as shown in Figure 4.
Figure 3.
Glucose values from the simulated glycemic clamp procedure. Comparison of a continuous (and noise-free) PI controller with a discrete PI controller with measurement noise (standard deviation of 1 mg/dl), measurement (integer values, mg/dl) and pump finite resolution (0.1 mg/kg/min), and a sample delay of 2 min.
Figure 4.
The glucose infusion rates (mg/kg/min) from the glucose clamp shown in Figure 3.
Effect of Blood Glucose Meter Bias
The previous simulations were pertinent to the use of a YSI glucose measurement, which we assumed to have no bias, and a measurement standard deviation of 1 mg/dl (1% in the range of our measurements). Now we consider the use of blood glucose meters, which can have significant uncertainty, including bias. The study results of Cohen and colleagues21 and the related critique by Hompesch and Rave22 indicate that a glucose meter may have a bias of +6 mg/dl (6% in our range of measurements), with a standard deviation of 5 mg/dl (5% in our range of measurements).
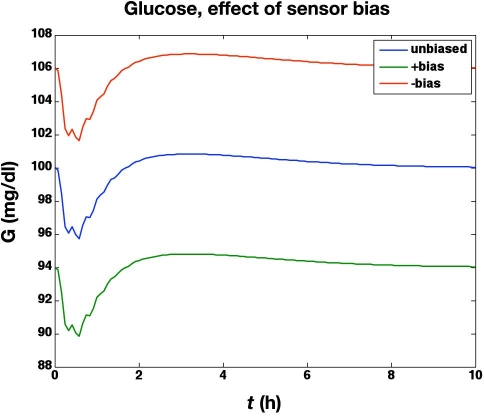
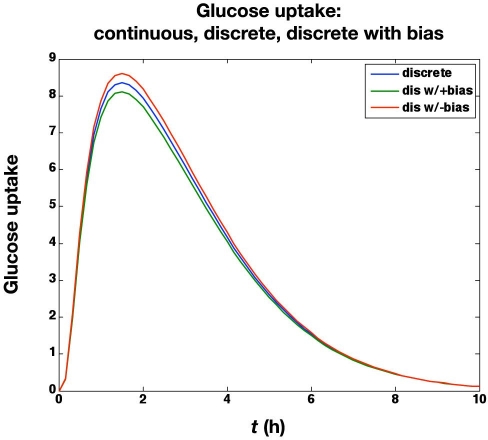
In the next set of simulations, we study the effect of a systematic glucose meter bias of ±6 mg/dl. The meter bias clearly results in an “offset” for the actual glucose concentrations, as shown in Figure 5, since the controller is regulating the glucose concentration to 100 mg/dl based on the glucose meter readings. The corresponding glucose uptake rates (based on the glucose infusion rates and the “space correction”) are shown in Figure 6. As suggested by Hompesch and Rave,22 the biased values do result in slightly different areas under the glucose uptake cures. For the unbiased meter the area under the curve (AUC) = 1.915 g; for the +6 mg/dl bias,the AUC = 1.859 g; and for the −6 mg/dl bias, the AUC = 1.970 g. Thus a meter bias of 6 mg/dl (6%) results in AUC estimates that are in error by 3%. There is no effect of glucose meter bias on the IOB curves, however.
Figure 5.
Effect of glucose meter bias (±6 mg/dl) on actual blood glucose concentrations during a euglycemic clamp. Since the controller is regulating glucose to a set point of 100 mg/dl based on the glucose meter readings, +6 and −6 mg/dl biases result in actual glucose values of 94 and 106 mg/dl, respectively.
Figure 6.
Effect of glucose meter bias (± 6 mg/dl) on the glucose uptake rate (mg/kg/min).
Effect of Substantial Measurement Noise
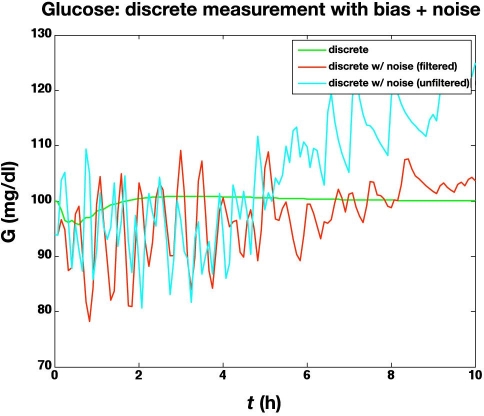
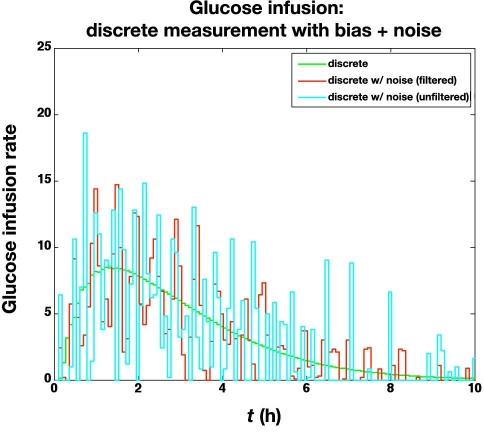
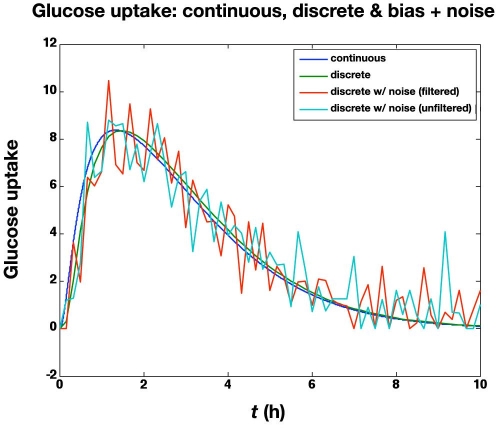
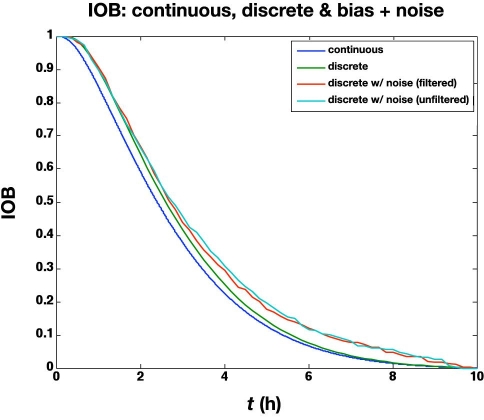
The previous subsection illustrated the effect of glucose measurement bias. Here we study the effect of a standard deviation of 5 mg/dl in the glucose meter values, in addition to a bias of +6 mg/dl. The large glucose meter noise (with bias) causes the actual glucose to vary substantially from the setpoint (100 mg/dl), as shown in Figure 7. The corresponding glucose infusion rates are shown in Figure 8, where the simple measurement filter (a = 0.5) reduces the variability in the glucose infusion rates. The time-activity profiles are compared in Figure 9; even with the “space correction” for glucose variability and the averaging over 10 min periods, there is substantial variation in the profiles due to sensor noise. On the other hand, this “noise” is smoothed by the process of integration used in the IOB computations, as shown in Figure 10.
Figure 7.
Comparison of glucose concentrations for the following controllers: discrete (with no noise) and discrete with bias and substantial noise (filtered and unfiltered measurements). The actual glucose concentrations are plotted.
Figure 8.
Comparison of glucose infusion rates (mg/kg/min) for the following controllers: discrete (with no noise) and discrete with bias and substantial noise (control algorithm based on filtered and unfiltered measurements).
Figure 9.
Comparison of time-action profiles (glucose uptake rate, mg/kg/min) for continuous, discrete (no noise), and discrete with bias (+6 mg/dl) and substantial noise (standard deviation = 5 mg/dl; filtered and unfiltered).
Figure 10.
Comparison of IOB profiles for the results in Figure 9.
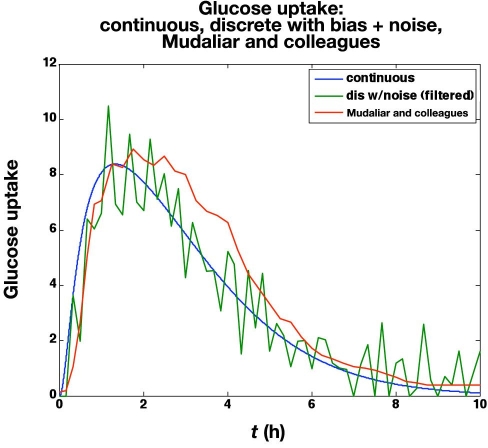
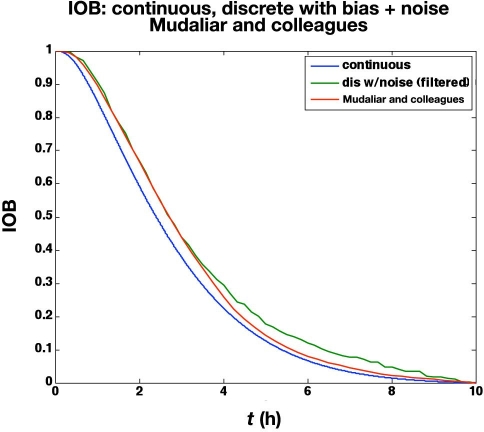
Mudaliar and associates28 use a manual clamp to compare insulin aspart and regular human insulin using three injection sites (abdomen, deltoid, and thigh) on 20 healthy male subjects with average characteristics of 31.1 years of age and a body mass index of 23.6 kg/m2.The time-action profiles from their abdomen studies using aspart are compared with the in silico noisy (but filtered)data in Figure 11. Naturally, the averaging effect over 20 subjects makes the glucose uptake rate curves much smoother than a single simulated subject with high measurement noise. The IOB curves are very similar, however, as shown in Figure 12, since the integration in Equation (20) naturally smoothes the data.
Figure 11.
Comparison of time-action profiles (glucose uptake rate, mg/kg/min) for continuous, discrete with bias (+6 mg/dl) and substantial noise (standard deviation = 5 mg/dl; filtered), and the curve published by Mudaliar and colleagues28 (scaled by 75 kg).
Figure 12.
Comparison of IOB curves for the time-action profiles in Figure 11.
It is important to note that not all insulin pumps use IOB curves that have the characteristic shown in Figures 10 and 12. The Deltec and Insulet pumps, for example, use linear approximations to these curves. In addition, all pumps have a “duration of insulin action” parameters to allow the user to adjust the rate of decrease in insulin activity. A review of these basic pump features is provided by Zisser and coworkers.4
Conclusions
A simple model-based glucose controller has the form of a PI controller with time-delay compensation. Even relatively noisy glucose meters with bias can result in reasonable glucose control and glucose infusion rates as long as the noisy measurements are filtered (averaged) before using them in the control algorithm. While biased measurements do have a minor effect on the area under the glucose uptake curves, there is no effect on the IOB curves that are used in smart insulin pumps and many proposed closed-loop artificial pancreas control algorithms.
Abbreviations
- AUC
area under the curve
- IOB
insulin on board
- PI
proportional integral
- PKPD
pharmacokinetic–pharmacodynamic
References
- 1.Ellingsen C, Dassau E, Zisser H, Grosman B, Percival MW, Jovanovič L, Doyle FJ., III Safety constraints in an artificial pancreatic β cell: an implementation of model predictive control with insulin on board. J Diabetes Sci Technol. 2009;3(3):536–544. doi: 10.1177/193229680900300319. [DOI] [PMC free article] [PubMed] [Google Scholar]
- 2.Lee H, Buckingham BA, Bequette BW. An insulin-on-board formulation of a proportional-integral-derivative controller for a closed-loop artificial pancreas. J Diabetes Sci Technol. 2009;3(2):A101. [Google Scholar]
- 3.Walsh J, Roberts R. 4th ed. San Diego: Torrey Pines Press; 2006. Pumping insulin. [Google Scholar]
- 4.Zisser H, Robinson L, Bevier W, Dassau E, Ellingsen C, Doyle FJ, Jovanovic L. Bolus calculator: a review of four “smart” insulin pumps. Diabetes Technol Ther. 2008;10(6):441–444. doi: 10.1089/dia.2007.0284. [DOI] [PubMed] [Google Scholar]
- 5.Heinemann L. Mainz: Verlag Kirchheim; 2004. Time-action profiles of insulin preparations. http://www.profil-research.de/downloads/publikationen/buch.pdf. [Google Scholar]
- 6.DeFronzo RA, Tobin JD, Andres R. Glucose clamp technique: a method for quantifying insulin secretion and resistance. Am J Physiol. 1979;237(3):E214–E223. doi: 10.1152/ajpendo.1979.237.3.E214. [DOI] [PubMed] [Google Scholar]
- 7.Insel PA, Liljenquist JE, Tobin JD, Sherwin RS, Watkins P, Andres R, Berman M. Insulin control of glucose metabolism in man: a new kinetic analysis. J Clin Invest. 1975;55(5):1057–1066. doi: 10.1172/JCI108006. [DOI] [PMC free article] [PubMed] [Google Scholar]
- 8.Clemens AH, Hough DL, D'Orazio PA. Development of the Biostator glucose clamping algorithm. Clin Chem. 1982;28(9):1899–1904. [PubMed] [Google Scholar]
- 9.Albisser AM, Leibel BS, Ewart TG, Davidovac Z, Botz CK, Zingg W. An artificial endocrine pancreas. Diabetes. 1974;23(5):389–396. doi: 10.2337/diab.23.5.389. [DOI] [PubMed] [Google Scholar]
- 10.Albisser AM, Leibel BS, Ewart TG, Davidovac Z, Botz CK, Zingg W, Schipper H, Gander R. Clinical control of diabetes by the artificial pancreas. Diabetes. 1974;23(5):397–404. doi: 10.2337/diab.23.5.397. [DOI] [PubMed] [Google Scholar]
- 11.Clemens AH. Feedback control dynamics for glucose controlled insulin infusion systems. Med Prog Technol. 1979;6(3):91–98. [PubMed] [Google Scholar]
- 12.Ponchner M, Heine RJ, Pernet A, Hanning I, Francis AJ, Cook D, Orskov H, Alberti KG. A comparison of the artificial pancreas (glucose controlled insulin infusion system) and a manual technique for assessing insulin sensitivity during euglycaemic clamping. Diabetologia. 1984;26(6):420–425. doi: 10.1007/BF00262213. [DOI] [PubMed] [Google Scholar]
- 13.Palazzo P, Viti V. A new glucose-clamp algorithm—theoretical considerations and computer simulations. IEEE Trans Biomed Eng. 1990;37(5):535–543. doi: 10.1109/10.55645. [DOI] [PubMed] [Google Scholar]
- 14.Bergman RN, Ider YZ, Bowden CR, Cobelli C. Quantitative estimation of insulin sensitivity. Am J Physiol. 1979;236(6):E667–E677. doi: 10.1152/ajpendo.1979.236.6.E667. [DOI] [PubMed] [Google Scholar]
- 15.Campostano A, Altomonte F, Bessarione D, Casu M, Triolo A, Lamedica G. A new glucose clamp algorithm: clinical validation. Int J Artif Organs. 1991;14(7):441–447. [PubMed] [Google Scholar]
- 16.Heinemann L, Weyer C, Rauhaus M, Heinrichs S, Heise T. Variability of the metabolic effect of soluble insulin and the rapid-acting insulin analog insulin aspart. Diabetes Care. 1998;21(11):1910–1914. doi: 10.2337/diacare.21.11.1910. [DOI] [PubMed] [Google Scholar]
- 17.Heise T, Weyer C, Serwas A, Heinrichs S, Osinga J, Roach P, Woodworth J, Gudat U, Heinemann L. Time-action profiles of novel premixed preparations of insulin lispro and NPL insulin. Diabetes Care. 1998;21(5):800–803. doi: 10.2337/diacare.21.5.800. [DOI] [PubMed] [Google Scholar]
- 18.Heise T, Nosek L, Spitzer H, Heinemann L, Niemöller E, Frick AD, Becker RH. Insulin glulisine: a faster onset of action compared with insulin lispro. Diabetes Obes Metab. 2007;9(5):746–753. doi: 10.1111/j.1463-1326.2007.00746.x. [DOI] [PubMed] [Google Scholar]
- 19.Heise T, Eckers U, Kanc K, Nielsen JN, Nosek L. The pharmacokinetic and pharmacodynamic properties of different formulations of biphasic insulin aspart: a randomized, glucose clamp, crossover study. Diabetes Technol Ther. 2008;10(6):479–485. doi: 10.1089/dia.2008.0019. [DOI] [PubMed] [Google Scholar]
- 20.Furler SM, Zelenka GS, Kraegen EW. Development and testing of a simple algorithm for a glucose clamp. Med Biol Eng Comput. 1986;24(4):365–370. doi: 10.1007/BF02442689. [DOI] [PubMed] [Google Scholar]
- 21.Cohen O, Shaklai S, Gabis E, Pani MA. Freestyle MiniTM blood glucose results are accurate and suitable for use in glycemic clamp protocols. J Diabetes Sci Technol. 2008;2(5):890–895. doi: 10.1177/193229680800200521. [DOI] [PMC free article] [PubMed] [Google Scholar]
- 22.Hompesch M, Rave K. An analysis of how to measure glucose during glucose clamps: are glucose meters ready for research? J Diabetes Sci Technol. 2008;2(5):896–898. doi: 10.1177/193229680800200522. [DOI] [PMC free article] [PubMed] [Google Scholar]
- 23.Steil GM, Reifman J. Mathematical modeling research to support the development of automated insulin-delivery systems. J Diabetes Sci Technol. 2009;3(2):388–395. doi: 10.1177/193229680900300223. [DOI] [PMC free article] [PubMed] [Google Scholar]
- 24.Bequette BW. Upper Saddle River: Prentice Hall; 2003. Process control: modeling, design and simulation. [Google Scholar]
- 25.Hovorka R, Canonico V, Chassin LJ, Haueter U, Massi-Benedetti M, Federici MO, Pieber TR, Schaller HC, Schaupp L, Vering T, Wilinska ME. Nonlinear model predictive control of glucose concentration in subjects with type 1 diabetes. Physiol Meas. 2004;25(4):905–920. doi: 10.1088/0967-3334/25/4/010. [DOI] [PubMed] [Google Scholar]
- 26.Wilinska ME, Chassin LJ, Schaller HC, Schaupp L, Pieber TR, Hovorka R. Insulin kinetics in type-1 diabetes: continuous and bolus delivery of rapid acting insulin. IEEE Trans Biomed Eng. 2005;52(1):3–12. doi: 10.1109/TBME.2004.839639. [DOI] [PubMed] [Google Scholar]
- 27.Lee H, Bequette BW. A closed-loop artificial pancreas based on model predictive control: Human friendly identification and automatic meal disturbance rejection. Biomed Signal Process Control. (To be published.) [Google Scholar]
- 28.Mudaliar SR, Lindberg FA, Joyce M, Beerdsen P, Strange P, Lin A, Henry RR. Insulin aspart (B28 asp-insulin): a fast-acting analog of human insulin: absorption kinetics and action profile compared with regular human insulin in healthy nondiabetic subjects. Diabetes Care. 1999;22(9):1501–1506. doi: 10.2337/diacare.22.9.1501. [DOI] [PubMed] [Google Scholar]


