

Abstract
The objective of this article is to present a comprehensive strategy for a closed-loop artificial pancreas. A meal detection and meal size estimation algorithm is developed for situations in which the subject forgets to provide a meal insulin bolus. A pharmacodynamic model of insulin action is used to provide insulin-on-board constraints to explicitly include the future effect of past and currently delivered insulin boluses. In addition, a supervisory pump shut-off feature is presented to avoid hypoglycemia. All of these components are used in conjunction with a feedback control algorithm using model predictive control (MPC). A model for MPC is developed based on a study of 20 subjects and is tested in a hypothetical clinical trial of 100 adolescent and 100 adult subjects using a Food and Drug Administration-approved diabetic subject simulator. In addition, a performance comparison of previously and newly proposed meal size estimation algorithms using 200 in silico subjects is presented. Using the new meal size estimation algorithm, the integrated artificial pancreas system yielded a daily mean glucose of 138 and 132 mg/dl for adolescents and adults, respectively, which is a substantial improvement over the MPC-only case, which yielded 159 and 145 mg/dl.
Keywords: artificial pancreas, closed-loop glucose control, continuous glucose monitoring, type 1 diabetes
Introduction
The development of a closed-loop artificial pancreas has been an active research area for almost 50 years; for reviews of challenges and techniques, see Bequette1 and Hovorka.2 Some of the earliest work involved intravenous delivery of insulin and frequent sampling of the bloodstream,3 which do not have the time lags of subcutaneous insulin (input) and interstitial glucose (output). Recent model-based approaches for subcutaneous delivery are provided elsewhere.4–7
A major challenge with the use of subcutaneous insulin is delayed insulin action, as a bolus of insulin will typically have 50% of its pharmacodynamic effect remaining after3 hours. Most insulin pumps have an insulin-on-board (IOB) feature to assist in bolusing decisions.8,9 A number of control strategies have been developed to account for the insulin time action profile. Ellingsen and collegues10 presented a model predictive control (MPC) strategy with IOB compensation. Lee and associates11 presented an IOB-based proportional-integral-derivative (PID) control strategy, whereas Lee and colleagues12 provided a preliminary assessment of IOB-based internal model control and MPC algorithms. Because of the nonlinearity and uncertainty of insulin-to-glucose dynamics, an addition of a constraint based on the IOB amount is desirable; however, if an accurate model is used in MPC, the controller may not require the IOB constraint as presented in Lee and colleagues.12 Steil and associates13 proposed reducing the infusion of a PID controller by incorporating a term that is proportional to the predicted plasma insulin concentration, based on a pharmacokinetic model; the basic goal is to consider that previously delivered insulin is still having a glucose reduction effect.
Weinzimer and colleagues14 implemented PID control in clinical studies in 17 adolescents with type 1 diabetes. They found that a hybrid closed-loop system, where a meal insulin bolus is given in conjunction with a closed-loop controller, results in improved regulation of postprandial hyperglycemia compared to feedback-only control.
In an ideal scenario, an individual would estimate the carbohydrate (CHO) content of the meal and provide a meal insulin bolus based on a carbohydrate/insulin ratio. Burdick and colleagues15 found that missed mealtime boluses are the major cause of suboptimal glycemic control in youths with type 1 diabetes. Two missed boluses per week result in a half-point rise in hemoglobin A1c values, which can result in long-term complications, such as heart disease, stroke, retinopathy, nephropathy, and neuropathy. This has motivated recent research to detect meals automatically and either advise the subject to provide a meal insulin bolus or automatically give a bolus as part of an automated closed-loop system. Dassau and colleagues16 developed a meal detection algorithm, whereas Lee and Bequette17 combined a meal detection and meal size estimation (MSE) algorithm as part of an MPC-based artificial pancreas strategy.
Computer simulations of subjects with type 1 diabetes that incorporate subcutaneous insulin, meal absorption, and insulin–glucose dynamics can provide important tests of artificial pancreas control algorithms4,18–20; indeed, many of the control articles cited earlier are based on computer simulation results. While these simulations may not include all of the challenging characteristics of “real-world” subjects with type 1 diabetes, a wide range of model parameters can be studied to test the robustness of proposed control algorithms. Kovatchev and colleagues21 presented an overview of a simulation model that has been approved by the Food and Drug Administration (FDA); a verification of performance results using this model will allow investigators to skip animal studies and proceed directly to human clinical trials. Patek and associates22 provided guidelines for proof-of-concept simulation-based testing of control algorithms.20
We developed an integrated artificial pancreas system that includes insulin-on-board constraints based on the use of a pharmacodynamic model, as well as a meal detection and meal size estimation algorithm, as shown in Figure 1. The MSE provides meal insulin boluses when the meal is not announced by the subject. In silico subjects of 100 adolescents and 100 adults from the recently FDA-approved computer simulator20 are studied using the proposed integrated artificial pancreas system. The closed-loop performances of three cases—MPC-only, MPC with the previous meal size estimation algorithm,17 and MPC with the newly proposed meal size estimation algorithms—are compared. Advantages of the integrated system involving feedback and feed-forward controllers are discussed.
Figure 1.
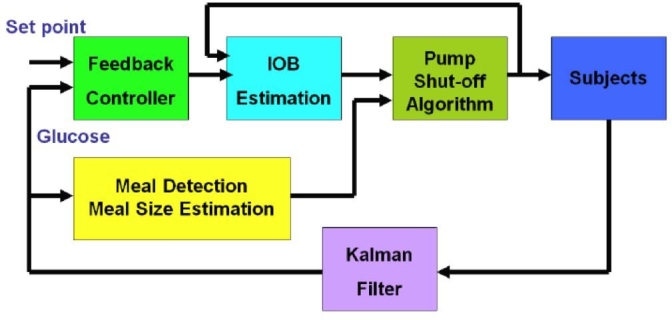
A schematic diagram of the proposed integrated artificial pancreas system for closed-loop glucose control.
Insulin-on-Board Constraints
The remaining activity of insulin delivered in the past is known as insulin on board. IOB curves are generated based on insulin pharmacodynamics, or time-activity profiles, obtained from glycemic clamp studies. We have found that two-compartment models fit these time-action profiles quite well. The analytical solution for IOB for a two-compartment model with equal time constants is
| (1) |
where δ is the magnitude of an insulin bolus and τIOB is the time for peak insulin activity (also the compartment time constant). Typically, τIOB varies from 90 to 180 minutes, which corresponds to insulin action times of 4–8 hours. This article uses τIOB = 100 minutes and varying maximum IOB amounts.
Determination of Maximum IOB Constraint
Four steps are used to determine a maximum IOB constraint based on an individual's biometric information and real-time glucose readings. Under noisy conditions, estimated glucose and rate of change of glucose are obtained using a Kalman filter. The four steps:
A basal rate is obtained from the biometric information and then adjusted based on the initial glucose concentration.
An aggressiveness parameter is selected.
The total daily insulin (TDI) requirement is obtained from biometric data.
A real-time maximum IOB constraint is determined using the estimated glucose concentration.
Step 1: Set the initial insulin infusion rate uo
| (2) |
where ubasal is the basal insulin rate and Go is the steady glucose concentration based on ubasal.
Step 2: Set the initial allowableIOBbasal
| (3) |
where aIOB is an aggressiveness factor for the maximum IOB, with a range of 3–7 [hours]. For example, aIOB = 5 [hour] has 5 hours worth of basal rate insulin as the maximum IOB constraint.
Step 3: In addition to IOBbasal, set IOBTDI based on individual's TDI such that
| (4) |
Step 4: Finally, IOBmax is determined using basal rate, TDI, and rate of change of glucose:
| (5) |
where a 5-minute sample time is used for the insulin pump (Insulet OmniPod system), while glucose is measured continuously with a 1-minute sample time, ĝ is the estimated glucose [mg/dl], Δĝ is the estimated rate of change of glucose [mg/dl min], and Δ2ĝ is the estimated rate of change of the rate of change of glucose [mg/dl min2] using a Kalman filter. Equations (2), (4), and (5) provide sequential conditions; it will check from the first to the last conditions, ending with the last satisfied condition.
Pump Shut-Off Procedure
The pump shut-off algorithm uses a linear prediction (ĝt + Δt) from time t assuming a constant rate of change of glucose (Δĝ) over Δt minutes.
| (6) |
where Δĝt is the estimated rate of change of glucose from a Kalman filter with a 1-minute sampling time in glucose. The linear prediction is computed in the following
| (7) |
where ĝ1 + Δt is the predicted glucose from the estimated glucose, ĝ is the estimated glucose, and Δĝ is the estimated rate of change of glucose using a Kalman filter. The pump shut-off algorithm is used with a set of threshold glucose of 100 mg/dl and a 60-minute prediction horizon in the following
| (8) |
In addition, insulin infusion rate constraints are given
| (9) |
where the sampling time is 5 minutes for the insulin pump and 1 minute for the glucose measurement.
Meal Detection and Meal Size Estimation for Feed-Forward Action
It is clear from clinical results14 and previous simulation results12,17 that better postprandial performance is obtained if a “meal announcement” is used; this is commonly known as feed-forward control. The reality is that subjects with type 1 diabetes, particularly teenagers, often forget to provide a meal bolus. An important part of an artificial pancreas strategy, therefore, is to incorporate a meal detection algorithm to either alarm the individual that they may have missed a meal bolus or to deliver a meal insulin bolus automatically.
Dassau and colleagues16 used a voting scheme to detect meals based on a combination of four different algorithms. In previous work, we developed meal detection and meal size estimation algorithms using a set of threshold values and a finite impulse response filter.12,17 This article presents a new meal size estimation procedure that generates a series of meal impulses.
The main goal of the new meal size estimation procedure is to give reasonable amounts of insulin boluses based on a series of meal impulses, not to estimate accurate meal carbohydrate sizes on each meal.12,17 The new estimation algorithm is based on continuous observations of the first and second derivatives of glucose to produce a series of meal impulses when a set of conditions are satisfied. One meal possibly generates several impulses and the sum of its meal impulses is bounded, e.g., by a sum of 15 impulses over a 30-minute time window. These meal impulses are converted into grams of carbohydrate by a scaling factor that can be different for each individual.
A daily meal normally causes Δĝ increases with a range of 0–2 [mg/dl min] and Δ2ĝ with a range of 0–0.02 [mg/dl min2], as shown in Figure 2. We used four threshold values for Δĝ by {0, 0.5, 1.25, and 1.8}[mg/dl min] and Δ2ĝ by {0, 0.005, 0.0125, and 0.018}[mg/dl min2]. First, both Δĝ and Δ2ĝ cross 0 when there is an incoming meal. After crossing 0, the maximum values of Δĝ and Δ2ĝ are related to meal sizes. Often Δĝ and Δ2ĝ have a time delay between them; therefore, a time window of 20–30 minutes is used to detect a meal (see Step 1). The magnitudes of meal impulses and the threshold values of Δĝ and Δ2ĝ are obtained by observation through the simulation study of 20 in silico subjects. An additional condition to detect a meal is when Δĝ and Δ2ĝ cross each other (see Step 2), which is useful for delayed meal responses or larger meals (see Figure 3). Figures 2 and 3 show that a single meal could cause a series of meal impulses, possibly with different magnitudes.
Figure 2.
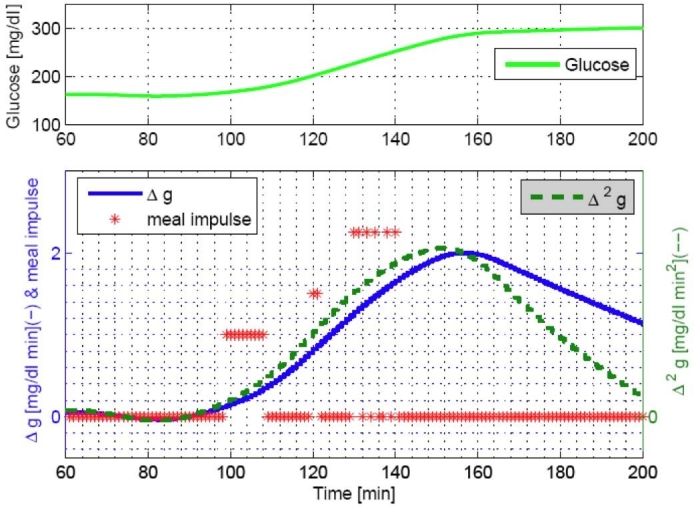
Estimated rate of change of glucose for a meal of 80 grams of CHO consumed at 60 minutes.
Figure 3.
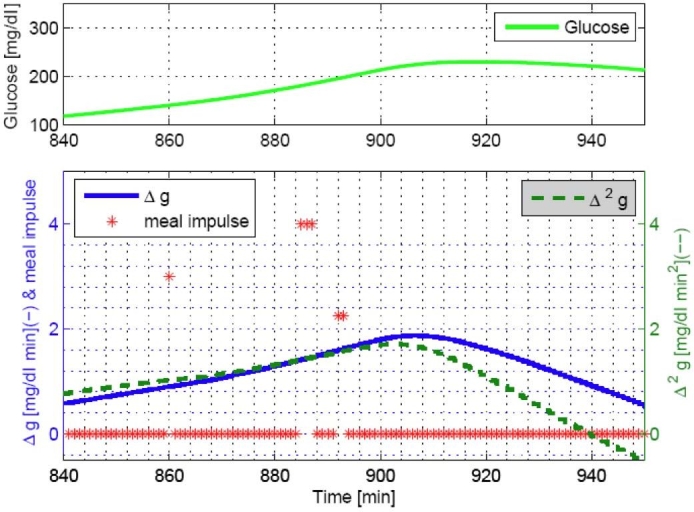
Observation of a crossing point of Δĝ and Δ2ĝ when a meal of 40 grams CHO is consumed at 840 minutes.
Step 3 involves an amplification procedure of meal impulses depending on a meal response speed. Step 4 provides an adjustment based on TDI to allow larger insulin boluses for individuals with high TDI or ignores meal estimates for the low TDI. Individuals with low TDI have high insulin sensitivity, and a feedback-only controller may be sufficient. A constraint on meal impulse estimation is given in Step 5, and each dimensionless meal impulse is converted into grams of carbohydrates in Step 6.
The following conditions for each step are described in detail with threshold values to generate meal impulses .
Step 1 detects meals and estimates dimensionless meal impulses (see Figure 2):
| (10) |
Step 2 detects a crossing point of Δĝ and Δ2ĝ (see Figure 3):
| (11) |
Step 3 amplifies the estimated meal impulses of sharp or slow but steady glucose increases:
| (12) |
Step 4 adjusts estimated meal impulses for higher TDI individuals and ignores meal impulses for lower TDI individuals:
| (13) |
Step 5 constrains amounts of meal impulses for a specified time window, i.e., a sum of 15 impulses is allowed for a 30-minute time window:
| (14) |
Step 6 converts dimensionless impulses into grams of carbohydrates, which can be individually scalable:
| (15) |
where is a dimensionless meal impulse, is the amount (grams) of CHO meal impulse, and wm is a conversion parameter. Currently, wm = 4 [g CHO] is used in the meal size estimation algorithm; therefore, the total estimated meal sizes are bounded by 60 grams of carbohydrates for 30 minutes. The 30-minute time window and 15-impulse bound can be changed for individual diabetic subjects. Inputs for the meal size estimation are estimated glucose, first and second derivatives from a three-state Kalman filter, and the sample time is 1 minute for an insulin bolus.
An example test with an in silico adult subject demonstrated the meal estimation results in Figures 4 and 5 using a simulation protocol of 40 grams CHO (breakfast at 7 am), 50 grams CHO (lunch at noon), 20 grams CHO (snack at 4 pm), and 80 grams CHO (dinner at 6 pm), as discussed later. Figure 5 presents an adolescent subject with a second meal-like postprandial excursion after a dinner meal that was detected as a small meal around 11 pm each day. A small meal, such as the snack of 20 grams CHO at 4 pm, was not detected in both cases, and breakfast on the first day was also not detected in the latter subject.
Figure 4.
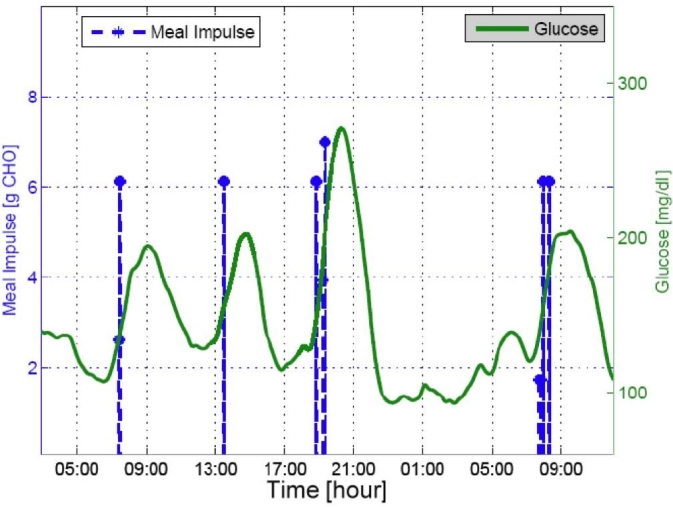
Meal estimation results with adult subject 3.
Figure 5.

Meal estimation results with adult subject 9.
Model-Based Controller Development
For model-based controller design, appropriate models were obtained through system identification procedures on 20 in silico subjects (10 adolescents and 10 adults).20 Two separate models were estimated using subspace identification methods23,24 based on impulse tests for insulin and meal, respectively, using the “adult average” subject in the simulator. These models were combined into one linear model and were used in a single, fixed MPC algorithm that was applied to all 200 subjects. The MPC was integrated with the IOB algorithm to adjust control outputs based on insulin on board.
Model Predictive Control
Plant-model mismatch can be compensated by either input state or additive output disturbance compensation.25,26 Although input state disturbance estimation typically provides faster rejection, it may cause aggressive insulin delivery, resulting in hypoglycemia. The additive disturbance compensation25,27 is used with feed-forward control based on the meal size estimation proposed in this article.
Model Predictive Control Formulation with Additive Output Disturbance
At each time k, the model prediction error is corrected as
| (16) |
where the current filtered output measurement is used to adjust the current model prediction and pk is the model prediction error. The filtered output is the estimated glucose concentration using a Kalman filter with different tuning than the one used in the meal size estimation algorithm. As a result, the model update is
| (17) |
where F is the dynamic state matrix, Gu is the input (insulin) matrix, Gd is the disturbance (meal) matrix (used only for “meal announcements”), and C is the output matrix.
Quadratic Programming Formulation
The MPC objective function is formulated with a prediction horizon P, a control horizon M, an output weight Wy, and a control move weight WDu
| (18) |
where rk is set to 100 mg/dl as a control target. While computing the optimal insulin infusion rates, an infeasible solution might be generated using output constraints. If this occurs, we relax the output constraints in solving the quadratic program. MPC satisfies input constraints at every sampling time.
Closed-Loop Simulation Results Based on a Clinical Protocol
A clinical protocol was generated to test the safety and performance of the closed-loop artificial pancreas system. A 36-hour closed-loop time was planned with four meals and one snack. During closed–loop, all insulin delivery was controlled by the controller and meal boluses were delivered using meal size estimation.
Simulated Protocol
Day 1: A subject was admitted at 5 pm and had a meal of 80 grams CHO at 6 pm with a proper bolus. The loop was closed at midnight and performance assessment started at 3 am.
Day 2: The subject took a breakfast of 40 grams CHO at 7 am, a lunch of 50 grams CHO at noon, a snack of 20 grams CHO at 4 pm, and a dinner of 80 grams CHO at 6 pm.
Day 3: A breakfast of 40 grams CHO was consumed at 7 am and the experiment was stopped at noon.
Three MPC cases were considered: (1) MPC only, (2) MPCwith the previous meal size estimation algorithm,17 and (3) MPC with the new MSE algorithm proposed in this article. The tuning parameters [P = 120 minutes, M = 5, Wy = 1, and WDu = 0.1] were used with Δumax = 5 U/hr, umax = 20 U/hr, ymin = 60 mg/dl, and ymax = 200 mg/dl.
The closed-loop results of MPC with 100 adolescents and 100 adults, which were performed at the Jaeb Center for Health Research (Tampa, FL), are presented in Figure 6 and Tables 1–3. The MPC-only case provided the highest mean glucose for the adolescents [159 mg/dl] and the adults [145 mg/dl], respectively (see Table 1). Using the previous MSE algorithm, mean glucoses were improved from the MPC-only case such that 148 mg/dl for the adolescents and 139 mg/dl for the adults, as shown in Table 2. Glucose time in the target range (70–180 mg/dl) was also increased from 72 to 78% for the adolescents and from 83 to 88% for the adults. The MPC case with the new MSE resulted in the lowest mean glucose of 138 mg/dl for the adolescents and 132 mg/dl for the adults, producing the most desirable result among the three cases (see Table 3). The latter case provided more time in the target of 70–180 mg/dl. Case studies demonstrated the robustness and safety of the integrated system using the IOB algorithm, pump shut-off procedure, and MPC constraints. As a result, MPC with the feed-forward controller using the MSE provided the best glucose control performance.
Figure 6.
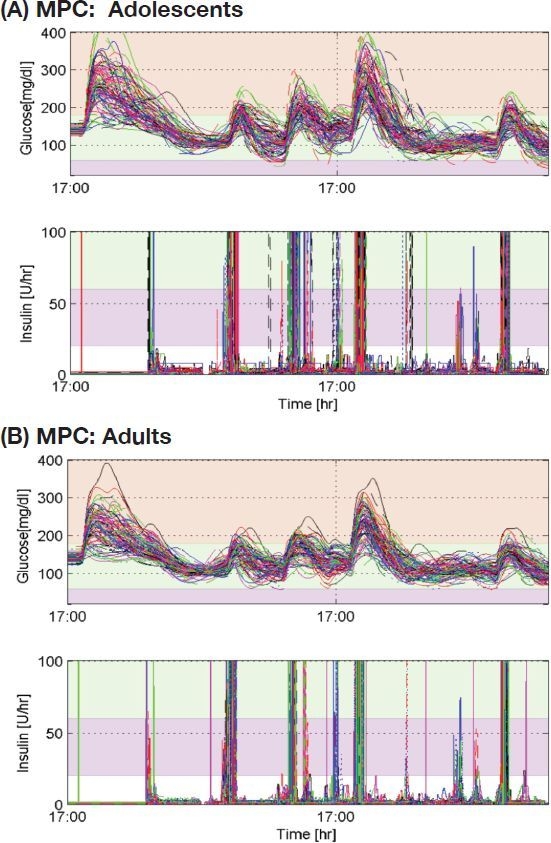
Closed-loop glucose control results of MPC with the new meal size estimation algorithm (P = 120 minutes, M = 5, Wy = 1, and WDu = 0.01), where Δumax = 5 U/hr, umax = 20 U/hr, ymin = 60 mg/dl, and ymax = 200 mg/dl.
Table 1.
Closed-Loop Results of MPC-Only (No Feed-Forward Controller) on 100 Adolescents and 100 Adults: Mean, Minimum (Min), and Maximum (Max) Glucose in [mg/dl]
| Group | Mean | Hemoglobin A1C | Min | Max | [G ≤ 50]a | [50 ≤ G ≤ 70] | [70 ≤ G ≤ 180] | TDI (U) |
|---|---|---|---|---|---|---|---|---|
| Adolescents | 159 | 7.15 | 96 | 297 | 0.00% | 0.09% | 72% | 81 |
| Adults | 145 | 6.69 | 96 | 243 | 0.00% | 0.00% | 83% | 64 |
G stands for glucose [mg/dl].
Table 3.
Closed-Loop Results of MPC with New Meal Size Estimation Algorithm on 100 Adolescents and 100 Adults: Mean, Minimum (Min), and Maximum (Max) Glucose in [mg/dl]
| Group | Mean | Hemoglobin A1C | Min | Max | [G ≤ 50]a | [50 ≤ G ≤ 70] | [70 ≤ G ≤ 180] | TDI (U) |
|---|---|---|---|---|---|---|---|---|
| Adolescents | 138 | 6.43 | 78 | 275 | 0.14% | 1.37% | 82% | 100 |
| Adults | 132 | 6.23 | 84 | 231 | 0.00% | 0.53% | 90% | 72 |
G stands for glucose [mg/dl].
Table 2.
Closed-Loop Results of MPC with Previous Meal Size Estimation Algorithm17 on 100 Adolescents and 100 Adults: Mean, Minimum (Min), and Maximum (Max) Glucose in [mg/dl]
| Group | Mean | Hemoglobin A1C | Min | Max | [G ≤ 50]a | [50 ≤ G ≤ 70] | [70 ≤ G ≤ 180] | TDI (U) |
|---|---|---|---|---|---|---|---|---|
| Adolescents | 148 | 6.78 | 90 | 275 | 0.00% | 0.32% | 78% | 91 |
| Adults | 139 | 6.47 | 95 | 232 | 0.00% | 0.01% | 88% | 68 |
G stands for glucose [mg/dl].
Summary and Conclusions
This article presented an integrated artificial pancreas system that consists of insulin-on-board computation, meal size estimation, and feedback control. IOB computation helps prevent hypoglycemia events during the closed-loop time. The meal size estimation provides an efficient feed-forward controller, automatically giving priming meal boluses based on estimated meal sizes.
While the model and tuning conditions for the three MPC cases are the same, the MPC case with the feed-forward controller using the new MSE provides the best glucose control performance. The new meal size estimation provides more time in the target of 70–180 mg/dl for 82% for the adolescents and 90% for the adults compared to results using the previous MSE. The feed-forward action by the new MSE increases the time of 50 ≤ G ≤ 70 mg/dl; 1.37% for adolescents and 0.53% for adults are observed in Table 3, whereas no significant time is observed in Tables 1 and 2. Moreover, it is useful to specify input and output constraints in MPC to prevent hypo- and hyperglycemia events.
Meal boluses by the MSE reduce glucose peaks and mean postprandial glucoses. Because the meal size estimation is only active when glucose increases rapidly, it makes 6.75% false-positive and 18% false-negative detections while producing 82% true-positive detection out of 800 meals. As shown in Table 4, the mean meal detection time was 31 minutes after the glucose increased 4 mg/dl. The distributions of meal detection times and estimated meal sizes are shown in Figure 7. The lowest minimum glucose for 0–90 minutes after false meal estimations was 76 mg/dl. However, the use of MSE did result in four adolescent subjects having glucose values <50 mg/dl postprandially (Figure 6A).
Table 4.
Performance Analysis of New MSE on 100 Adolescents and 100 Adults
| Total number of meals | 800 |
| Total number of meal detections (true +) | 656 (82.00%) |
| Total number of false positives | 54 (6.75%) |
| Total number of false negatives | 144 (18.00%) |
| Average detection time after meal onsets | 31 [minutes] |
| Mean magnitude of false positvely estimated meals | 36.41 [g CHO] |
| Mean of min glucose of 0–90 min after false positive meals | 119.84 [mg/dl] |
| Min of min glucose of 0–90 min after false positive meals | 75.67 [mg/dl] |
| Max of min glucose of 0–90 min after false positive meals | 180.73 [mg/dl] |
Figure 7.
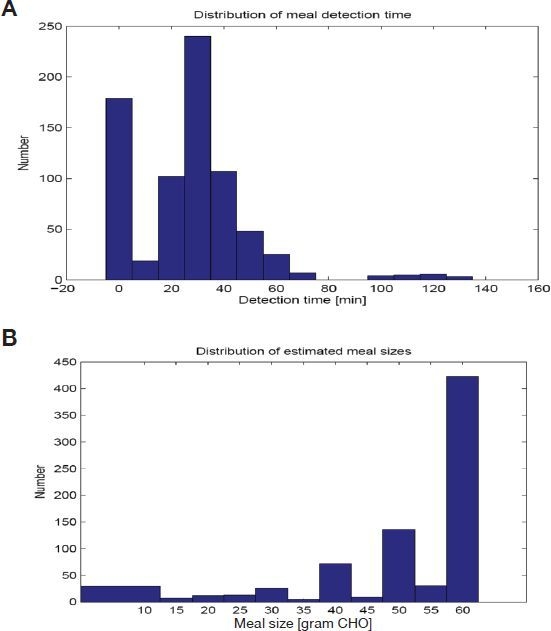
Distribution of (A) meal detection times and (B) estimated meal sizes from results of MPC and new meal size estimation.
The integrated system provides rapid and robust insulin infusions, more suitable for an artificial pancreas system. As a result, a desirable control performance based on a clinical protocol is presented through the simulation study of 200 in silico subjects. Each component provides convenient tuning options from a nominal set that can be individualized further for specific diabetic subjects.
Acknowledgements
The authors greatly thank the efforts of Werner Sauer and John Lum for a number of simulation runs at the Jaeb Center.
Abbreviations
- CHO
carbohydrate
- FDA
Food and Drug Administration
- IOB
insulin on board
- MPC
model predictive control
- MSE
meal size estimation
- PID
proportional-integral-derivative
- TDI
total daily insulin
References
- 1.Bequette BW. A critical assessment of algorithms and challenges in the development of a closed-loop artificial pancreas. Diabetes Technol Ther. 2005;7(1):28–47. doi: 10.1089/dia.2005.7.28. [DOI] [PubMed] [Google Scholar]
- 2.Hovorka R. Continuous glucose monitoring and closed-loop systems. Diabet Med. 2006;23(1):1–12. doi: 10.1111/j.1464-5491.2005.01672.x. [DOI] [PubMed] [Google Scholar]
- 3.Clemens A, Chang P, Myers R. The development of Biostator, a Glucose Controlled Insulin Infusion System (GCIIS) Horm Metab Res. 1977;(Suppl 7):23–33. [PubMed] [Google Scholar]
- 4.Hovorka R, Canonico V, Chassin LJ, Haueter U, Massi-Benedetti M, Federici MO, Pieber TR, Schaller HC, Schaupp L, Vering T, Wilinska ME. Nonlinear model predictive control of glucose concentration in subjects with type 1 diabetes. Physiol Meas. 2004;25(4):905–920. doi: 10.1088/0967-3334/25/4/010. [DOI] [PubMed] [Google Scholar]
- 5.Doyle FJ, 3rd, Jovanovic L, Seborg D. Glucose control strategies for treating type 1 diabetes mellitus. J Process Control. 2007;17(7):572–576. [Google Scholar]
- 6.Magni L, Raimondo DM, Bossi L, Man CD, Nicolao GD, Kovatchev B, Cobelli C. Model predictive control of type 1 diabetes: an in silico trial. J Diabetes Sci Technol. 2007;1(6):804–812. doi: 10.1177/193229680700100603. [DOI] [PMC free article] [PubMed] [Google Scholar]
- 7.El-Khatib FH, Jiang J, Damiano ER. Adaptive closed-loop control provides blood-glucose regulation using dual subcutaneous insulin and glucagon infusion in diabetic swine. J Diabetes Sci Technol. 2007;1(2):181–192. doi: 10.1177/193229680700100208. [DOI] [PMC free article] [PubMed] [Google Scholar]
- 8.Walsh J, Roberts R. 4th ed. San Diego, CA: Torrey Pines Press; 2006. Pumping insulin: everything you need for success on a smart insulin pump. [Google Scholar]
- 9.Zisser H, Robinson L, Bevier W, Dassau E, Ellingsen C, Doyle FJ, Jovanovic J. Bolus calculator: a review of four “smart” insulin pumps. Diabetes Technol Ther. 2008;10(6):441–444. doi: 10.1089/dia.2007.0284. [DOI] [PubMed] [Google Scholar]
- 10.Ellingsen C, Dassau E, Zisser H, Grosman B, Percival MW, Jovanovic L, Doyle FJ., 3rd Safety constraints in an artificial β cell: an implementation of model predictive control with insulin on board. J Diabetes Sci Technol. 2009;3(3):536–544. doi: 10.1177/193229680900300319. [DOI] [PMC free article] [PubMed] [Google Scholar]
- 11.Lee H, Buckingham B, Bequette BW. An insulin-on-board formulation of a proportional-integral-derivative controller for a closed-loop artificial pancreas. J Diabetes Sci Technol. 2009;3(2):A101. [Google Scholar]
- 12.Lee H, Buckingham B, Wilson D, Bequette BW. Comparison of control algorithms for a closed-loop artificial pancreas based on in silico studies and a patient population database. J Diabetes Sci Technol. 2009;3(2):A102. [Google Scholar]
- 13.Steil GM, Panteleon KR. Closed-loop insulin delivery--the path to physiological glucose control. Adv Drug Delivery Rev. 2004;56:125–144. doi: 10.1016/j.addr.2003.08.011. [DOI] [PubMed] [Google Scholar]
- 14.Weinzimer SA, Steil GM, Swan KL, Dziura J, Kurtz N, Tamborlane WV. Fully automated closed-loop insulin delivery vs. semi-automated hybrid control in pediatric patients with type 1 diabetes using an artificial pancreas. Diabetes Care. 2008;31(5):934–939. doi: 10.2337/dc07-1967. [DOI] [PubMed] [Google Scholar]
- 15.Burdick J, Chase HP, Slover R, Knievel K, Scrimgeour L, Maniatis AK, Klingensmith G. Missed insulin meal boluses and elevated hemoglobin A1c levels in children receiving insulin pump therapy. Pediatrics. 2004;113(3 Pt 1):e221–e224. doi: 10.1542/peds.113.3.e221. [DOI] [PubMed] [Google Scholar]
- 16.Dassau E, Bequette BW, Buckingham BA, Doyle FJ., 3rd Detection of a meal using continuous glucose monitoring: implications for an artificial beta-cell. Diabetes Care. 2008;31(2):295–300. doi: 10.2337/dc07-1293. [DOI] [PubMed] [Google Scholar]
- 17.Lee H, Bequette BW. A closed-loop artificial pancreas based on MPC: human-friendly identification and automatic meal disturbance rejection. Biomed Signal Processing Control. 2009 In press. [Google Scholar]
- 18.Tatti P, Lehmann ED. Using the AIDA--www.2aida.rog--diabetes simulator. Part 1: Recommended guidelines for health-carers planning to teach with the software. Diabetes Technol Ther. 2002;4(3):401–414. doi: 10.1089/152091502760098546. [DOI] [PubMed] [Google Scholar]
- 19.Bergman RN, Ider YZ, Bowden CR, Cobelli C. Quantitative estimation of insulin sensitivity. Am J Physiol. 1979;23(6):E667–E677. doi: 10.1152/ajpendo.1979.236.6.E667. [DOI] [PubMed] [Google Scholar]
- 20.Kovatchev B, Breton M, Man CD, Cobelli C. In silico model and computer simulation environment approximating the human glucose/insulin utilization. Food and Drug Administration Master File 2008, MAF. p. 1521.
- 21.Kovatchev B, Breton M, Man CD, Cobelli C. In silico preclinical trials: a proof of concept in closed-loop control of type 1 diabetes. J Diabetes Sci Technol. 2009;3(1):44–55. doi: 10.1177/193229680900300106. [DOI] [PMC free article] [PubMed] [Google Scholar]
- 22.Patek SD, Bequette BW, Breton M, Buckingham BA, Dassau E, Doyle FJ, 3rd, Lum J, Magni L, Zisser H. In silico preclinical trials: methodology and engineering guide to closed-loop control in type 1 diabetes mellitus. J Diabetes Sci Technol. 2009;3(2):269–282. doi: 10.1177/193229680900300207. [DOI] [PMC free article] [PubMed] [Google Scholar]
- 23.Ljung L. 2nd ed. New Jersey: Prentice-Hall; 1999. System identification: theory for the user. [Google Scholar]
- 24.Overschee P, Moor BD. N4SID: subspace algorithms for the identification of combined deterministic-stochastic systems. Automatica. 1994;30:75–93. [Google Scholar]
- 25.Bequette BW. Upper Saddle River, NJ: Prentice-Hall; 2003. Process control: modeling, design, and simulation. [Google Scholar]
- 26.Muske KR, Badgwell TA. Disturbance modeling for offset-free linear model predictive control. J Proc Cont. 2002;12:617–632. [Google Scholar]
- 27.Cutler C, Ramaker D. Dynamic matrix control--a computer control algorithm. Proceedings of ACC; San Francisco, CA. 1980. WP5-B. [Google Scholar]