

Abstract
Purpose
To study the effects of 3 prostaglandin analogs, bimatoprost, latanoprost, and travoprost, on aqueous dynamics in the same subjects and to compare techniques of assessing outflow facility.
Design
Experimental study (double-masked, placebo-controlled, randomized paired comparison, 4-period crossover).
Participants
Thirty healthy adult subjects.
Methods
Bimatoprost, latanoprost, travoprost, or a placebo was administered to the left eye once a day in the evening for 7 days, after a minimum 4-week washout period between each session. Tonographic outflow facility was measured by Schiøtz tonography and pneumatonography on day 7. On day 8, the aqueous humor flow rate and fluorophotometric outflow facility were measured by fluorophotometry. Uveoscleral outflow was calculated from the aqueous humor flow rate and outflow facility using the Goldmann equation.
Main Outcome Measures
Facility of outflow, aqueous humor flow rate, intraocular pressure (IOP), and calculation of uveoscleral outflow.
Results
All medications lowered IOP relative to a placebo. None of the drugs affected aqueous humor production. All medications increased outflow facility compared with placebo when measured by Schiøtz and 2-minute pneumatonography (P≤0.02); the apparent increase of outflow facility measured with fluorophotometry and 4-minute pneumatonography did not reach statistical significance. In contrast, uveoscleral outflow was significantly increased by all medications when calculated from 4-minute pneumatonography data, and fluorophotometry and Schiøtz data at higher episcleral venous pressures. The apparent increase found with 2-minute pneumatonography did not reach statistical significance. These differing results in the same patients indicate that differences in measurement techniques, and not differences in mechanism of action, explain previous conflicting published reports on the mechanism of action of the prostaglandins.
Conclusions
Bimatoprost, latanoprost, and travoprost have similar mechanisms of action. All 3 drugs reduce IOP without significantly affecting the aqueous production rate. All drugs increase aqueous humor outflow, either by enhancing the pressure-sensitive (presumed trabecular) outflow pathway or by increasing the pressure-insensitive (uveoscleral) outflow, but the assessment of the amount of flow through each pathway depends upon the measurement technique.
Bimatoprost, latanoprost, and travoprost are relatively new ocular hypotensive medications for the treatment of glaucoma.1–8 Structurally, all 3 compounds are related to pros-taglandin F2α. Both latanoprost and travoprost are pharmacologically classified as prostaglandin analogs, but bimatoprost is considered by some to be a prostamide because it is an amide rather than an ester compound.9 Despite extensive research, controversies remain regarding the mechanism of action and relative clinical efficacy of the 3 compounds.6–8 In monkeys, prostaglandin F2α, latanoprost, and travoprost increase calculated uveoscleral out-flow but not pressure-sensitive flow (usually considered trabecular outflow).10,11 In humans, both latanoprost and bimatoprost increase calculated uveoscleral outflow, but studies differ on their effect on the conventional pressure-sensitive outflow pathway.12–16 If pressure-sensitive out-flow is increased, and the increase is from changes in trabecular meshwork, prostaglandins would represent the first trabecular drugs. They could serve as prototypes for future drugs and also indicate targets for future gene therapy.
Studies using classic Schiøtz tonography find that bi-matoprost and latanoprost increase outflow facility.1,12–14 Studies using pneumatonography have produced varied results. A significant increase in outflow facility was found after treatment with PHXA34, a racemic mixture of latanoprost, with a 4-minute pneumatonography test17 but not with a 2-minute pneumatonography test.18 Toris et al found that outflow facility increased in latanoprost-treated eyes when compared with untreated fellow eyes but not when compared with baseline in the same eye, using a 2-minute pneumatonography test.15 In the same patients, however, latanoprost had no significant effect when using the fluorophotometric method.15 Because uveoscleral outflow cannot be measured directly but must be calculated from the Goldmann equation,19 the amount or proportion of aqueous humor leaving through the conventional outflow pathway directly affects the calculation of how much aqueous exits through the uveoscleral pathway.
The reason for the different results in pressure-sensitive outflow may be due to different measurement techniques. The Schiøtz and pneumatonography techniques use the weight of the tonometer to increase intraocular pressure (IOP), which then decreases during the 4-minute test.20,21 In contrast, the fluorophotometric method decreases IOP with an aqueous suppressant.22 Each technique has advantages and disadvantages. No study has compared these 4 techniques in the same group of subjects. Our study was designed to compare the 4 techniques in the same subjects, assessing the effect of commonly used prostaglandin drugs to determine if differences in published results were due to intersubject variability, technique, or drug effect.
Materials and Methods
For detailed methods, refer to “Appendix” (available online at http://aaojournal.org).
Study Design
The study was a double-masked placebo-controlled randomized paired comparison with a 4-session crossover design. Each subject was enrolled for approximately 16 weeks. This time was divided into 4 periods of treatment with 1 of 4 eyedrops: bimatoprost 0.03% (Lumigan, Allergan, Inc., Irvine, CA), latanoprost 0.005% (Pfizer, Inc., New York, NY), travoprost 0.004% (Alcon Laboratories, Fort Worth, TX), or a placebo (CIBA Vision, Duluth, GA). Subjects were treated for 7 days and had a washout period of at least 4 weeks between each treatment period. This study conformed to the tenets of the Declaration of Helsinki and was reviewed and approved by the institutional review board of the Mayo Clinic. All subjects gave informed consent to participate. The same person (KSL) performed all measurements.
Study Subjects
Thirty-two healthy subjects were recruited. All were normal volunteers, 21 years or older, who had IOPs between 12 and 24 mmHg in both eyes and no history or evidence of glaucoma or other ocular disease, trauma, or surgery. Evaluation included Snellen visual acuity, slit-lamp biomicroscopy, ophthalmoscopy, photogrammetry to measure anterior chamber (AC) volume, and ultrasound pachymetry (DGH-500 Pachette, DGH Technologies, Exton, PA) to measure corneal thickness. Autofluorescence was measured in the AC and cornea.
Treatment Protocol
The study medications and placebo were purchased from the manufacturers and rebottled by the pharmacy at the Mayo Clinic into identical syndiotactic polypropylene dropper bottles to prevent the shape of the bottle from indicating which medication was present. Each subject received the 3 medications and placebo (Hypotears artificial tears), one at a time. The order of treatment was assigned randomly, and neither the subject nor the investigators knew which drug was administered in any particular study interval until the end of the study. All bottles were labeled by the pharmacy to indicate only the subject number and when drops from the bottle were to be instilled.
Each of the 4 sessions of the study commenced with treatment of one study drug or placebo and ended with 2 days of tests of aqueous humor dynamics. The subject self-administered 1 drop of the assigned medication to the left eye each day in the evening (approximately 9 PM) for 7 days. Only the left eye was treated, rather than randomizing treatments between eyes, to allow determination of the return to baseline after drug treatment was stopped and to eliminate the potential for eyes’ different responses. It also allowed the determination of long-term variability of the untreated eye, an important factor in assessing differences in drug effects over the 4-month period. Each patient recorded the exact time of drug administration on a specially designed log sheet.
Each measurement session was followed by a 4-week washout period when no drug or placebo was administered. The IOP was measured before starting the next treatment to confirm no lingering drug effect after the washout period. On day 7 of each treatment session, the patient returned for the measurement of tonographic outflow facility (pneumatonography at 8 AM, Schiøtz tonography at 11 AM), IOP, and episcleral venous pressure (EVP). On day 8 after receiving the last dose of medication the evening before, aqueous flow rate and fluorophotometric outflow facility were measured. The IOP was checked before the Schiøtz examination to verify that it had returned to baseline and that the pneumatonography did not have a lasting hypotensive effect. The sequence of tonographic examinations was kept constant to allow direct comparison of techniques, done exactly the same among the drugs. Mixing testing order could introduce unknown confounding factors causing increased variability in results for each drug.
The container bottles were collected from all subjects, and the drugs in the first 13 bottles (5 latanoprost, 5 bimatoprost, 3 travoprost) were analyzed by high-performance liquid chromatography. This was done to confirm that no degradation had occurred with time or with the rebottling into the syndiotactic polypropylene bottles.
Clinical Measurements
Detailed methods are available in “Appendix” (available at http://aaojournal.org). Intraocular pressure was measured with a pneumatonometer before the start of each treatment session and on day 8. Outflow facility was measured with all 3 commonly used clinical techniques according to published methods: Schiøtz tonography,20 pneumatonography (both 4 minute and 2 minute),18,21 and fluorophotometry.22 Episcleral venous pressure measurements were also performed,23 but the results were variable enough that they were not used. We calculated uveoscleral outflow using assumed EVPs of 8, 9, 10, and 11 mmHg.14,24
Calculated Uveoscleral Outflow
The pressure-insensitive outflow, generally assumed to be uveoscleral flow, was calculated by using a modified Goldmann equation,19 Fu = Ff − C(Pi − Pe), where Fu is uveoscleral outflow, Ff is aqueous humor flow measured by fluorophotometry, Pi is pressure in the AC, Pe is EVP, and C is outflow facility measured by tonography or the flurophotometric method.22 In this study, C was measured on day 7 by tonography and day 8 by fluorophotometry, whereas Ff and Pi were measured on day 8. C was assumed to be the same on day 7 as it was on day 8.
Statistical Analysis
Aqueous humor flow rate, outflow facility, IOP, and uveoscleral outflow measured during treatment with each drug were compared with the same variables during treatment with a placebo. The same variables were also compared between the treated left eye and the untreated right eye, and IOP was compared with IOP before treatment. Comparisons between eyes or before and after treatment within a group were made using paired t tests. The parameters were compared among the treatment groups and placebo using a 1-factor repeated-measures analysis of variance (ANOVA). Significant differences were investigated using the Student–Newman–Keuls procedure to adjust for multiple comparisons. Differences were considered significant if P<0.05. This study had a 90% chance of finding a 5% difference in IOP, 5.4% difference in aqueous flow, and 7.5% difference in outflow facility among medication groups, if these differences existed (n = 30 subjects, α = 0.05, and β = 0.10).
Results
Two of the 32 subjects withdrew from the study after experiencing discomfort from tonography during the first session, and no data were collected from these individuals. The other 30 subjects (15 male, 15 female) completed all aspects of the study. Mean age was 39±9 years (range, 23–56; median, 41). The baseline ocular characteristics of the subjects are summarized in Table 1. The concentrations of the medications in the 13 syndiotactic polypropylene bottles that were analyzed were between 92% and 100% of the intended concentrations. Thus, transfer to the nonoriginal bottles and storage in the bottles did not significantly affect the concentration of the medications.
Table 1.
Baseline Ocular Characteristics and Aqueous Flow Rates on Day 8 of Treatment to the Left Eye
| Right Eye | Left Eye | |
|---|---|---|
| Central corneal thickness | 553±42 μm | 556±42 μm |
| AC volume | 195±41 μl | 201±43 μl |
| IOP (initial visit) | 16.8±2.3 mmHg | 16.6±3.0 mmHg |
| Aqueous flow rates* | ||
| Placebo | 2.37±0.74 μl/min | 2.44±0.83 μl/min |
| Latanoprost | 2.56±0.68 μl/min | 2.65±0.72 μl/min |
| Travoprost | 2.52±0.89 μl/min | 2.73±0.84 μl/min |
| Bimatoprost | 2.38±0.59 μl/min | 2.57±0.75 μl/min |
AC = anterior chamber; IOP = intraocular pressure.
Mean ± standard deviation; n = 30.
No statistically significant differences among treatments or between fellow eyes were present.
At baseline, there were no significant differences in IOP among the groups. As expected, on day 8 all 3 medications lowered IOP from baseline and when compared with the untreated fellow eye, whereas the placebo had no effect (P<0.05; Table 2). The average rate of aqueous humor flow between 8:30 AM and 10:45 AM did not significantly differ with drug treatment compared with placebo treatment (P = 0.33; Table 1). There were no significant differences in flow rate between treated and contralateral untreated eyes after any treatment (P = 0.75).
Table 2.
Summary Data for Intraocular Pressure (Millimeters of Mercury) in Both Eyes
| Right Eye |
Left Eye |
|||||||
|---|---|---|---|---|---|---|---|---|
| Baseline | Day 8 | Change from Baseline (%) | Baseline | Day 8 | Change from Baseline (%) | Posttreatment Difference between Right and Left Eyes | Difference from Placebo | |
| Placebo | 16.0±2.2 | 16.5±2.2 | 0.5±1.7 (3) | 15.8±2.6 | 15.9±2.6 | 0.1±2.1 (1) | −0.6±1.4 | — |
| Latanoprost | 16.4±2.5 | 16.4±2.2 | 0.0±1.8 (0) | 15.5±2.5 | 13.2±2.8 | −2.3±1.9 (−15)* | −3.2±1.8† | −2.7±1.6† |
| Travoprost | 16.5±2.4 | 16.8±2.6 | 0.3±1.6 (2) | 16.1±2.7 | 13.2±2.4 | −2.9±1.7 (−18)* | −3.6±1.9† | −2.7±1.3† |
| Bimatoprost | 16.6±2.5 | 16.6±2.6 | 0.0±2.1 (0) | 16.5±3.1 | 12.6±2.5 | −3.9±2.0 (−24)*‡ | −4.0±1.6*† | −3.3±1.6†‡§ |
Mean ± standard deviation; n = 30.
Significantly different from baseline, P<0.05.
Significantly different from placebo, P<0.05.
Significantly different from latanoprost treatment, P<0.05.
Significantly different from travoprost treatment, P<0.05.
Outflow Facility
Detailed results are available in “Appendix” (available at http://aaojournal.org). Schiøtz tonography found that drug treatments increased the tonographic outflow facility by 38% to 50% compared with placebo treatment of these same eyes, and 57% to 76% when compared with untreated fellow eyes (P<0.001; Table 3). Outflow facility did not significantly differ among drug treatments. Pneumatonography results were mixed, with the 2-minute test finding a 26% to 35% drug-induced increase in outflow facility compared with placebo (P<0.05; Table 3), whereas the 4-minute pneumatonography results were 15% to 21% higher than placebo but the difference did not reach statistical significance (P = 0.07). Outflow facility did not significantly differ among the drug treatments.
Table 3.
Outflow Facility as Measured by the 4 Techniques on Day 7 of Treatment to the Left Eye
| Placebo |
Latanoprost |
Travoprost |
Bimatoprost |
|||||
|---|---|---|---|---|---|---|---|---|
| Right Eye | Left Eye | Right Eye | Left Eye | Right Eye | Left Eye | Right Eye | Left Eye | |
| Schiøtz | 0.23±0.09 | 0.26±0.07 | 0.23±0.10 | 0.36*†±0.10 | 0.21±0.08 | 0.37*†±0.10 | 0.23±0.10 | 0.39*†±0.101 |
| 2-min pneumatonography | 0.22±0.08 | 0.20±0.08 | 0.23±0.13 | 0.25*±0.11 | 0.27±0.13 | 0.26*±0.11 | 0.22±0.10 | 0.27*±0.10 |
| 4-min pneumatonograpy | 0.18±0.07 | 0.19±0.06 | 0.19±0.07 | 0.23±0.08 | 0.20±0.07 | 0.22±0.08 | 0.20±0.09 | 0.23±0.07 |
| Fluorophotometric | 0.40±0.24 | 0.41±0.27 | 0.42±0.25 | 0.57±0.55 | 0.44±0.40 | 0.53±0.27 | 0.37±0.28 | 0.64±0.42 |
Microliters/minute/millimeters of mercury; mean ± standard deviation.
Significantly greater outflow facility than the placebo group, P<0.001.
Significantly greater outflow facility than fellow eye, P<0.001.
Outflow facilities estimated by using the fluorophotometric method were approximately twice as high as those estimated by using the Schiøtz and pneumatonography methods, for both treated and untreated eyes. Although outflow facility values appeared higher than placebo after drug treatment, ranging from 32% to 56%, this was statistically significant only for the bimatoprost versus placebo comparison (Table 3). When compared with fellow eyes, outflow facilities ranged from 24% to 76% higher, although these differences did not reach statistical significance.
Uveoscleral Outflow
All drugs showed increased uveoscleral outflow, although the amount varied among the techniques. Higher changes in calculated uveoscleral outflow were found with tonographic techniques that showed lower conventional tonographic facilities, and similarly smaller changes in uveoscleral outflow were found with techniques that gave higher conventional tonographic facilities. This is in keeping with the nature of the calculation of uveoscleral outflow with the Goldmann equation: because the total IOP change is fixed and aqueous flow did not change, higher changes in tonographic facility must result in lower changes in uveoscleral outflow and vice versa.
Both 4-minute pneumatonographic and fluorophotometic techniques found that all medications increased the uveoscleral outflow compared with the placebo. The pneumatonography increases ranged from 37% to 70%; (P<0.05; Fig 1; complete data in Table 4 [available at http://aaojournal.org]). Values using Schiøtz tonography data were increased by 38% to 50%, but these became statistically significant only at the higher assumed EVPs of 10 and 11 mmHg (Table 4). Values for 2-minute pneumatonography were increased by 25% to 35%, but these were not statistically significant (P = 0.28). When compared with untreated fellow eyes, changes in calculated uveoscleral outflow were generally similar to the above results of drug versus placebo treatment.
Figure 1.
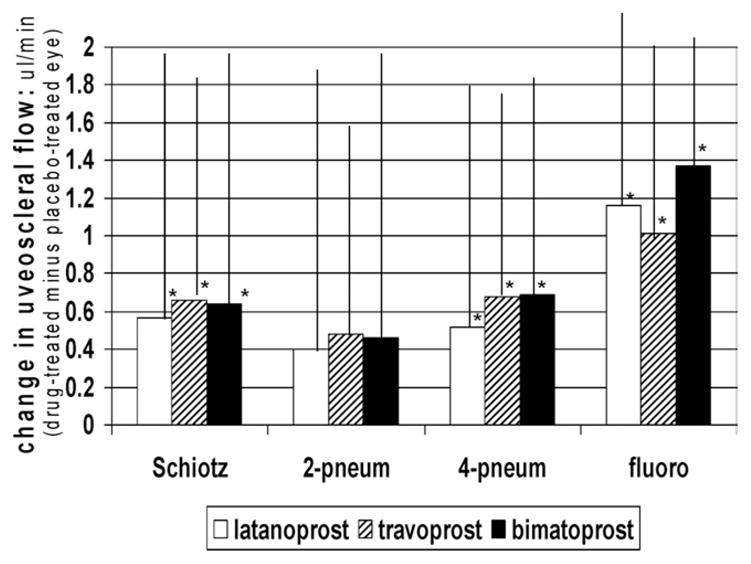
Prostaglandin effects on uveoscleral outflow (episcleral pressure assumed 10 mmHg). Drugs caused increase in uveoscleral flow for 3 of the 4 techniques used. Because these results were all from the same subjects, the differences are technique related and not due to different drug effects on different groups of subjects. Mean ± standard deviation. 2-pneum = 2-minute pneumatonography; 4-pneum = 4-minute pneumatonography; fluoro = fluorophotometric technique. *P<0.05 versus placebo.
Table 4.
Calculated Uveoscleral Flow
| Left |
Right |
|||||||||||||||
|---|---|---|---|---|---|---|---|---|---|---|---|---|---|---|---|---|
| Assumed Episcleral Venous Pressure |
Assumed Episcleral Venous Pressure |
|||||||||||||||
| 8 mmHg |
9 mmHg |
10 mmHg |
11 mmHg |
8 mmHg |
9 mmHg |
10 mmHg |
11 mmHg |
|||||||||
| Mean | SD | Mean | SD | Mean | SD | Mean | SD | Mean | SD | Mean | SD | Mean | SD | Mean | SD | |
| Schiøtz | ||||||||||||||||
| Placebo | 0.46 | 0.93 | 0.72 | 0.91 | 0.98 | 0.90 | 1.25 | 0.90 | 0.59 | 1.20 | 0.82 | 1.15 | 1.05 | 1.10 | 1.28 | 1.07 |
| Latanoprost | 0.84 | 1.40 | 1.20 | 1.37 | 1.55* | 1.34 | 1.91* | 1.33 | 0.63 | 1.36 | 0.86 | 1.29 | 1.09 | 1.23 | 1.32 | 1.17 |
| Travoprost | 0.92 | 1.23 | 1.29 | 1.09 | 1.66* | 1.07 | 2.03* | 1.06 | 0.77 | 1.20 | 0.98 | 1.17 | 1.19 | 1.14 | 1.40 | 1.12 |
| Bimatoprost | 0.86 | 1.26 | 1.24 | 1.24 | 1.63* | 1.23 | 2.01* | 1.22 | 0.76 | 1.39 | 0.98 | 1.36 | 1.21 | 1.34 | 1.43 | 1.33 |
| 2-min pneumatonography | ||||||||||||||||
| Placebo | 0.94 | 0.92 | 1.13 | 0.89 | 1.33 | 0.87 | 1.53 | 0.85 | 0.59 | 1.22 | 0.81 | 1.18 | 1.03 | 1.15 | 1.25 | 1.12 |
| Latanoprost | 1.23 | 1.56 | 1.48 | 1.49 | 1.73 | 1.42 | 1.98 | 1.36 | 0.61 | 1.84 | 0.84 | 1.73 | 1.06 | 1.63 | 1.29 | 1.52 |
| Travoprost | 1.35 | 1.20 | 1.61 | 1.13 | 1.87 | 1.06 | 2.13 | 1.01 | 0.20 | 1.64 | 0.47 | 1.55 | 0.74 | 1.46 | 1.00 | 1.38 |
| Bimatoprost | 1.28 | 1.54 | 1.54 | 1.48 | 1.81 | 1.42 | 2.07 | 1.37 | 0.71 | 1.64 | 0.93 | 1.59 | 1.15 | 1.55 | 1.37 | 1.50 |
| 4-min pneumatonography | ||||||||||||||||
| Placebo | 0.91 | 0.98 | 1.11 | 0.95 | 1.30 | 0.93 | 1.50 | 0.91 | 0.91 | 0.99 | 1.10 | 0.98 | 1.28 | 0.97 | 1.46 | 0.96 |
| Latanoprost | 1.37 | 1.34 | 1.60* | 1.29 | 1.83* | 1.24 | 2.06*† | 1.20 | 0.95 | 0.97 | 1.15 | 0.94 | 1.34 | 0.91 | 1.54 | 0.89 |
| Travoprost | 1.55* | 1.08 | 1.77*† | 1.03 | 1.99*† | 0.98 | 2.21* | 0.94 | 0.78 | 1.20 | 0.98 | 1.16 | 1.18 | 1.12 | 1.38 | 1.09 |
| Bimatoprost | 1.53* | 1.09 | 1.76* | 1.06 | 1.99* | 1.05 | 2.22*† | 1.03 | 0.78 | 1.67 | 0.98 | 1.62 | 1.19 | 1.58 | 1.39 | 1.53 |
| Fluorophotometry | ||||||||||||||||
| Placebo | −0.49 | 2.02 | −0.06 | 1.74 | 0.37 | 1.48 | 0.97 | 0.82 | −0.29 | 1.04 | 0.09 | 0.87 | 0.48 | 0.74 | 0.86 | 0.66 |
| Latanoprost | −0.02 | 1.68 | 0.65* | 1.37 | 1.32*† | 1.24 | 1.99*† | 1.34 | −0.25 | 0.84 | 0.17 | 0.72 | 0.58 | 0.68 | 1.00 | 0.72 |
| Travoprost | 0.22 | 1.48 | 0.78* | 1.35 | 1.34*† | 1.28 | 1.91*† | 1.28 | −0.33 | 1.19 | 0.07 | 1.05 | 0.46 | 1.00 | 0.86 | 1.04 |
| Bimatoprost | 0.26 | 1.90 | 0.91* | 1.74 | 1.56*† | 1.71 | 2.21*† | 1.79 | 0.03 | 0.95 | 0.40 | 0.83 | 0.76 | 0.79 | 1.13 | 0.84 |
SD = standard deviation.
Significantly higher than placebo, P<0.05.
Significantly higher than fellow eye, P<0.05.
Variability over Time
The untreated right eyes were measured simultaneously with the treated left eyes and, thus, provided an estimate of the long-term fluctuation (variability) of IOP, aqueous flow, and outflow values over time. Intraocular pressure was least variable, with a mean coefficient of variation of 8±3% over the 4-month study. Aqueous flow varied by 24±15%. Tonographic outflow values varied by 26±11% for Schiøtz, 42±22% for 2-minute pneumatonography, 30±12% for 4-minute pneumatonography, and 51±30% for the fluorophotometric method. The Schiøtz variability (coefficient of variation) was significantly less than those of the other methods (P<0.03).
Discussion
Bimatoprost, latanoprost, and travoprost lowered IOP in healthy subjects, and none of these drugs suppressed the aqueous humor production rate. These observations are consistent with previous studies1,12–16 and confirm that IOP is lowered by increasing aqueous humor outflow. Both pressure-insensitive (uveoscleral) outflow and tonographic outflow facility (usually considered trabecular outflow) were increased, but the amount of increase varied with the measurement technique used in the study. Two of the 4 methods used to measure outflow facility, Schiøtz tonography and 2-minute pneumatonography, found increases of up 76% when comparing drug and placebo in the same eye (Table 3). These methods generally did not find a significant increase in uveoscleral outflow. In contrast, 4-minute pneumatonography and the fluorophotometric method did not find a significant increase in tonographic outflow facility in these same subjects, but did find an increase in the calculated uveoscleral outflow. Comparison of drug-treated eye versus untreated fellow eye generally found the same results.
Because these differences in outflow were found in the same subjects, it is not intersubject variability but differences in techniques that account for the different results. Because the IOP lowering and total outflow change are fixed quantities, using the Goldmann equation to calculate uveoscleral outflow will result in the finding that for a given IOP drop a large change in trabecular outflow would entail a smaller change in uveoscleral outflow and vice versa. These results explain the differences in previous studies, with some techniques finding an increase in conventional tonographic outflow whereas others did not.12–18
Outflow facility estimated by using the fluorophotometric method was almost twice as high as the facility determined by Schiøtz tonography or pneumatonography. Because these differences were found in the same subjects, they arise from a difference in the techniques and not a difference in cohorts of subjects. This difference is probably related to the method used to change IOP for assessment of facility. Pressure is raised during Schiøtz and pneumatonography by application of the tonometer, whereas it is lowered during the fluorophotometric method by pharmacologically suppressing aqueous humor production. If the pressure–flow relationship is not linear across the full range of pressures used by both methods, then outflow facility, which is the slope of this relationship, would appear higher or lower depending on the range of pressures used in the estimate. In addition, the fluorophotometric method is not always successful in normal subjects because the IOP changes induced by the aqueous suppressants can be small.
The increase in tonographic outflow facility could be due to changes in the trabecular meshwork or from changes in the sclera. Prostaglandin analogs stimulate the prostaglandin FP receptors of human trabecular cells in cell culture.25 This could increase matrix metalloproteases within the meshwork and change the extracellular matrix, similar to the effect proposed on the uveoscleral pathway,26–28 resulting in increased outflow. In the sclera, prostaglandin-induced changes could affect measurement of conventional outflow facility by changing scleral rigidity, by increasing scleral hydraulic conductivity, or both. A decrease in rigidity, caused by a pros-taglandin-induced increase in matrix metalloproteases 1, 2, and 3 in the sclera,29–31 would lead to an underestimation of pressure-sensitive outflow facility. Correction for this would make tonographic values even higher than we found. An increase in sclera permeability29 to aqueous (hydraulic conductivity) could increase pressure-sensitive outflow once fluid reaches the suprachoroidal space. The limiting factor in the mechanism for the pressure insensitivity in this pathway, however, is the small pressure differential between the AC and suprachoroidal space32 and not the scleral permeability. Once aqueous has entered the suprachoroidal space, it is known to exit in a pressure-dependent fashion.33
Which measurement technique is best for assessing aqueous outflow? Although there is no gold standard technique of known accuracy, 6 eyes have been studied with tonography during life followed by laboratory perfusion immediately after enucleation for melanomas or orbital tumors.34,35 Only a 0.3±16% difference in outflow facility was found, indicating to both Grant34 and Becker and Constant35 that Schiøtz tonography gives an accurate assessment of outflow facility. We found that the variability over time was least with Schiøtz tonography (P<0.03 compared with each of the other techniques, untreated right eyes).
In conclusion, all 3 prostaglandin analogs have a similar mechanism of action: the aqueous humor production rate does not change, and aqueous outflow increases. Amounts of increase of uveoscleral outflow and conventional out-flow, however, varied with the measurement technique.
Acknowledgments
The authors thank Richard Brubaker, MD, for advice, help, and thoughtful discussions.
Supported in part by unrestricted grants from Allergan Inc., Irvine, California; Alcon Ltd., Fort Worth, Texas; Research to Prevent Blindness, Inc., New York, New York; National Institutes of Health, Bethesda, Maryland (grant no. EY 07065); and Mayo Foundation, Rochester, Minnesota. Dr Lim is an International Glaucoma Association (United Kingdom) fellow and has received an unrestricted travel grant from Pfizer Inc. (UK).
Appendix
Methods
Intraocular Pressure
Intraocular pressure was measured with a pneumatonometer before the start of each treatment session and on day 8. After administration of 0.5% proparacaine anesthesia, IOP was measured in the right eye first, followed by the left eye. Three measurements were made of each eye and the average recorded as the IOP. On day 8, IOP was measured at 8:40 AM and 10:55 AM, and the mean of the measurements at these 2 times was taken as post-treatment IOP. The pneumatonometer was used for the measurement because it did not require fluorescein, which would have interfered with the fluorophotometric assessment of flow.
Outflow Facility by Pneumatonography
Outflow facility was measured at 8 AM on day 7 by using a pneumatonometer (model 30 Classic Pneumatonometer, Medtronic Solan, Jacksonville, FL). The probe was cleaned and run through a calibration check before each measurement. The flat tip of the probe that indents the cornea has a diameter of 5 mm. A 10-g weight was added to the probe before the tonography, according to the manufacturer’s protocol; the total weight including the probe was 14.7 g.
After both corneas were anesthetized with 0.5% proparacaine, IOP in both eyes was measured with the subject in the sitting position and then in the supine position. Facility of outflow was then measured, right eye first. The contralateral eye was covered with cellophane to prevent the cornea from drying.* Subjects were asked to breathe normally during the procedure and look at a fixation target 6 feet away. The eyelids were held open gently by the examiner without pressing on the globe, and the probe was placed on the cornea for a few seconds before the recording was started. Intraocular pressure was recorded while the probe rested on the central cornea for 4 minutes. The IOP at 2 minutes was noted.
The outflow facility was calculated from lines fitted to the initial and final pressures by a proprietary program built into the pneumatonometer. On some recordings (50 of the 240), the initial or final IOP was obviously erroneous because of blinking, eye movement, or other artifacts. In a separate analysis, this artifactual IOP value was adjusted by the examiner to fit the apparent IOP curve during the measurement, ignoring the artifactual blip in the IOP. This revised IOP was entered into the program, and the facility was recalculated. The 2-minute outflow facility was calculated by the program from the initial IOP and IOP at 2 minutes.
Schiøtz Tonographic Outflow Facility
The recording Schiøtz tonometer used in this study had a concave tip with an external diameter of 10 mm and was used with the standard 5.5-g weight. The total weight of the tip as applied to the cornea was 16.4 g. Outflow facility was measured by this method at 11 AM on day 7, 3 hours after pneumatonography. The IOP was checked before the Schiøtz examination to verify that it had returned to baseline and that the pneumatonography did not have a lasting hypotensive effect. The rate of change in IOP over 4 minutes was measured during application of the Schiøtz tonometer to the central cornea with the subject supine.
The tonometer scale R was estimated from the recorded pressure curve every 30 seconds for the 4 minutes. A second-degree polynomial was fitted to these data by the method of least squares, and the change in the fitted curve between 0 and 4 minutes was used to determine outflow facility by interpolation of the 1955 outflow facility tables. At completion of the study (before the code was broken), all Schiøtz tonography tracings were graded by 3 examiners (DHJ, JWM, Dr Richard Brubaker) to determine if they were of sufficient quality for interpretation. Traces with excess noise or extreme excursions were deemed unfit for use and were excluded from further analysis. This amounted to only 6% (14/240) of the tracings (see “Results”).
Fluorophotometry
The rate of aqueous humor flow was calculated from the rate of fluorescein clearance from the anterior segment on day 8. Fluorescein was self-administered at 2 AM, 1 drop every 5 minutes, 3 to 5 times depending on the participant’s age. A scanning ocular fluorophotometer described by McLaren and Brubaker† was used to measure fluorescein concentration in the AC and cornea. The rate of aqueous humor flow was calculated from the rate of disappearance of fluorescein from the combined cornea and AC:
| [1] |
where ΔMf is the loss of mass of fluorescein from the combined cornea and AC during an interval Δt, Ca is the average concentration of fluorescein in the AC during the same interval (estimated from the initial and final concentrations, assuming an exponential decay), and 0.25 μl/minute is the assumed flow rate equivalent to the diffusional loss of fluorescein from the eye.† The aqueous humor flow rate between 8:30 AM and 10:45 AM was calculated.
Fluorophotometric Outflow Facility
At 10:55 AM, after the second measurement of fluorescence and IOP, either acetazolamide (250 mg) was given orally or a drop of 0.5% timolol was instilled in each eye to reduce IOP by deceasing aqueous humor production.‡ Fluorescence in the anterior segment and IOP were remeasured at 12:10 PM, 1:10 PM, and 2:10 PM. The aqueous humor flow rate (Fa) was determined before acetazolamide or timolol intervention and during three 1-hour intervals after intervention (A, B, or C) by using Equation 1. Fluorophotometric outflow facilities were calculated for each of the 3 intervals by using
| [2] |
where Cfl−x is fluorophotometric outflow facility during each interval (A, B, or C), IOP is IOP just before treatment with the aqueous flow suppressant, and IOPx is the average IOP between the beginning and the end of interval A, B, or C, respectively. Three separate fluorophotometric outflow facilities were calculated, one for each interval, and the average of these was reported as Cfl.
| [3] |
If Cfl was calculated to be negative or >2 standard deviations above the mean, that value was not used in the equation (this accounted for 1 or 2 patients per session; see “Results”).
Episcleral Venous Pressure
An episcleral venomanometer (Eyetech, Morton Grove, IL)§ was used to measure EVP at 11 AM on day 8. The balloon membrane was positioned on the surface of the sclera near the temporal limbus. During continuous viewing of a medium-size vein on the surface of the sclera, the dial on the instrument was turned to increase the pressure within the balloon until the vein collapsed to about half its original diameter. The pressure was read and recorded by a second investigator.
The initial measurements of EVP varied greatly among subjects, between fellow eyes of the same subjects, and with repeated measurements on the same eye several minutes apart. When subjects were asked to perform a Valsalva maneuver, without the knowledge of the examiner, there was no consistent increase in the EVP reading. In view of these inconsistencies, EVP was not used further in this study, and values of 8, 9, 10, and 11 were used to calculate uveoscleral outflow.
Results
Intraocular Pressure
At baseline, there were no significant differences in IOP among the groups. On day 8, effects of drug on IOP were assessed in 3 ways: (1) change from baseline, (2) difference from untreated fellow eye, and (3) difference from placebo (Table 2):
The repeated-measures ANOVA indicated a significant difference in the IOP from baseline among the 4 treatments. Specifically, all 3 medications lowered IOP from baseline, whereas there was no change in IOP after the placebo (P<0.05; Table 2). Bimatoprost decreased IOP by 1.6 mmHg more than latanoprost (P<0.05). The amount of IOP lowering by travoprost was between the other 2 medications and did not statistically significantly differ from either group.
All 3 medications reduced IOP when compared with the untreated right eye (P<0.05; Table 2). The difference after bimatoprost was greater than the difference after latanoprost (−0.9 mm Hg; P<0.05), whereas the travoprost group was between the other groups and did not significantly differ from either.
Repeated-measures ANOVA revealed a significant difference between the 4 treatments. Specifically, all medications reduced IOP when compared with placebo on day 8 (P<0.05; Table 2). The mean IOP with bimatoprost treatment was 0.6 mmHg lower than with latanoprost or travoprost (P<0.05). The latanoprost and travoprost groups did not significantly differ from each other.
Outflow Facility
Schiøtz method
All tracings were graded by the examiners before the treatment was unmasked; 94% (226/240) were good. Twelve of the 14 tracings of poor quality were from the same 3 participants. These 3 participants were considered poor tonography subjects and were therefore eliminated from tonography analysis for Schiøtz and pneumatonography.
Repeated-measures ANOVA indicated a significant difference between the 4 treatments (P<0.001). Drug treatments increased the tonographic outflow facility by 38% to 50% compared with placebo treatment of these same eyes (Table 3). Outflow facility did not significantly differ among drug treatments. When compared with untreated fellow eyes, the increase in outflow facility after drug treatment ranged from 57% to 76% (Table 3).
Pneumatonographic method
The instrument that records pneumatonography has a proprietary program that calculated outflow facility based on the initial and final IOP without regard for the shape of the curve or obvious artifacts at the beginning or end of the tracing. The program allows the user to adjust the initial or final IOP. On 50 of the 240 tracings, the initial or final IOP trace (4-minute tracing) showed a short irregular deflection that affected the IOP and would alter the estimate of facility. We recalculated these facilities after extrapolating the curve 10 seconds before or after the deviation. These corrected data resulted in an overall 10% increase in the mean outflow facility in the 50 tracings (mean increase, 0.02±0.10 μl/minute/mmHg). Twenty-eight of the 50 tracings had higher outflow facility and 22 had lower outflow facility after correction. The corrected values were determined before the coded drugs were unmasked, to avoid bias.
Outflow facilities calculated from the corrected 4-minute pneumatonography did not significantly differ between drug and placebo treatments, ranging from 15% to 21% higher than placebo (P = 0.07). When the uncorrected tracings were used to calculate facility, latanoprost significantly increased facility as compared with the placebo, but effects of the other medications were not significant.
In contrast to the 4-minute pneumatonography curves, when using the first 2 minutes of the pressure curve (2-minute pneumatonography) outflow facilities were increased after drug treatments compared with the placebo in the same eye, ranging from 26% to 35% higher than placebo (P<0.05; Table 3). When compared with fellow eyes, however, outflow facility was not significantly increased (Table 3). Outflow facilities did not significantly differ among the drug treatments.
Uveoscleral outflow
Because of the difficulty in consistently estimating EVP, as others also have noted,|| uveoscleral outflow was calculated with assumed EVPs of 8, 9, 10, and 11 mmHg (Table 4). All medications increased the pressure-insensitive (uveoscleral) outflow compared with the placebo when calculated from the 4-minute pneumatonographic data at all assumed EVPs and fluorophotometric techniques at assumed EVPs of 9, 10, and 11 mmHg. The increases calculated with the 4-minute pneumatonography ranged from 37% to 70%. Changes calculated from the fluorophotometric data were more variable, ranging from 0% to +322% (Table 4). Values using Schiøtz tonography data were increased by 38% to 50%, but these became statistically significant only at the higher assumed EVPs of 10 and 11 mmHg (Table 4). Values for the 2-minute pneumatonography were increased by 25% to 35%, but these were not statistically significant.
When compared with untreated fellow eyes, changes in calculated uveoscleral outflow were generally similar to the above results of drug versus placebo treatment. Calculations using either 4-minute pneumatonography or fluorophotometry revealed increased uveoscleral outflow at EVPs of 10 and 11 mmHg. The apparent increases using Schiøtz tonography and 2-minute pneumatonography values did not reach statistical significance (Table 4).
Discussion
Pneumatonography versus Schiøtz Tonography
Prior studies directly comparing pneumatonography with Schiøtz tonography in the same subjects found that both methods gave the same overall mean outflow facilities, similar to our findings (Table 3), but more variability in the pneumatonography results.¶ Feghali et al surmised that this may be due to the smaller size of the pneumatonometer tip allowing greater mobility on the corneal surface, and more transmission of eye and hand movements to the transducer.¶ The smaller tip of the pneumatonometer results in a higher pressure being applied to the cornea (pressure is force per unit area). Although the total weights of the Schiøtz and pneumatonometer probes are similar, 16.4 g and 14.7 g, the difference in tip sizes, 10 mm vs. 5 mm, results in a 4-fold larger surface area for the Schiøtz tip, and thus, the smaller pneumatonometer tip results in a greater application of pressure. This could cause physical changes to the aqueous outflow system. Direct force applied to the central cornea can open a closed angle by creating a reverse pupillary block and pushing the iris back against the crystalline lens, deepening the AC.# Anterior chamber deepening causes an increase in outflow facility.** If the anterior segment was similarly displaced during pneumatonography, outflow facility would be affected. We did not find outflow facility consistently greater when measured by pneumatonometry than by Schiøtz tonography, however, in keeping with the previous report.¶ Thus any induced changes of the outflow pathway would have been intermittent, perhaps accounting for the increased variability noted with pneumatonography.¶ In a laboratory study, Moses commented that pneumatonography is unsuitable for assessment of outflow facility because it underestimates the magnitude of changes in IOP, and the additional 10-g weight required for tonography causes the scale reading to underestimate IOP during tonography.††
Schiøtz versus Fluorophotometric Tonography
Both Schiøtz and pneumatonography measure the decay of the acutely elevated IOP only and assume aqueous flow changes minimally during this time. In contrast, the fluorophotometric method decreases the IOP, and aqueous flow changes are measured directly rather than assumed.‡ After determining a baseline aqueous flow by fluorophotometry, aqueous flow is decreased by administering timolol or acetazolamide. Aqueous flow and IOP are measured 3 more times, and outflow facility is calculated each time as the ratio of the change in flow to change in pressure. The 3 values are averaged to achieve the reported outflow facility. The high variability and higher out-flow values found with the fluorophotometry technique can be explained in part by the relatively low starting IOP of these normal subjects. Because this technique differs from the others in lowering IOP with aqueous suppressant medications, lower starting IOPs result in smaller IOP differences after medication. Although studies using the fluorophotometry method have been reported in normotensive eyes,‡‡ §§ |||| ¶¶ the technique works best in ocular hypertensive patients, where greater IOP lowering after aqueous suppressive medications can be obtained. Studies in which the fluorophotometric and pneumatonographic techniques were both done find differences between the techniques ranging from −37% to ±50%.‡‡ §§ ## *** In these studies, pneumatonography was done after aqueous suppressive medications had been given, resulting in technically unsatisfactory examinations in up to 45% of patients because of low starting IOP.§§ Studies in which the fluorophotometric and conventional tonographic techniques have been used find differences ranging from −85% to ±20%.‡ ††† Pseudofacility was thought to account for the difference when tonography values were lower than fluorophotometry values.‡ §§
References
- 1.Camras CB, Siebold EC, Lustgarten JS, et al. Maintained reduction of intraocular pressure by prostaglandin F2 alpha-1-isopropyl ester applied in multiple doses in ocular hypertensive and glaucoma patients. Ophthalmology. 1989;96:1329–36. doi: 10.1016/s0161-6420(89)32717-5. discussion 1336–7. [DOI] [PubMed] [Google Scholar]
- 2.Higginbotham EJ, Schuman JS, Goldberg I, et al. One-year, randomized study comparing bimatoprost and timolol in glaucoma and ocular hypertension. Arch Ophthalmol. 2002;120:1286–93. doi: 10.1001/archopht.120.10.1286. [DOI] [PubMed] [Google Scholar]
- 3.Whitcup SM, Cantor LB, VanDenburgh AM, et al. A randomized, double masked, multicentre clinical trial comparing bi-matoprost and timolol for the treatment of glaucoma and ocular hypertension. Br J Ophthalmol. 2003;87:57–62. doi: 10.1136/bjo.87.1.57. [DOI] [PMC free article] [PubMed] [Google Scholar]
- 4.Noecker RS, Dirks MS, Choplin NT, et al. A six-month randomized clinical trial comparing the intraocular pressure-lowering efficacy of bimatoprost and latanoprost in patients with ocular hypertension or glaucoma. Am J Ophthalmol. 2003;135:55–63. doi: 10.1016/s0002-9394(02)01827-5. [DOI] [PubMed] [Google Scholar]
- 5.Netland PA, Landry T, Sullivan EK, et al. Travoprost compared with latanoprost and timolol in patients with open-angle glaucoma or ocular hypertension. Am J Ophthalmol. 2001;132:472–84. doi: 10.1016/s0002-9394(01)01177-1. [DOI] [PubMed] [Google Scholar]
- 6.Parrish RK, Palmberg P, Sheu WP XLT Study Group. A comparison of latanoprost, bimatoprost, and travoprost in patients with elevated intraocular pressure: a 12-week, randomized, masked-evaluator multicenter study. Am J Ophthalmol. 2003;135:688–703. doi: 10.1016/s0002-9394(03)00098-9. [DOI] [PubMed] [Google Scholar]
- 7.Orzalesi N, Rossetti L, Bottoli A, Fogagnolo P. Comparison of the effects of latanoprost, travoprost, and bimatoprost on circadian intraocular pressure in patients with glaucoma or ocular hypertension. Ophthalmology. 2006;113:239–46. doi: 10.1016/j.ophtha.2005.10.045. [DOI] [PubMed] [Google Scholar]
- 8.Eisenberg DL, Toris CB, Camras CB. Bimatoprost and travoprost: a review of recent studies of two new glaucoma drugs. Surv Ophthalmol. 2002;47(suppl):S105–15. doi: 10.1016/s0039-6257(02)00327-2. [DOI] [PubMed] [Google Scholar]
- 9.Woodward DF, Krauss AH, Chen J, et al. Pharmacological characterization of a novel antiglaucoma agent, bimatoprost (AGN 192024) J Pharmacol Exp Ther. 2003;305:772–85. doi: 10.1124/jpet.102.047837. [DOI] [PubMed] [Google Scholar]
- 10.Gabelt BT, Kaufman PL. The effect of prostaglandin F2 alpha on trabecular outflow facility in cynomolgus monkeys. Exp Eye Res. 1990;51:87–91. doi: 10.1016/0014-4835(90)90174-s. [DOI] [PubMed] [Google Scholar]
- 11.Toris CB, Zhan GL, Camras CB, McLaughlin MA. Effects of travoprost on aqueous humor dynamics in monkeys. J Glaucoma. 2005;14:70–3. doi: 10.1097/01.ijg.0000146361.15163.ea. [DOI] [PubMed] [Google Scholar]
- 12.Ziai N, Dolan JW, Kacere RD, Brubaker RF. The effects on aqueous dynamics of PhXA41, a new prostaglandin F2 alpha analogue, after topical application in normal and ocular hypertensive human eyes. Arch Ophthalmol. 1993;111:1351–8. doi: 10.1001/archopht.1993.01090100059027. [DOI] [PubMed] [Google Scholar]
- 13.Brubaker RF, Schoff EO, Nau CB, et al. Effects of AGN 192024, a new ocular hypotensive agent, on aqueous dynamics. Am J Ophthalmol. 2001;131:19–24. doi: 10.1016/s0002-9394(00)00843-6. [DOI] [PubMed] [Google Scholar]
- 14.Christiansen GA, Nau CB, McLaren JW, Johnson DH. Mechanism of ocular hypotensive action of bimatoprost (Lumigan) in patients with ocular hypertension or glaucoma. Ophthalmology. 2004;111:1658–62. doi: 10.1016/j.ophtha.2004.02.006. [DOI] [PubMed] [Google Scholar]
- 15.Toris CB, Camras CB, Yablonski ME. Effects of PhXA41, a new prostaglandin F2 alpha analog, on aqueous humor dynamics in human eyes. Ophthalmology. 1993;100:1297–304. doi: 10.1016/s0161-6420(93)31484-3. [DOI] [PubMed] [Google Scholar]
- 16.Toris CB, Zhan GL, Zhao J, et al. Potential mechanism for the additivity of pilocarpine and latanoprost. Am J Ophthalmol. 2001;131:722–8. doi: 10.1016/s0002-9394(01)00831-5. [DOI] [PubMed] [Google Scholar]
- 17.Alm A, Villumsen J. PhXA34, a new potent ocular hypotensive drug: a study on dose-response relationship and on aqueous humor dynamics in healthy volunteers. Arch Ophthalmol. 1991;109:1564–8. doi: 10.1001/archopht.1991.01080110100045. [DOI] [PubMed] [Google Scholar]
- 18.Dinslage S, Hueber A, Diestelhorst M, Krieglstein GK. The influence of latanoprost 0.005% on aqueous humor flow and outflow facility in glaucoma patients: a double-masked placebo-controlled clinical study Graefes. Arch Clin Exp Ophthalmol. 2004;242:654–60. doi: 10.1007/s00417-003-0835-1. [DOI] [PubMed] [Google Scholar]
- 19.Brubaker RF. Goldmann’s equation and clinical measures of aqueous dynamics. Exp Eye Res. 2004;78:633–7. doi: 10.1016/j.exer.2003.07.002. [DOI] [PubMed] [Google Scholar]
- 20.Grant WM. Tonographic method for measuring the facility and rate of aqueous flow in human eyes. Arch Ophthalmol. 1950;44:204–14. doi: 10.1001/archopht.1950.00910020209003. [DOI] [PubMed] [Google Scholar]
- 21.Langham ME, Leydhecker W, Krieglstein G, Waller W. Pneumatonographic studies on normal and glaucomatus eyes. Adv Ophthalmol. 1976;32:108–33. [PubMed] [Google Scholar]
- 22.Yablonski ME, Cook DJ, Gray J. A fluorophotometric study of the effect of argon laser trabeculoplasty on aqueous humor dynamics. Am J Ophthalmol. 1985;99:579–82. doi: 10.1016/s0002-9394(14)77963-2. [DOI] [PubMed] [Google Scholar]
- 23.Zeimer RC, Gieser DK, Wilensky JT, et al. A practical venomanometer: measurement of episcleral venous pressure and assessment of the normal range. Arch Ophthalmol. 1983;101:1447–9. doi: 10.1001/archopht.1983.01040020449024. [DOI] [PubMed] [Google Scholar]
- 24.Brubaker RF. Measurement of uveoscleral outflow in humans. J Glaucoma. 2001;10(suppl):S45–8. doi: 10.1097/00061198-200110001-00017. [DOI] [PubMed] [Google Scholar]
- 25.Sharif NA, Kelly CR, Crider JY. Human trabecular meshwork cell responses induced by bimatoprost, travoprost, unoprostone, and other FP prostaglandin receptor agonist analogues. Invest Ophthalmol Vis Sci. 2003;44:715–21. doi: 10.1167/iovs.02-0323. [DOI] [PubMed] [Google Scholar]
- 26.Weinreb RN, Lindsey JD. Metalloproteinase gene transcription in human ciliary muscle cells with latanoprost. Invest Ophthalmol Vis Sci. 2002;43:716–22. [PubMed] [Google Scholar]
- 27.Gaton DD, Sagara T, Lindsey JD, Weinreb RN. Matrix metalloproteinase-1 localization in the normal human uveoscleral outflow pathway. Invest Ophthalmol Vis Sci. 1999;40:363–9. [PubMed] [Google Scholar]
- 28.Weinreb RN, Kashiwagi K, Kashiwagi F, et al. Prostaglandins increase matrix metalloproteinase release from human ciliary smooth muscle cells. Invest Ophthalmol Vis Sci. 1997;38:2772–80. [PubMed] [Google Scholar]
- 29.Kim JW, Lindsey JD, Wang N, Weinreb RN. Increased human scleral permeability with prostaglandin exposure. Invest Ophthalmol Vis Sci. 2001;42:1514–21. [PubMed] [Google Scholar]
- 30.Anthony TL, Lindsey JD, Weinreb RN. Latanoprost’s effects on TIMP-1 and TIMP-2 expression in human ciliary muscle cells. Invest Ophthalmol Vis Sci. 2002;43:3705–11. [PubMed] [Google Scholar]
- 31.Weinreb RN, Lindsey JD, Marchenko G, et al. Prostaglandin FP agonists alter metalloproteinase gene expression in sclera. Invest Ophthalmol Vis Sci. 2004;45:4368–77. doi: 10.1167/iovs.04-0413. [DOI] [PubMed] [Google Scholar]
- 32.Alm A. Uveoscleral outflow. Eye. 2000;14:488–91. doi: 10.1038/eye.2000.135. [DOI] [PubMed] [Google Scholar]
- 33.Toris CB, Pederson JE. Effect of intraocular pressure on uveoscleral outflow following cyclodialysis in the monkey eye. Invest Ophthalmol Vis Sci. 1985;26:1745–9. [PubMed] [Google Scholar]
- 34.Grant WM. Experimental aqueous perfusion in enucleated human eyes. Arch Ophthalmol. 1963;69:783–801. doi: 10.1001/archopht.1963.00960040789022. [DOI] [PubMed] [Google Scholar]
- 35.Becker B, Constant MA. The facility of aqueous outflow: a comparison of tonography and perfusion measurements in vivo and in vitro. Arch Ophthalmol. 1956;55:305–12. [PubMed] [Google Scholar]
References
- *.Grant WM, English FP. An explanation of the so-called consensual pressure drop during tonography. Arch Ophthalmol. 1963;69:314–6. doi: 10.1001/archopht.1963.00960040320010. [DOI] [PubMed] [Google Scholar]
- †.McLaren JW, Brubaker RF. A two-dimensional scanning ocular fluorophotometer. Invest Ophthalmol Vis Sci. 1985;26:144–52. [PubMed] [Google Scholar]
- ‡.Yablonski ME, Cook DJ, Gray J. A fluorophotometric study of the effect of argon laser trabeculoplasty on aqueous humor dynamics. Am J Ophthalmol. 1985;99:579–82. doi: 10.1016/s0002-9394(14)77963-2. [DOI] [PubMed] [Google Scholar]
- §.Zeimer RC, Gieser DK, Wilensky JT, et al. A practical venomanometer: measurement of episcleral venous pressure and assessment of the normal range. Arch Ophthalmol. 1983;101:1447–9. doi: 10.1001/archopht.1983.01040020449024. [DOI] [PubMed] [Google Scholar]
- ||.Brubaker RF. Determination of episcleral venous pressure in the eye: a comparison of three methods. Arch Ophthalmol. 1967;77:110–4. doi: 10.1001/archopht.1967.00980020112024. [DOI] [PubMed] [Google Scholar]
- ¶.Feghali JG, Azar DT, Kaufman PL. Comparative aqueous outflow facility measurements by pneumatonography and Schiotz tonography. Invest Ophthalmol Vis Sci. 1986;27:1776–80. [PubMed] [Google Scholar]
- #.Anderson DR. Corneal indentation to relieve acute angle-closure glaucoma. Am J Ophthalmol. 1979;88:1091–3. doi: 10.1016/0002-9394(79)90422-7. [DOI] [PubMed] [Google Scholar]
- **.Grant WM. Experimental aqueous perfusion in enucleated human eyes. Arch Ophthalmol. 1963;69:783–801. doi: 10.1001/archopht.1963.00960040789022. [DOI] [PubMed] [Google Scholar]
- ††.Moses RA, Grodzaki WJ., Jr The pneumatonograph: a laboratory study. Arch Ophthalmol. 1979;97:547–52. doi: 10.1001/archopht.1979.01020010291023. [DOI] [PubMed] [Google Scholar]
- ‡‡.Toris CB, Camras CB, Yablonski ME. Effects of PhXA41, a new prostaglandin F2 alpha analog, on aqueous humor dynamics in human eyes. Ophthalmology. 1993;100:1297–304. doi: 10.1016/s0161-6420(93)31484-3. [DOI] [PubMed] [Google Scholar]
- §§.Toris CB, Yablonski ME, Wang YL, Camras CB. Aqueous humor dynamics in the aging human eye. Am J Ophthalmol. 1999;127:407–12. doi: 10.1016/s0002-9394(98)00436-x. [DOI] [PubMed] [Google Scholar]
- ||||.Toris CB, Koepsell SA, Yablonski ME, Camras CB. Aqueous humor dynamics in ocular hypertensive patients. J Glaucoma. 2002;11:253–8. doi: 10.1097/00061198-200206000-00015. [DOI] [PubMed] [Google Scholar]
- ¶¶.Wang YL, Hayashi M, Yablonski ME, Toris CB. Effects of multiple dosing of epinephrine on aqueous humor dynamics in human eyes. J Ocul Pharmacol Ther. 2002;18:53–63. doi: 10.1089/108076802317233216. [DOI] [PubMed] [Google Scholar]
- ##.Toris CB, Camras CB, Yablonski ME. Acute versus chronic effects of brimonidine on aqueous humor dynamics in ocular hypertensive patients. Am J Ophthalmol. 1999;128:8–14. doi: 10.1016/s0002-9394(99)00076-8. [DOI] [PubMed] [Google Scholar]
- ***.Toris CB, Tafoya ME, Camras CB, Yablonski ME. Effects of apraclonidine on aqueous humor dynamics in human eyes. Ophthalmology. 1995;102:456–61. doi: 10.1016/s0161-6420(95)31000-7. [DOI] [PubMed] [Google Scholar]
- †††.Hayashi M, Yablonski ME, Novack GD. Trabecular outflow facility determined by fluorophotometry in human studies. Exp Eye Res. 1989;48:621–5. doi: 10.1016/0014-4835(89)90004-3. [DOI] [PubMed] [Google Scholar]