Abstract
Background
Improved identification of subjects at high risk for development of type 2 diabetes would allow preventive interventions to be targeted toward individuals most likely to benefit. In previous research, predictive biomarkers were identified and used to develop multivariate models to assess an individual's risk of developing diabetes. Here we describe the training and validation of the PreDx™ Diabetes Risk Score (DRS) model in a clinical laboratory setting using baseline serum samples from subjects in the Inter99 cohort, a population-based primary prevention study of cardiovascular disease.
Methods
Among 6784 subjects free of diabetes at baseline, 215 subjects progressed to diabetes (converters) during five years of follow-up. A nested case-control study was performed using serum samples from 202 converters and 597 randomly selected nonconverters. Samples were randomly assigned to equally sized training and validation sets. Seven biomarkers were measured using assays developed for use in a clinical reference laboratory.
Results
The PreDx DRS model performed better on the training set (area under the curve [AUC] = 0.837) than fasting plasma glucose alone (AUC = 0.779). When applied to the sequestered validation set, the PreDx DRS showed the same performance (AUC = 0.838), thus validating the model. This model had a better AUC than any other single measure from a fasting sample. Moreover, the model provided further risk stratification among high-risk subpopulations with impaired fasting glucose or metabolic syndrome.
Conclusions
The PreDx DRS provides the absolute risk of diabetes conversion in five years for subjects identified to be “at risk” using the clinical factors.
Keywords: adiponectin, biomarkers, C-reactive protein, diabetes risk score, ferritin, hemoglobin A1c, insulin, impaired fasting glucose, interleukin-2 receptor alpha, metabolic syndrome, PreDx Diabetes Risk Score, stratified risk assessment, type 2 diabetes
Introduction
The current gold standard method used in clinical settings for identifying individuals with type 2 diabetes mellitus (T2DM) is the oral glucose tolerance test (OGTT). Even so, the OGTT is not widely used as a risk assessment tool in routine clinical practice because it is inconvenient, time-consuming, and costly.1,2 Fasting plasma glucose is more widely employed because it is more convenient and inexpensive to measure, although it does not predict diabetes onset as accurately as OGTT. An additional shortcoming of standard glucose measures as risk assessment tools is that, by the time the body is no longer able to regulate glucose normally, the disease has been progressing for several years, and complications have already appeared in a significant fraction of individuals.3 This calls into question the rationale of using a single variable that captures only one facet of disease pathology and progression to estimate risk when the risk of harm actually varies based on a wide range of variables2,4,5 and would be better assessed using a multivariable risk score.6
Various guidelines recommend the routine use of clinical risk assessment tools, and a variety of models that use clinical information and/or laboratory measurements for the prediction of future diabetes onset have been developed. However, these models have very low utilization rates because of the challenges and limitations of the OGTT and physician-calculated models.7–9 An improved method for diabetes risk assessment for subjects considered to be “at risk” based on a variety of clinical and anthropometric factors would enable more people to be evaluated and at-risk individuals to be better identified. Ideally, a new method would provide improved risk assessment in a format that facilitates use in routine clinical practice.
Developing a model for assessment of diabetes risk has been challenging because multiple metabolic pathways are dysregulated in T2DM10,11 and dysregulation may begin years or even decades before diagnosis of diabetes.12,13 In our previous study,14 we systematically analyzed multiple biomarkers measured in fasting serum samples and developed a model to predict future diabetes onset.
The objective of the current analysis was to validate this previously developed model in a clinical laboratory setting to provide an objective method for evaluating the risk of developing diabetes within five years. Baseline samples from individuals who developed diabetes within five years (“converters”) and random controls (“nonconverters”) were selected from the Inter99 cohort. Inter99 is a population-based primary prevention study of cardiovascular disease in subjects 30 to 60 years of age selected from 11 municipalities in Copenhagen County, Denmark.15 These samples were used to develop and independently validate the PreDx™ Diabetes Risk Score (DRS) in a clinical laboratory setting.
Materials and Methods
Marker Selection
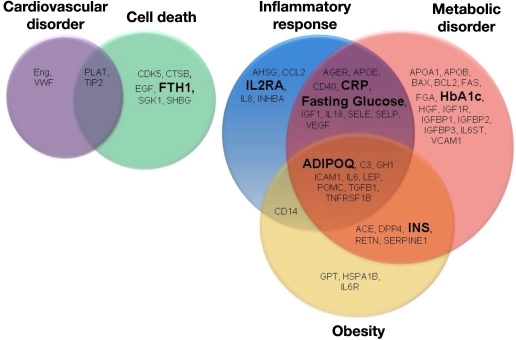
Previously, we measured 58 serum proteins representing multiple biological pathways (Figure 1) using molecular counting technology16 as well as routine laboratory measures [such as fasting plasma glucose, fasting serum insulin, triglycerides, total cholesterol, high-density lipoprotein (HDL) cholesterol, and low-density lipoprotein (LDL) cholesterol] to identify those biomarkers that were most informative for predicting the incidence of T2DM within five years. Using a variety of statistical approaches, predictive biomarkers—adiponectin, C-reactive protein, ferritin, glucose, insulin, and interleukin-2 receptor alpha—were selected for model development.14 We classified these biomarkers as involved in various pathways using Ingenuity® Systems' IPA-Biomarker™ Analysis software (http://www.ingenuity.com).
Figure 1.
Fifty-eight biomarkers representing multiple biological pathways were tested in the initial study using the Inter99 cohort.14 The PreDx DRS logistic regression model comprises six biomarkers previously identified the—adiponectin, C-reactive protein, ferritin, fasting glucose, insulin, and interleukin-2 receptor alpha—plus HbA1c. Assays for these biomarkers markers, shown in large, boldface type, were developed for use in a clinical laboratory. ADIPOQ, adiponectin; CRP, C-reactive protein; FHT1, ferritin; INS, insulin; IL2RA, interleukin-2 receptor alpha.
Clinical Study Design
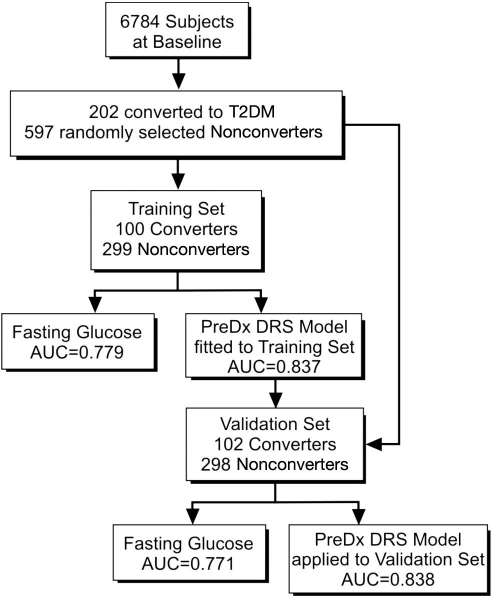
The plan for training and validation of the PreDx DRS model is shown in Figure 2. Of 6784 subjects free of diabetes at baseline who participated in the Inter99 study,15 215 subjects progressed to diabetes (converters) during five years of follow-up. A nested case-control study was performed using serum samples available from 202 converters and 597 randomly selected nonconverters. Samples were randomly assigned to a training set and a validation set comprised of roughly equal numbers of converters and nonconverters with equivalent characteristics at baseline (Table 1). The PreDx DRS logistic-regression model which comprises hemoglobin A1c (HbA1c) plus six biomarkers previously identified14 was fit to the training set (100 converters and 299 nonconverters) and performance assessed by comparing the area under the curve (AUC) of a receiver operator characteristic (ROC) curve of the model to that of fasting glucose alone. The performance of the PreDx DRS model was then validated using the validation set (102 converters and 298 nonconverters) without refitting coefficients.
Figure 2.
Clinical plan to utilize samples for training and validation testing of the PreDx DRS model.
Table 1.
Comparison of the Training and Validation Sets Based on Characteristics of Study Participants at Baseline
| Characteristicsa | Converters | Nonconverters | ||||
|---|---|---|---|---|---|---|
| Training set (N = 100) | Validation set (N = 102) | p value | Training set (N = 299) | Validation set (N = 298) | p value | |
| Age (years) | 50 (45–55) | 50 (45–55) | 0.73 | 45 (40–50) | 45 (40–50) | 0.52 |
| Males (%) | 66 (66) | 67 (65.7) | 1 | 146 (48.8) | 145 (48.7) | 1 |
| BMI (kg/m2) | 28.4 (25.7–32) | 28.6 (26–32.3) | 0.83 | 25.3 (23.1–28.2) | 25.6 (23.3–28.1) | 0.71 |
| Waist circumference (cm) | 94 (87–106) | 95 (89–105) | 0.45 | 85 (75–93) | 86 (76–93) | 0.80 |
| Family history (%) | 23 (23) | 34 (33.3) | 0.12 | 55 (18.4) | 62 (20.8) | 0.47 |
| Total cholesterol (mmol/liter) | 5.7 (5–6.4) | 5.8 (5.1–6.6) | 0.19 | 5.5 (4.8–6.3) | 5.4 (4.7–6.1) | 0.10 |
| HDL cholesterol (mmol/liter) | 1.2 (1.0–1.5) | 1.2 (1.0–1.4) | 0.79 | 1.4 (1.2–1.7) | 1.4 (1.1–1.6) | 0.05 |
| LDL cholesterol (mmol/liter) | 3.51 (2.9–4.3) | 3.75 (3.2–4.4) | 0.20 | 3.5 (2.8–4.2) | 3.4 (2.8–4.1) | 0.41 |
| Triglycerides (mmol/liter) | 1.5 (1.1–2) | 1.6 (1.2–2.3) | 0.13 | 1 (0.7–1.5) | 1 (0.8–1.4) | 0.74 |
| Fasting glucose (mmol/liter) | 6 (5.6–6.4) | 6.1 (5.6–6.5) | 0.93 | 5.4 (5.1–5.8) | 5.4 (5.1–5.7) | 0.96 |
| OGTT (mmol/liter) | 8 (7–9.3) | 8.7 (6.9–9.8) | 0.19 | 5.8 (5.1–6.7) | 5.8 (4.9–6.8) | 0.72 |
Values are medians (interquartile range) and the p values are those associated with a Wilcoxon two sample test except for gender and family history. These latter variables are expressed as counts (%), and a Fisher's exact test is used to compare converters and nonconverters.
Clinical Measurements, Assay Methods, and Calculations
Anthropometric measurements (e.g., body mass index [BMI], blood pressure, and waist), routine laboratory measures (e.g., triglycerides and cholesterol), and the OGTT were performed as described.14 Samples were collected following a 10 h fast and serum stored at -19 °C until analyses. Serum biomarkers were measured using assays developed for use in a clinical laboratory as indicated in Table 2.
Table 2.
Biomarkers Used in the Development of the PreDx Diabetes Risk Score Model
| Marker | Method | Range | % Coefficient |
|---|---|---|---|
| Adiponectina | Sandwich enzyme-linked immunosorbent assay | 0.75 to 30 mg/ml | 3.8% to 12.5% |
| C-reactive proteina | Immuno-turbidometric assay | 0.1 to 10 mg/liter | 1.1% to 6.8% |
| Ferritina | Solid-phase, two-site chemiluminescent immunometric assay | 1.5 to 1500 ng/ml | 1.8% to 4.6% |
| Glucoseb | Hexokinase/glucose-6-phosphate dehydrogenase | 3.2 to 13.8 nmol/liter | 1.0% to 1.1% |
| Hemoglobin A1cb | Ion-exchange high-performance liquid chromatography | 4.7 to 11.3% | 1.4% to 1.9% |
| Interleukin-2 Receptor alphaa | Solid-phase, two-site chemiluminescent immunometric assay | 67 to 7500 U/ml | 3.7% to 6.5% |
| Insulinb | Sandwich enzyme-linked immunosorbent assay | 3 to 11 pmol/liter | <6% |
Tested by Tethys Clinical Laboratory, Emeryville, CA.
Tested by Steno Diabetes Center, Copenhagen, Denmark.
Other Models
Comparison was made to fasting homeostasis model assessment of insulin resistance (HOMA-IR),17 where HOMA-IR was calculated using the HOMA2 Calculator v2.2.18
A noninvasive clinical model was developed using the same approach as that used for biomarker selection and model development.14 Of the noninvasive clinical measures available in the current data set, the subset identified as most informative included age, gender, BMI, waist circumference, and family history. A logistic regression model incorporating these clinical measures was fit on the training set and then applied to the validation set without refitting coefficients.
Stratification of Higher-Risk Subpopulations
Performance of the PreDx DRS was also assessed in three subpopulations of the Inter99 cohort at higher risk for progressing to T2DM within five years, defined by age (>39 years), BMI (≥25 kg/m2), impaired fasting glucose (IFG) (serum glucose 100–125 mg/dl),19 and metabolic syndrome.20 A subject was considered to have metabolic syndrome if three of five criteria were met: waist circumference >35 in. for women or >40 in. for men, triglycerides >150 mg/dl, HDL <50 mg/dl for women or <40 mg/dl for men, blood pressure >130/85 (if either systolic or diastolic pressure is elevated, it is considered a risk), or fasting plasma glucose >100 mg/dl.20 For each of these subpopulations, results were adjusted for five-year incidence of diabetes in Inter99 using Bayes' Rule.
Results
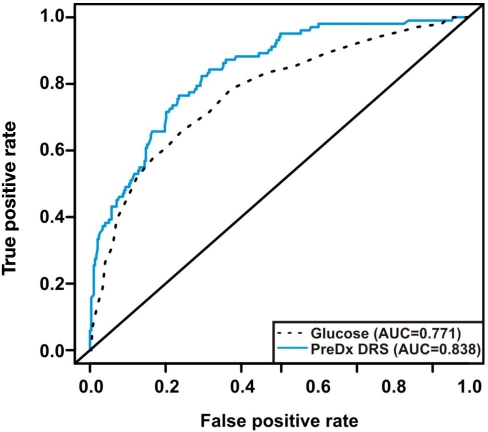
The performance of the PreDx DRS model in estimating the five-year risk of T2DM was assessed by ROC curve analysis (Figure 3). When fitted to the training set, the PreDx DRS model yielded an AUC of 0.837. By comparison, fasting plasma glucose applied to the training set yielded an AUC of 0.779. These results demonstrate that the PreDx DRS model is statistically significantly better than fasting plasma glucose in assessing the five-year risk of T2DM (p = .0003).
Figure 3.
Performance of the PreDx DRS model to assess risk of five-year incidence of T2DM in the validation set from the Inter99 cohort. Shown are ROC curves for the PreDx DRS model that uses the levels of seven biomarkers as compared to fasting plasma glucose alone.
The PreDx DRS model was then applied to the sequestered validation set without refitting model coefficients. When applied to the validation set, the PreDx DRS model yielded an AUC of 0.838. The similarity of the AUCs obtained for the PreDx DRS model on the training and validation sets validates model performance, suggesting the model is not over-fit. As shown in Table 3, the PreDx DRS ranges from 0 to 10, and median and mean scores for converters were statistically different from scores for nonconverters in both the training and the validation sets.
Table 3.
Descriptive Summary Statistics of the PreDx Diabetes Risk Score model
| PreDx DRS model | |||
|---|---|---|---|
| Converter | Nonconverter | ||
| Training (AUC = 0.838) | |||
| Mean PreDx DRS | 6.79 | 3.31 | |
| Standard Deviation | 2.35 | 2.48 | |
| Median | 7.63 | 2.67 | |
| Interquartile range | 5.14–8.52 | 1.21–4.98 | |
| N | 100 | 299 | |
| Validation (AUC = 0.837) | ||
|---|---|---|
| Mean PreDx DRS | 6.76 | 3.42 |
| Standard Deviation | 2.22 | 2.42 |
| Median | 7.16 | 2.88 |
| Interquartile range | 5.46–8.61 | 1.35–5.08 |
| N | 102 | 298 |
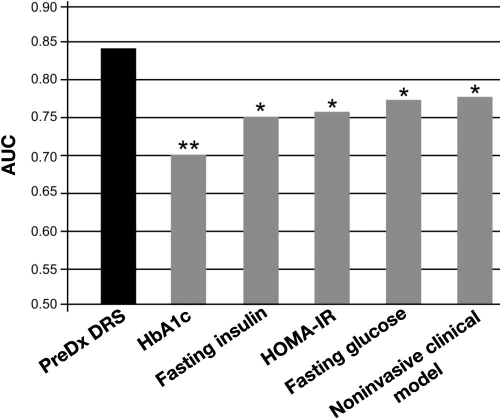
Comparison of AUC values in the validation set also shows that the PreDx DRS model discriminates between converters and nonconverters better than any other clinical measure tested, as illustrated in Figure 4: HbA1c (p < .0001), fasting insulin (p = .0017), HOMA-IR (p = .0039), fasting plasma glucose (p = .0003), and a model derived from noninvasive clinical measures (p = .0069).
Figure 4.
Comparison of the PreDx DRS to other clinical predictors of the risk of progressing to T2DM within five years in the validation set. The noninvasive clinical model is a logistic regression model incorporating age, gender, BMI, waist circumference, and family history. The PreDx DRS model is statistically significantly better than any other clinical predictors tested. **p > 0 to <.001; *p ≥ .001 to <.01.
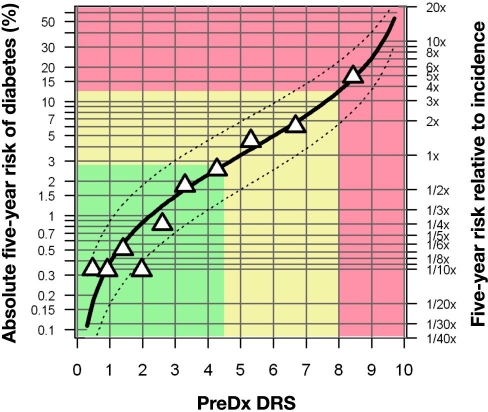
The PreDx DRS model provides a continuous measure of risk of progressing to T2DM within five years. As shown in Figure 5, observed risk is very close to predicted risk, suggesting that that the model is well calibrated. For simplicity, we have defined three risk strata, with low risk defined as PreDx DRS <4.5, moderate risk as PreDx DRS ≥4.5 and <8.0, and high risk as PreDx DRS ≥8.0.
Figure 5.
The PreDx DRS provides a continuous assessment of five-year T2DM risk. Absolute risk is indicated on the left axis, while relative risk is shown on the right axis. The solid black curve represents the relationship between risk and DRS prediction. The dashed curves indicate mean upper and lower 95% confidence intervals on the risk, as estimated from the standard error of the individual risk predictions in the study. The triangles represent deciles of the adjusted study population; the mean observed fraction that converted is plotted versus mean DRS. Details of the development of this risk curve are presented in the Online Appendix of our previous study.14
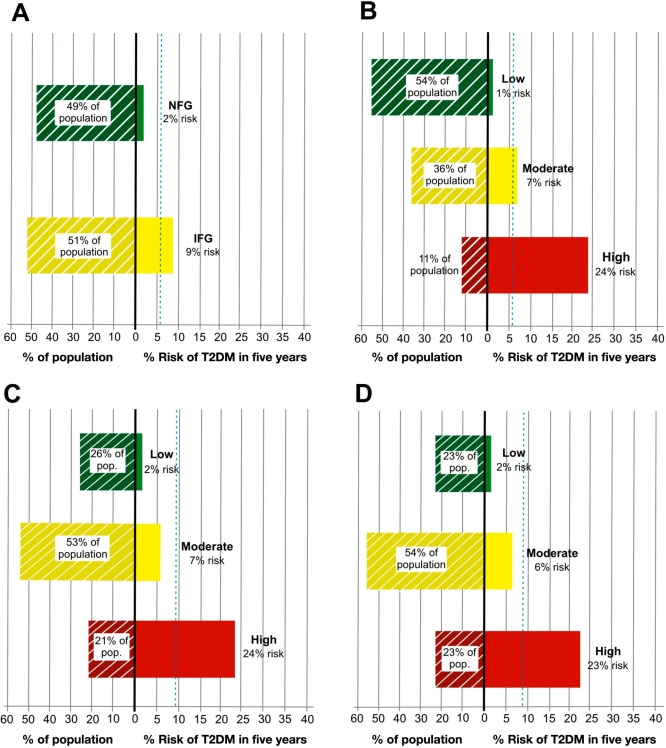
The superior risk stratification of the PreDx DRS also is observed within specific higher-risk subpopulations. For example, fasting glucose status gives only limited stratification among higher-risk individuals >39 years with a BMI ≥25 kg/m2, a subpopulation whose average risk of progressing to T2DM within five years is 5.7%.
By comparison, those with IFG (51% of subpopulation) have a 9% risk, and those with normal fasting glucose (49% of subpopulation) have a 2% risk (Figure 6A). When this same subpopulation is stratified by PreDx DRS, 24% of those classified as high risk (11% of subpopulation) converted to T2DM within five years, while conversion occurred in only 1% of those classified as low risk (54% of subpopulation) (Figure 6B). Hence the PreDx DRS enabled identification of individuals whose actual risk of progressing to T2DM was more than four times higher or four times lower than the average risk (5.7%) for this subpopulation.
Figure 6.
Stratification of various high-risk subpopulations of the Inter99 by fasting glucose class (6A) or PreDx DRS (6B–6D). 6A shows the stratification by fasting glucose class of a high-risk subpopulation age >39 years and BMI ≥25 kg/m2. Panel B shows the stratification of this same high risk population by PreDx DRS. Panel C shows the further stratification by PreDx DRS of a subpopulation age >39 years and BMI ≥25 kg/m2 that also have IFG (serum glucose 100–125 mg/dl). 6D shows the stratification by PreDx DRS of a high-risk subpopulation that has metabolic syndrome. The fraction of each subpopulation in each stratum is indicated. The dashed blue lines indicate the risk of conversion in each subpopulation as a whole, prior to stratification. NFG, normal fasting glucose.
PreDx DRS also successfully stratified even higher-risk subpopulations, such as individuals >39 years with a BMI ≥25 kg/m2 that also have IFG (Figure 6C). As compared to the 9% average risk in the IFG subpopulation, the PreDx DRS identified a subset with a 24% risk (21% of IFG subgroup) as well as a subset with a 2% risk (26% of IFG subgroup) of progressing to T2DM within five years. Similarly, the PreDx DRS provides further stratification of risk among individuals with metabolic syndrome who are considered at high risk for T2DM based on a combination of clinical measurements such as waist circumference, triglyceride levels, HDL levels, blood pressure, and/or fasting glucose (Figure 6D). As compared to the 8.3% average risk in the metabolic syndrome subpopulation, the PreDx DRS identified a subset with a 23% risk (23% of metabolic syndrome subgroup) and a subset with a 2% risk (23% of metabolic syndrome subgroup) of progressing to T2DM within five years.
Discussion
There is great clinical need for a robust and convenient tool for identifying individuals at highest risk of developing T2DM so that clinicians can implement an effective diabetes prevention program that may delay or prevent development of the disease. In this study, we validated a DRS model that provides a quantitative estimate of the risk of progressing to T2DM within five years. The performance of the PreDx DRS model was very similar in the training and validation sets, suggesting that the model is not over-fit and may be generalized to other populations. Moreover, the performance of the PreDx DRS model was superior to other clinical measures in identifying a high-risk subpopulation—this model performed better in assessing T2DM risk than fasting plasma glucose, fasting insulin, HOMA-IR, HbA1c, and a model derived from noninvasive clinical measures.
We developed the PreDx DRS using biomarkers representing multiple pathways implicated in diabetes development, including biomarkers involved in inflammatory response, fat and carbohydrate metabolism, coagulation, metabolic disorders, and cell death. The PreDx DRS model validated in this study utilized assays developed and standardized for use in the clinical laboratory and had very similar performance to the model derived on a research platform.14 It will be important to test multiethnic cohorts to further verify the performance of the PreDx DRS.
The PreDx DRS is a convenient alternative for assessing T2DM risk in a clinical setting. It requires a simple blood draw, which is easily incorporated into routine clinical practice, with testing performed by a Clinical Laboratory Improvement Amendments (CLIA)-certified laboratory (Tethys Clinical Laboratory, Emeryville, CA). A single estimate of absolute five-year risk is then provided to the physician. The PreDx DRS may be used along with other clinical information to identify patients at highest risk for progressing to diabetes—possibly before irreversible organ damage occurs. Early detection of these high-risk individuals could allow for optimal patient management by enabling clinicians to focus appropriate resources earlier to implement a diabetes prevention program.
Conclusion
This study validated the performance of the PreDx DRS and demonstrated that it was better than any other clinical measure tested in estimating the risk of progressing to T2DM within five years. In current clinical practice, both IFG and metabolic syndrome are used to identify subjects who are “at risk” for the development of T2DM. It is of major clinical relevance and significance that the PreDx DRS provides additional information to further stratify risk within these subgroups. By providing a more accurate and convenient measure of T2DM risk, the PreDx DRS may be considered a valuable tool for physicians to use in conjunction with clinical factors to identify individuals with the highest risk of developing diabetes in five years and for whom prevention programs may reduce the serious health consequences of T2DM.
Acknowledgments
The Inter99 study was initiated by T. Jørgensen (principal investigator), K. Borch-Johnsen (principal investigator for the diabetes part), T. Thomsen, and H. Ibsen. The present steering group comprises T. Jørgensen (principal investigator), K. Borch-Johnsen (co-principal investigator), and C. Pisinger. The authors gratefully acknowledge the skillful technical work of Amalia Ocampo and Claudia Elkin, Tethys Bioscience, and thank Anthony Sponzilli for graphic illustrations and Linda Wuestehube for editorial assistance.
Abbreviations
- AUC
area under the ROC curve
- BMI
body mass index
- DRS
Diabetes Risk Score
- HbA1c
hemoglobin A1c
- HDL
high-density lipoprotein
- HOMA-IR
homeostasis model assessment of insulin resistance
- IFG
impaired fasting glucose
- LDL
low-density lipoprotein
- OGTT
oral glucose tolerance test
- ROC
receiver operator characteristic
- T2DM
type 2 diabetes mellitus
References
- 1.Unwin N, Shaw J, Zimmet P, Alberti KG. Impaired glucose tolerance and impaired fasting glycaemia: the current status on definition and intervention. Diabet Med. 2002;19(9):708–723. doi: 10.1046/j.1464-5491.2002.00835.x. [DOI] [PubMed] [Google Scholar]
- 2.Stern MP, Williams K, Haffner SM. Identification of persons at high risk for type 2 diabetes mellitus: do we need the oral glucose tolerance test? Ann Intern Med. 2002;136(8):575–581. doi: 10.7326/0003-4819-136-8-200204160-00006. [DOI] [PubMed] [Google Scholar]
- 3.Wong TY, Liew G, Tapp RJ, Schmidt MI, Wang JJ, Mitchell P, Klein R, Klein BE, Zimmet P, Shaw J. Relation between fasting glucose and retinopathy for diagnosis of diabetes: three population-based cross-sectional studies. Lancet. 2008;371(9614):736–743. doi: 10.1016/S0140-6736(08)60343-8. [DOI] [PMC free article] [PubMed] [Google Scholar]
- 4.Abdul-Ghani MA, Williams K, DeFronzo RA, Stern M. What is the best predictor of future type 2 diabetes? Diabetes Care. 2007;30(6):1544–1548. doi: 10.2337/dc06-1331. [DOI] [PubMed] [Google Scholar]
- 5.Wilson PW, Meigs JB, Sullivan L, Fox CS, Nathan DM, D'Agostino RB., Sr Prediction of incident diabetes mellitus in middle-aged adults: the Framingham Offspring Study. Arch Intern Med. 2007;167(10):1068–1074. doi: 10.1001/archinte.167.10.1068. [DOI] [PubMed] [Google Scholar]
- 6.Mohamed Q, Evans A. Retinopathy, plasma glucose, and the diagnosis of diabetes. Lancet. 2008;371(9614):700–702. doi: 10.1016/S0140-6736(08)60318-9. [DOI] [PubMed] [Google Scholar]
- 7.Ramachandran S, Labib MH. Hyperlipidaemia and primary prevention of coronary heart disease: are the right patients being treated? J Cardiovasc Risk. 2000;7(4):245–249. doi: 10.1177/204748730000700401. [DOI] [PubMed] [Google Scholar]
- 8.Backlund L, Bring J, Strender L-E. How accurately do general practitioners and students estimate coronary risk in hypercholesterolaemic patients? Primary Health Care Res Dev. 2004;5:145–152. [Google Scholar]
- 9.Eaton CB, Galliher JM, McBride PE, Bonham AJ, Kappus JA, Hickner J. Family physician's knowledge, beliefs, and self-reported practice patterns regarding hyperlipidemia: a National Research Network (NRN) survey. J Am Board Fam Med. 2006;19(1):46–53. doi: 10.3122/jabfm.19.1.46. [DOI] [PubMed] [Google Scholar]
- 10.Rhodes CJ. Type 2 diabetes-a matter of beta-cell life and death? Science. 2005;307(5708):380–384. doi: 10.1126/science.1104345. [DOI] [PubMed] [Google Scholar]
- 11.Petersen KF, Shulman GI. Etiology of insulin resistance. Am J Med. 2006;119(5) Suppl 1:S10–S16. doi: 10.1016/j.amjmed.2006.01.009. [DOI] [PMC free article] [PubMed] [Google Scholar]
- 12.Martin BC, Warram JH, Krolewski AS, Bergman RN, Soeldner JS, Kahn CR. Role of glucose and insulin resistance in development of type 2 diabetes mellitus: results of a 25-year follow-up study. Lancet. 1992;340(8825):925–929. doi: 10.1016/0140-6736(92)92814-v. [DOI] [PubMed] [Google Scholar]
- 13.Goldfine AB, Bouche C, Parker RA, Kim C, Kerivan A, Soeldner JS, Martin BC, Warram JH, Kahn CR. Insulin resistance is a poor predictor of type 2 diabetes in individuals with no family history of disease. Proc Natl Acad Sci U S A. 2003;100(5):2724–2729. doi: 10.1073/pnas.0438009100. [DOI] [PMC free article] [PubMed] [Google Scholar]
- 14.Kolberg JA, Jørgensen T, Gerwien RW, Hamren S, McKenna MP, Moler E, Rowe MW, Urdea MS, Xu XM, Hansen T, Pedersen O, Borch-Johnsen K. Development of a type 2 diabetes risk model from a panel of serum biomarkers from the Inter99 cohort. Diabetes Care. 2009;32(7):1207–1212. doi: 10.2337/dc08-1935. [DOI] [PMC free article] [PubMed] [Google Scholar]
- 15.Jørgensen T, Borch-Johnsen K, Thomsen TF, Ibsen H, Glümer C, Pisinger C. A randomized non-pharmacological intervention study for prevention of ischaemic heart disease: baseline results Inter99. Eur J Cardiovasc Prev Rehabil. 2003;10(5):377–386. doi: 10.1097/01.hjr.0000096541.30533.82. [DOI] [PubMed] [Google Scholar]
- 16.Goldfine AB, Gerwien R, Kolberg J, O'shea S, Eastman PS, Fernandez E, Hamilton T, Hein G, McKenna MP, Xu X, Patti ME. Multivariate models of biomarkers in fasting serum to estimate glucose tolerance, insulin sensitivity, and insulin secretion. [In peer review 2009.] [DOI] [PMC free article] [PubMed] [Google Scholar]
- 17.Matthews DR, Hosker JP, Rudenski AS, Naylor BA, Treacher DF, Turner RC. Homeostasis model assessment: insulin resistance and beta-cell function from fasting plasma glucose and insulin concentrations in man. Diabetologia. 1985;28(7):412–419. doi: 10.1007/BF00280883. [DOI] [PubMed] [Google Scholar]
- 18.Diabetes Trials Unit. Oxford: University of Oxford; 2007. HOMA calculator. http://www.dtu.ox.ac.uk/homa. [Google Scholar]
- 19.American Diabetes Association. Standards of medical care in diabetes—2009. Diabetes Care. 2009;33(Suppl 1):S13–S61. doi: 10.2337/dc09-S013. [DOI] [PMC free article] [PubMed] [Google Scholar]
- 20.National Heart Lung and Blood Institute Diseases and Conditions Index. How is metabolic syndrome diagnosed? http://www.nhlbi.nih.gov/health/dci/Diseases/ms/ms_diagnosis.html.


